
August 26 – September 1, 2023
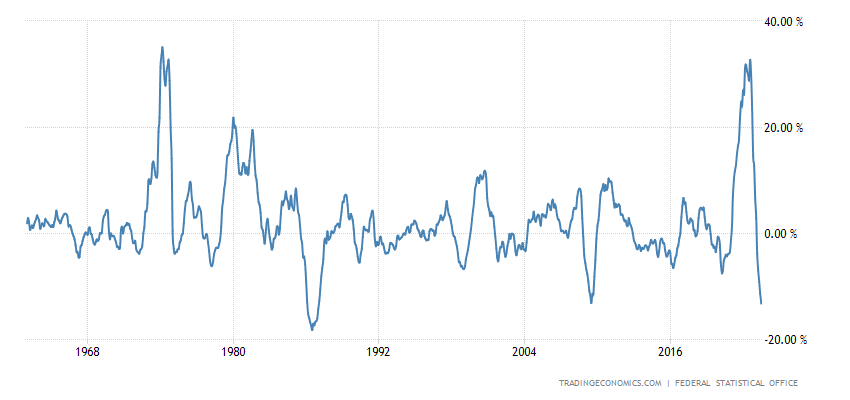
Big news. Nothing extraordinary happened in the last week of summer, but the US government securities market gave a very interesting signal:
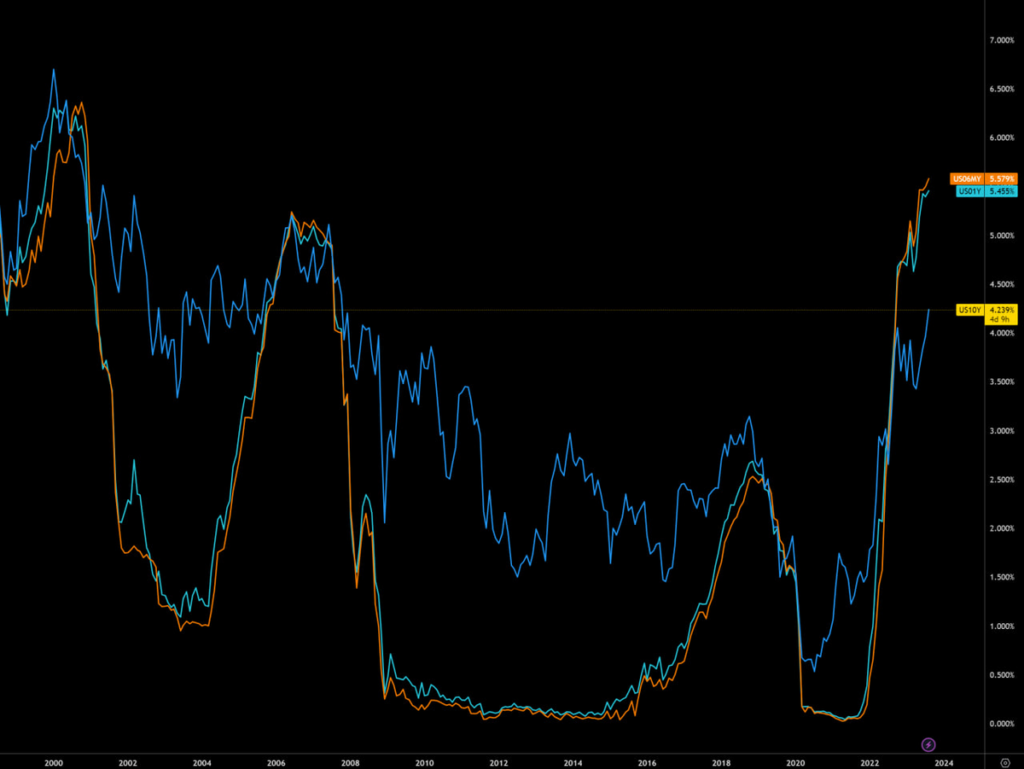
As you can see, the yield has grown to the crisis levels of 2007-08. But at the same time, at that time, the yield of the longest, ten-year securities was approximately at the same level as that of shorter ones (which already contradicts economic logic), but now it is significantly lower. That in itself is a very clear sign of a crisis.
In other words, another, additional factor has appeared, which shows that the US economy is in an extremely unstable position. Of course, these signals do not say when something will happen that will change the situation, but the fact that something should happen is obvious.
Macroeconomics. Swedish GDP -0.8% per quarter:
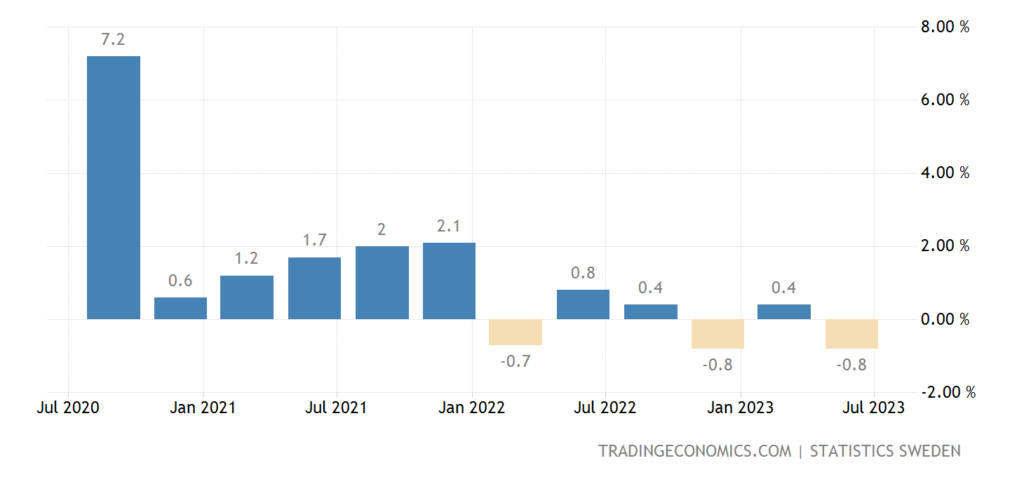
Pic. 2
And -1.0% per year:
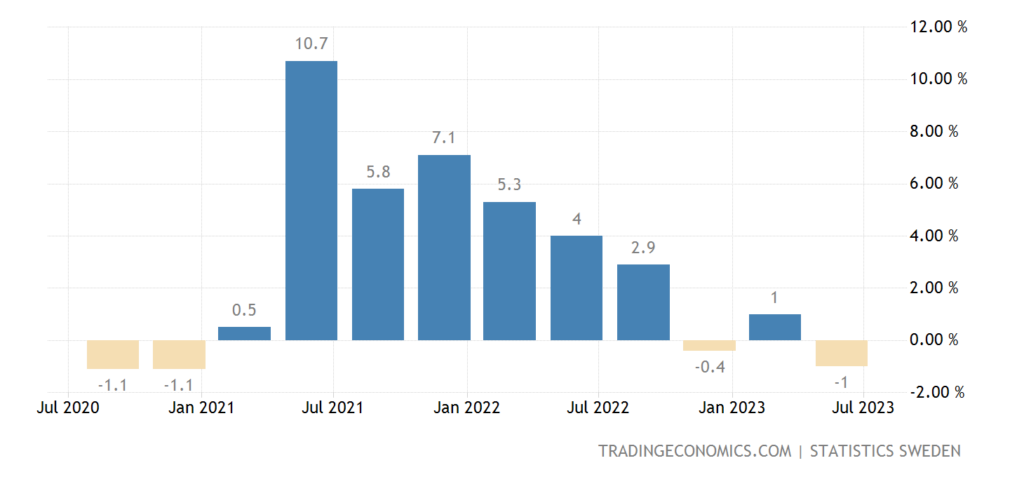
Pic. 3
Italian GDP -0.4% per quarter:
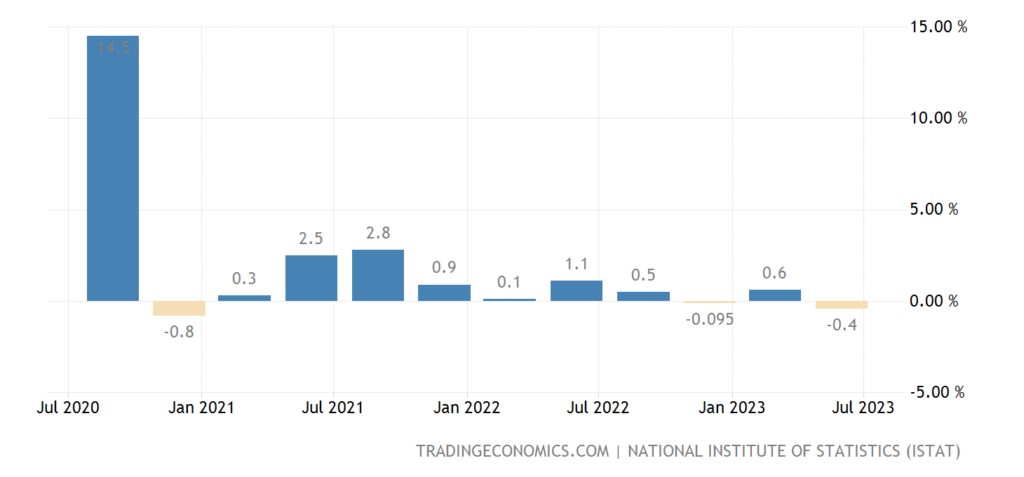
Pic. 4
In Japan -2.5% per year – over the past 9 months there was only 1 plus:
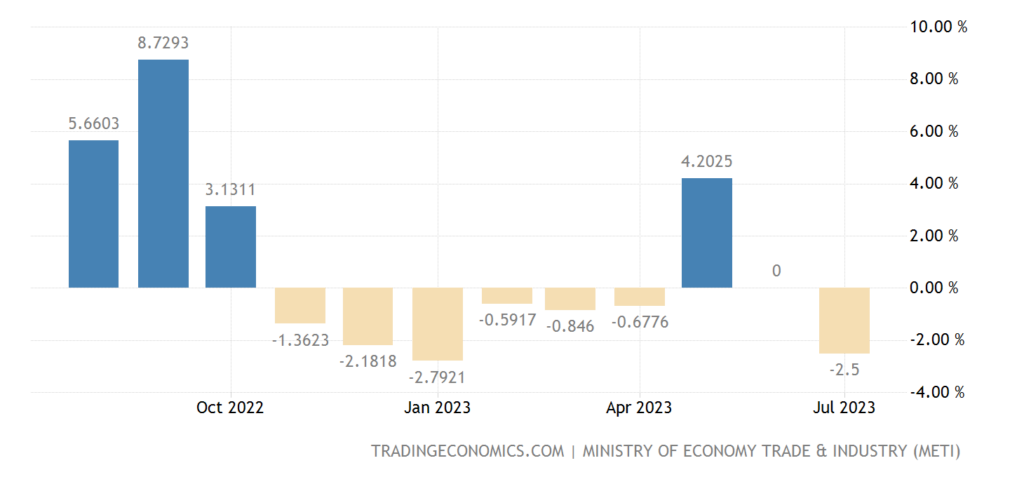
Pic. 5
Note that with such an industrial downturn, GDP growth can only be due to various kinds of accounting fraud with financial assets.
The official PMI (expert index of the state of the industry; its value below 50 means stagnation and decline) of China’s industry (49.7) has been in the red for 5 consecutive months:
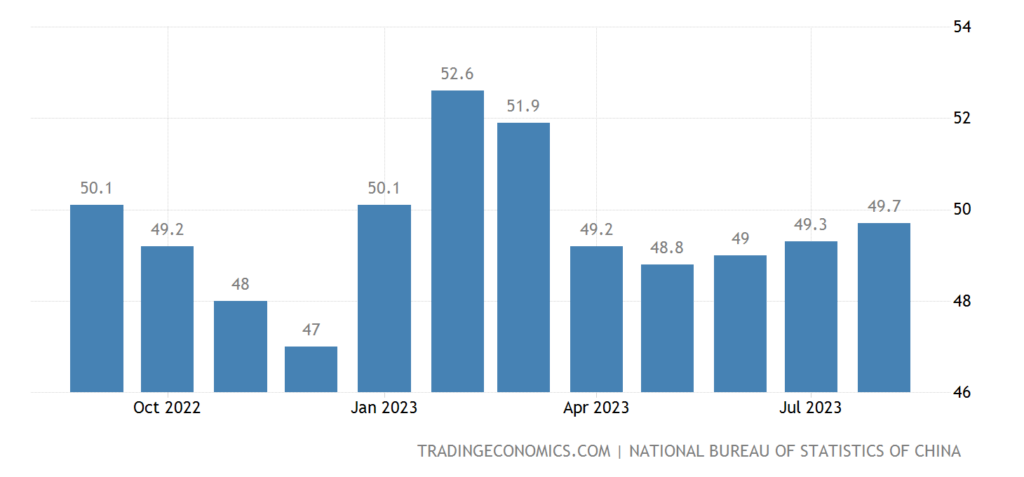
Pic. 6
In other sectors of the economy, growth is still (51.0), but the weakest in 8 months:
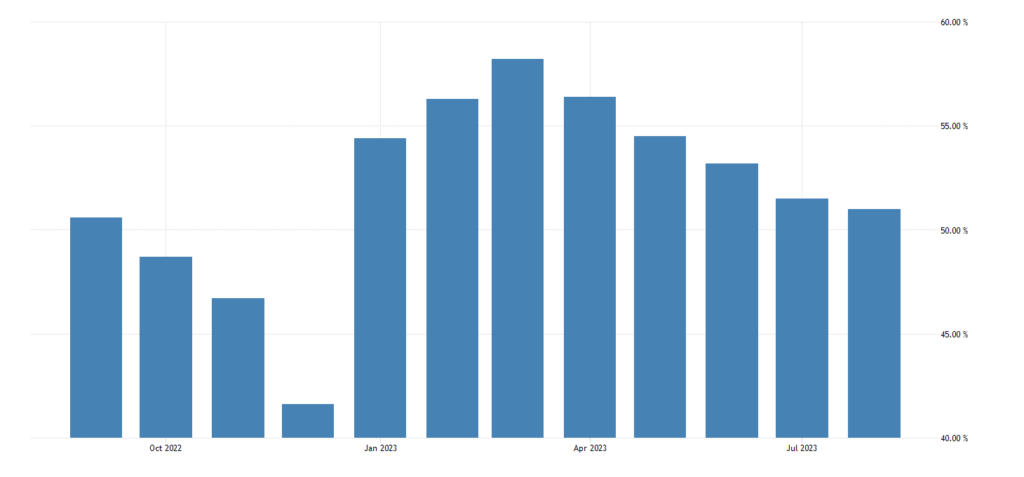
Pic. 7
However, private studies are more optimistic – in industry 51.0:
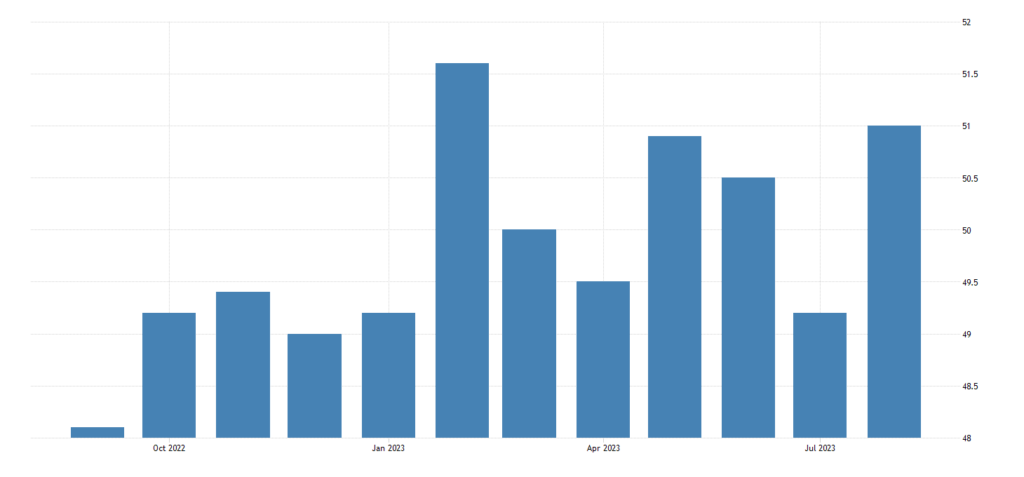
Pic. 8
We will only note that, given the habit of modern statistics to seriously underestimate inflation, most likely, the recession is already everywhere.
UK Industrial PMI 43.0 – minimum since May 2020, and before that – since 2009:
Pic. 9
In Canada, 48.0 is also the bottom since the spring of 2020, previously such numbers were (for a short time) in 2015:
Pic. 10
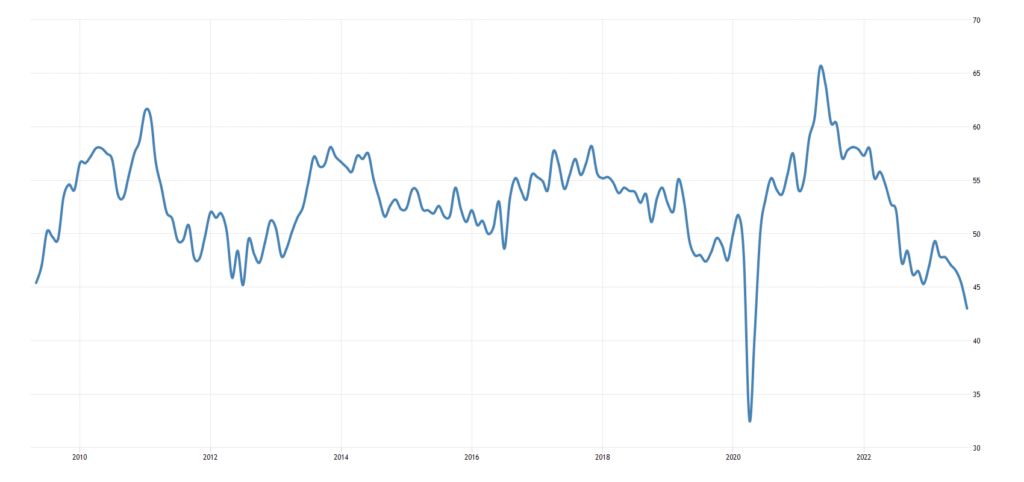
The Texas Federal Reserve Area Industrial Activity Index has been in the red for 16 consecutive months:
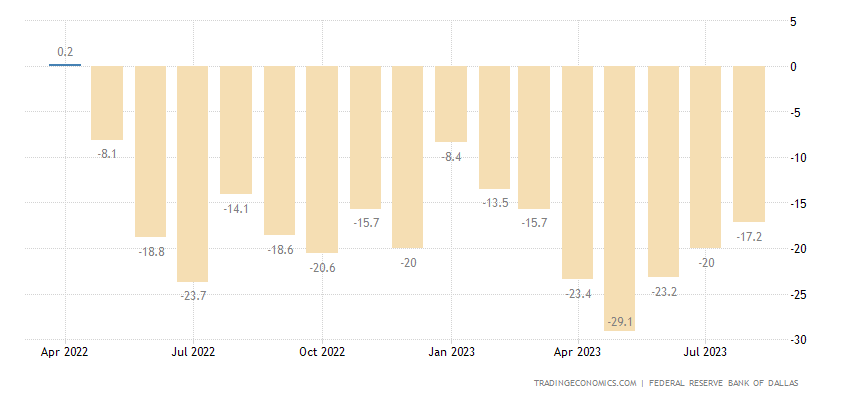
Pic. 11
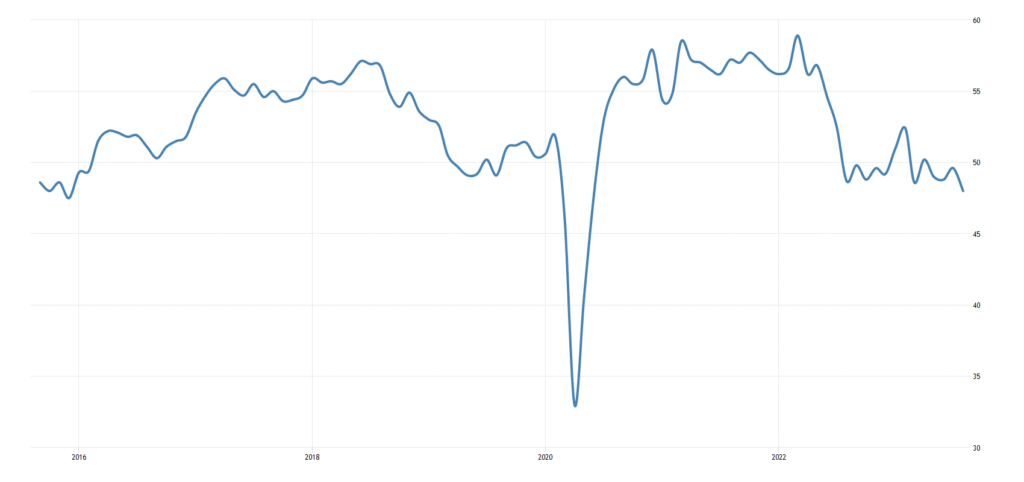
The same region’s service sector index is minus 15 months in a row:
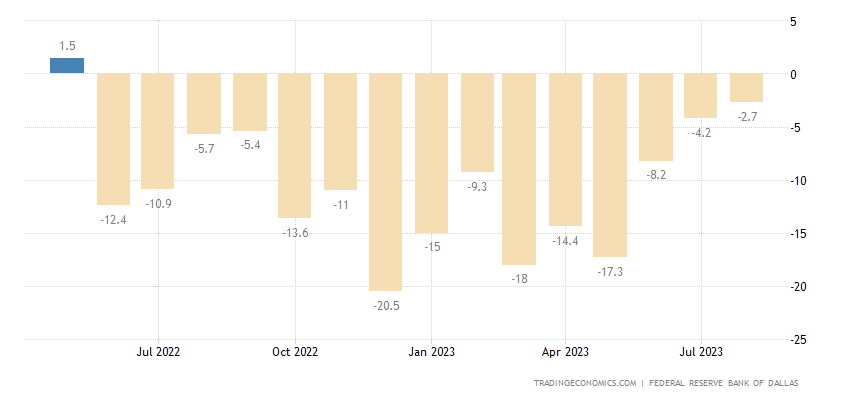
Pic. 12
Business confidence in the Netherlands has been at the bottom since the end of 2020, and before that these numbers were 10 years ago:
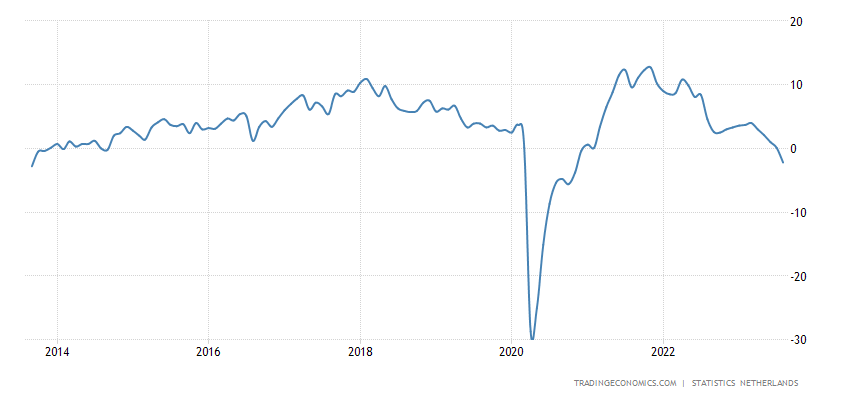
Pic. 13
The same picture in Sweden:
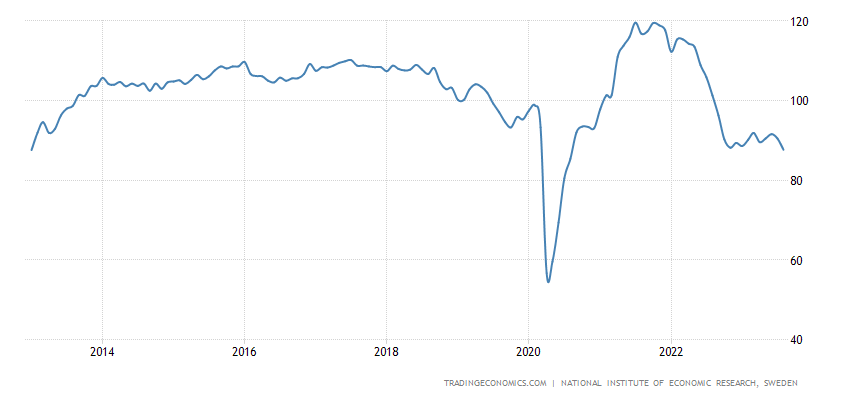
Pic. 14
And in Italy:
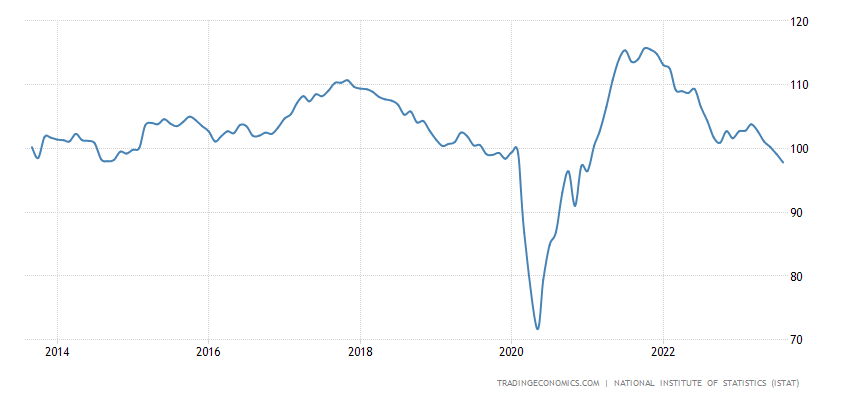
Pic. 15
A similar situation in the industry of the eurozone:
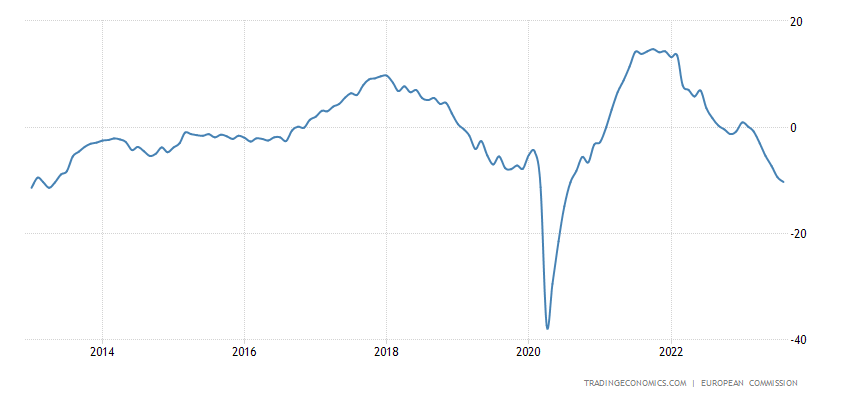
Pic. 16
And in general, in its economy:
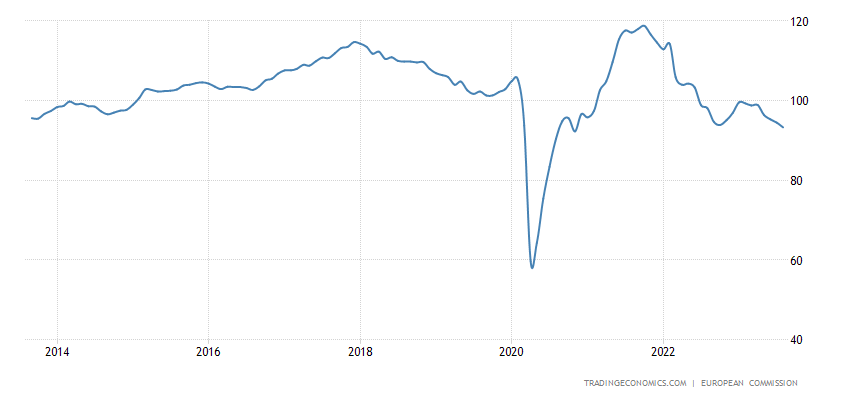
Pic. 17
Accordingly, some other indicators show the crisis:
Eurozone household loans +1.3% per year – 8-year minimum:
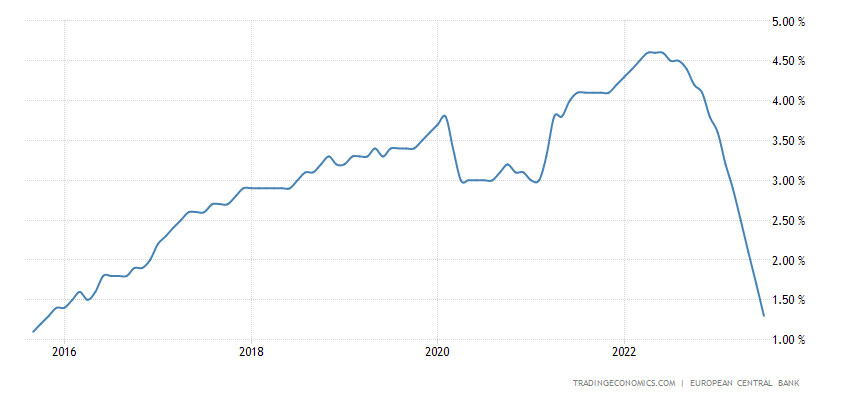
Pic. 18
There is no more money to pay back loans.
Monetary supply M1 (without going into subtleties – cash) -9.2% per year:
Pic. 19
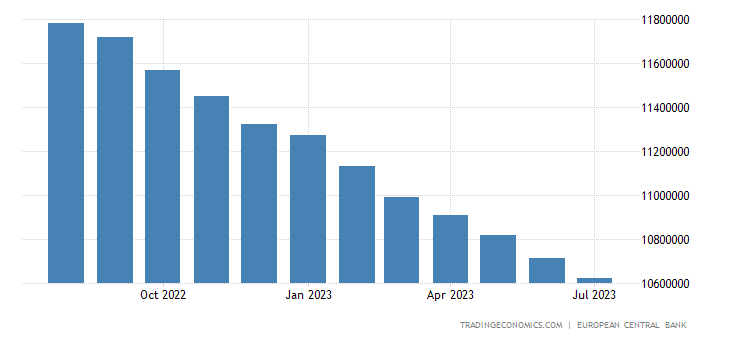
Aggregate M3 (extended money supply serving the money circulation) -0.4% per year – this has never happened in 42.5 years of observations:
Pic. 20
A little clarification: the expanded money supply must correspond to the structure of the economy and, given its more or less fixed structure, change along with it (if it is artificially overestimated or underestimated, either inflation or deflation begins). Since there are no fundamental changes in prices, they were growing a year ago, now the situation is more or less balanced (see below), in the consumer sector there is an increase in prices, in the industrial sector there is a decline, then such a picture with the money supply suggests that the EU economy is in the worst crisis in half a century…
Australian building permits -8.1% m/m after -7.9% m/m:
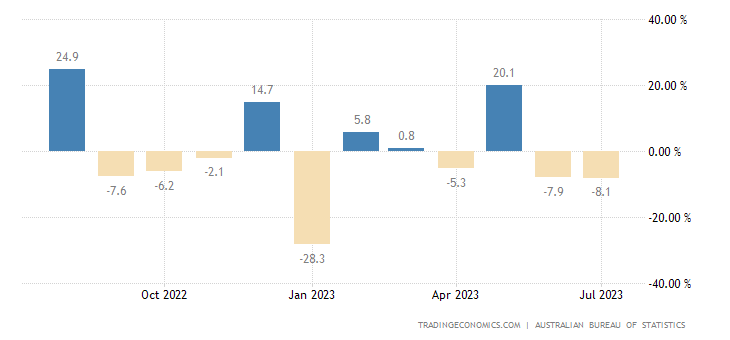
Pic. 21
And -10.6% per year – the 22nd monthly negative in a row:
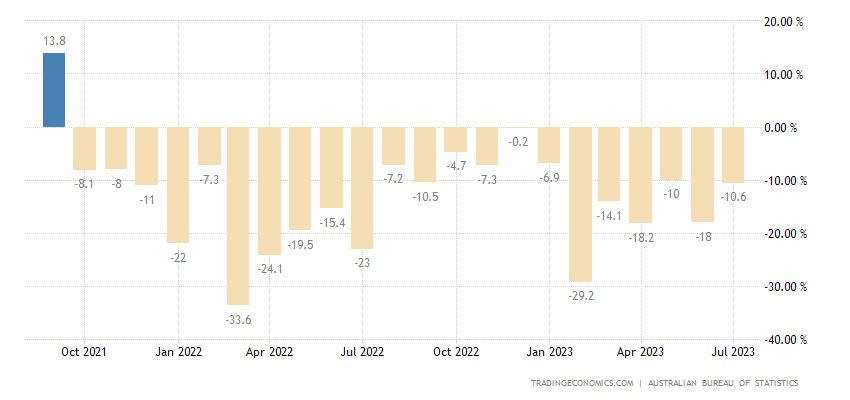
Pic. 22
The indicator is at the levels of 2009-12, half of the peak values:
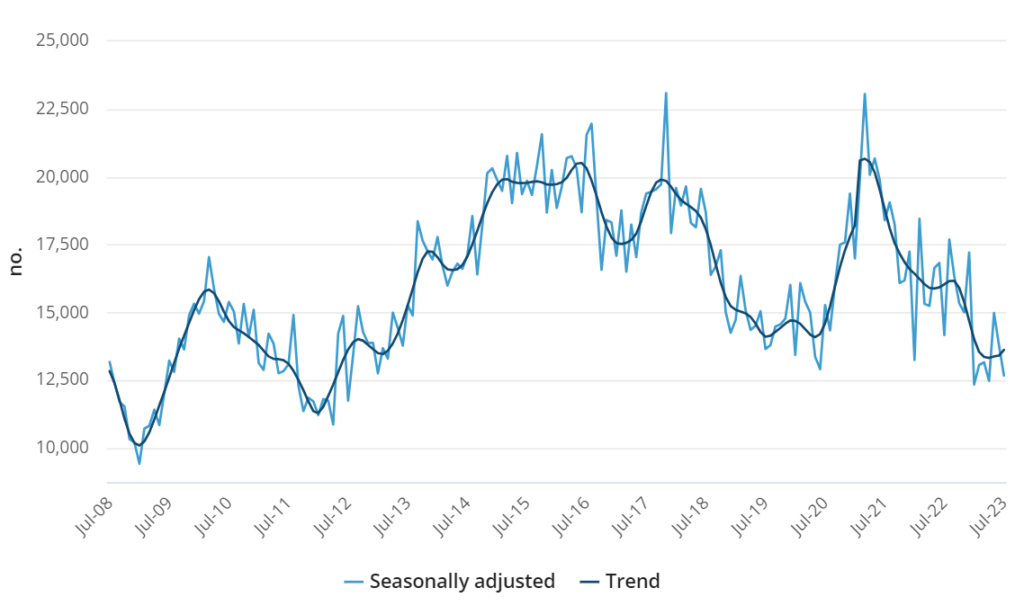
Pic. 23
New buildings in Japan -6.7% per year – the 5th minus in the last 6 months:
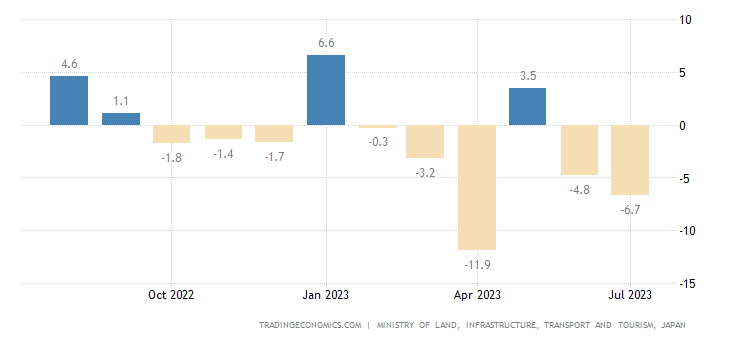
Pic. 24
House prices in Britain -5.3% per year – 14-year low:
Pic. 25
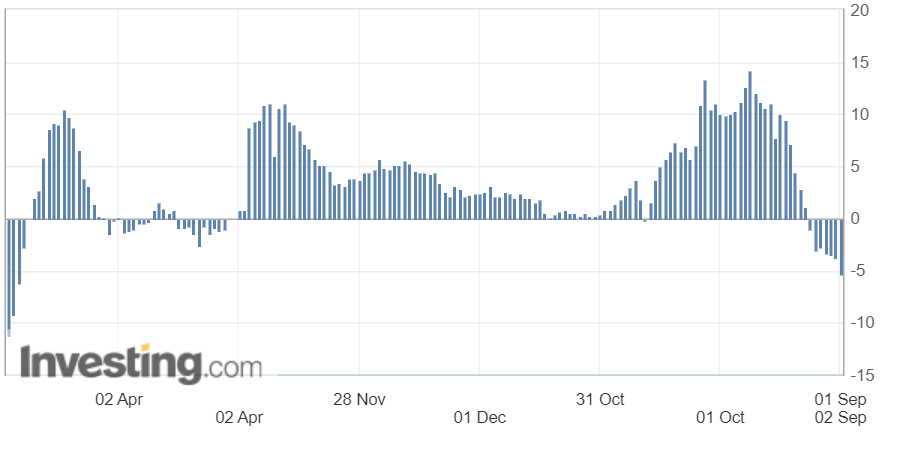
U.S. pending existing home sales -14.0% per annum – 26th consecutive negative:
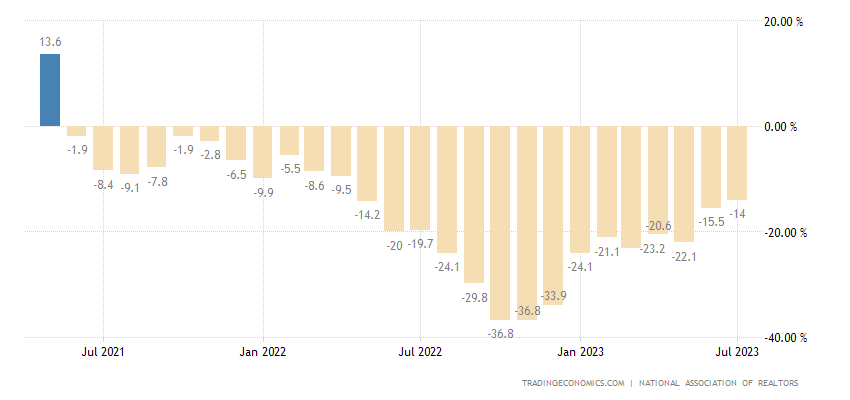
Pic. 26
No wonder, as US housing prices are rising again, and according to private researchers:
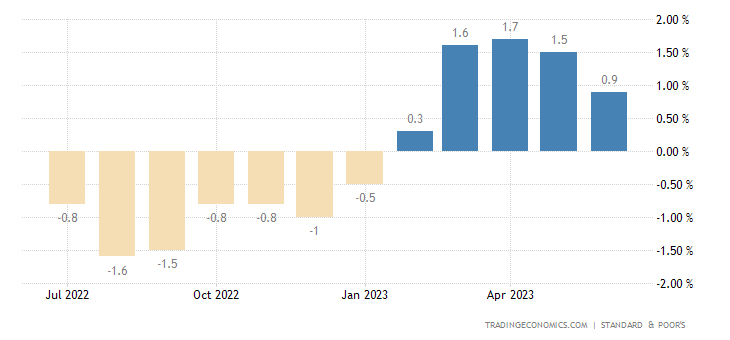
Pic. 27
and according to the authorities:
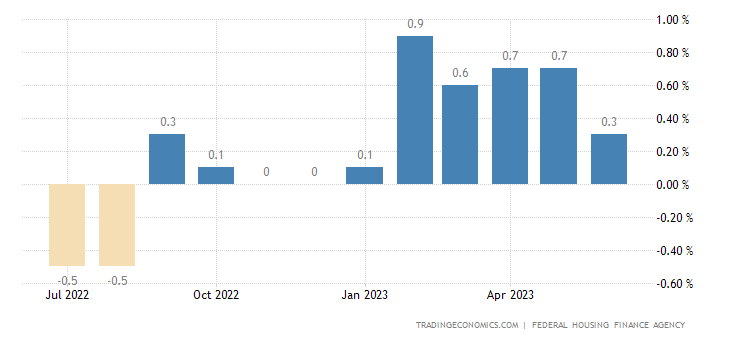
Pic. 28
The US 30-year mortgage rate remains at a 23-year high (7.31%):
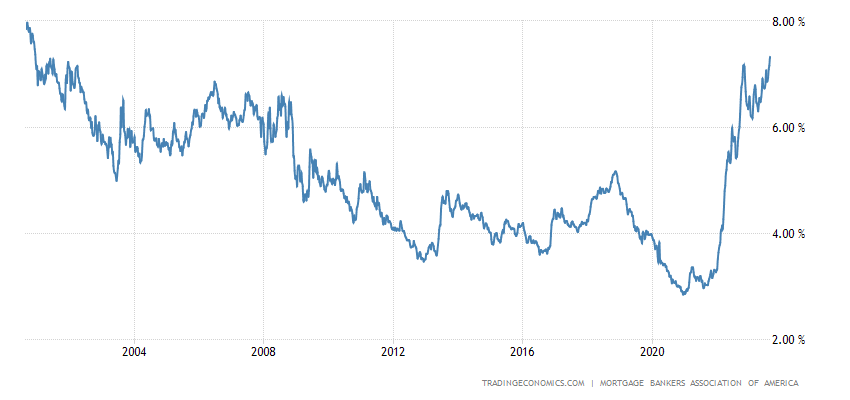
Pic. 29
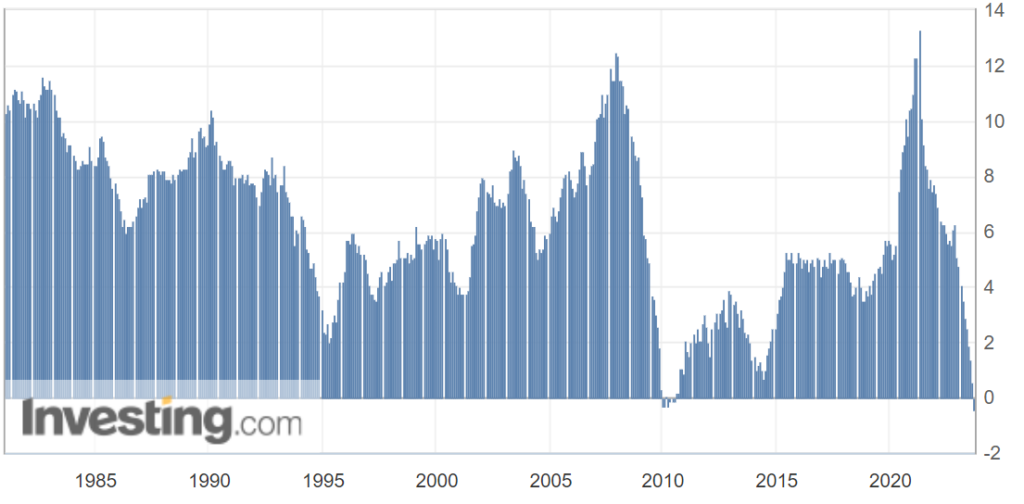
French CPI (Consumer Price Index) +1.0% per month – over 33 years of data collection, it was higher only once, in March 2022:
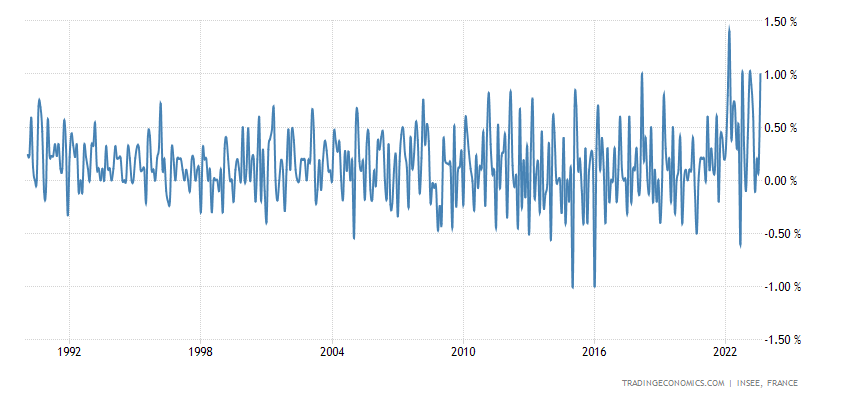
Pic. 30
Apparently, consumer prices went up again. Given the decline in the money supply, this most likely means that the costs of producers are growing significantly, on a scale of 10-15% per year. Against the backdrop of falling demand, this is natural, but there is deflation in industry. That is, the profitability of the business falls significantly (and how else to compensate for the increase in costs). The next stage is an increase in the number of bankruptcies and a further fall in aggregate demand.
PPI (industrial price index) of Brazil -14.1% per year – an anti-record for 72 years of statistics:
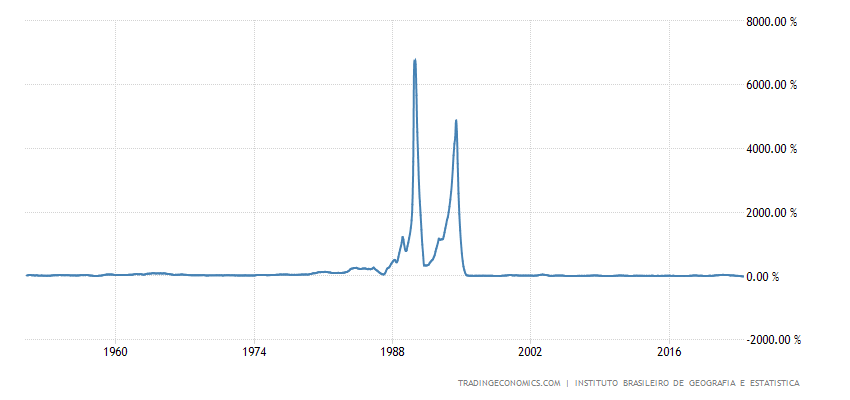
Pic. 31
PPI Italy -10.2% per year – also a record weak value:
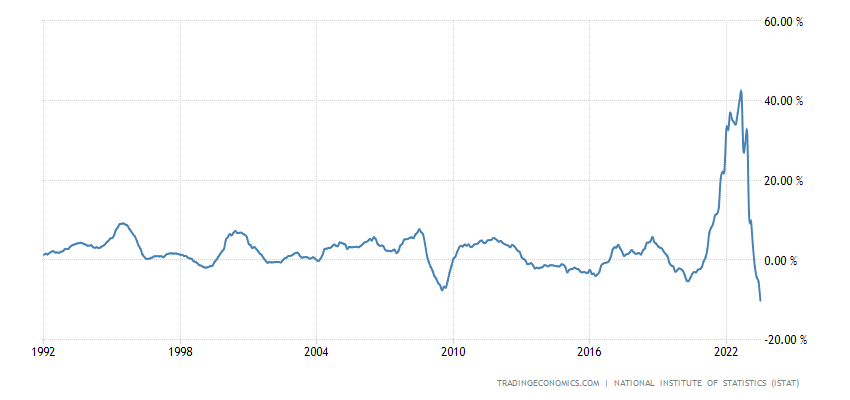
Pic. 32
Apparently, these countries are ahead of the rest of the world, in the US PPI is even higher than 0, although prices for the entire set of industrial goods have been actively falling for many months, we noted this in one of our previous reviews.
Import prices in Germany -13.2% per year – over 60 years of observations, it was lower only in 1987:
Pic. 33
The number of open vacancies in the US is the lowest in almost 2.5 years:
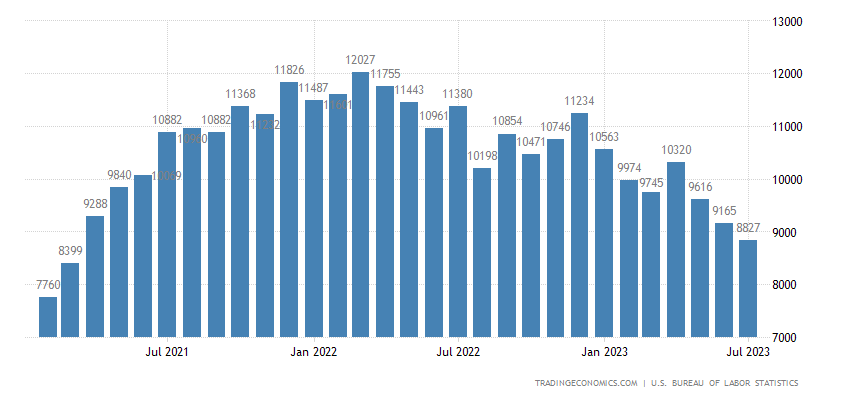
Pic. 34
And the unemployment rate is the highest in 1.5 years:
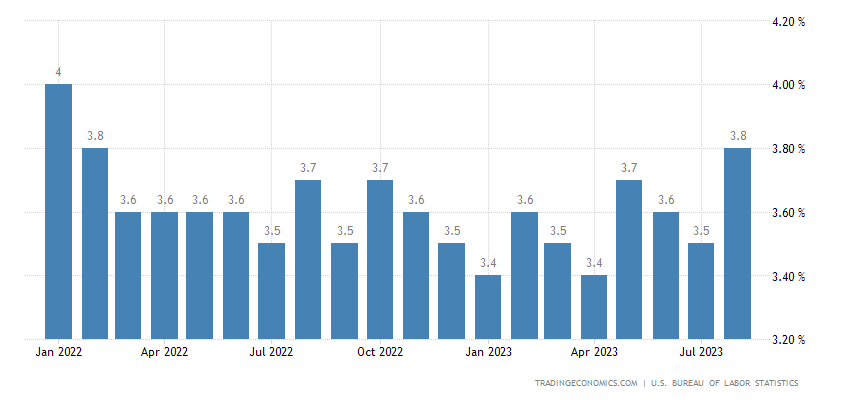
Pic. 35
As usual, these statistics are extremely doubtful: labor statistics are painfully distorted (due to their politicization). But a much less distorted graph of the average working week shows that it is gradually decreasing:
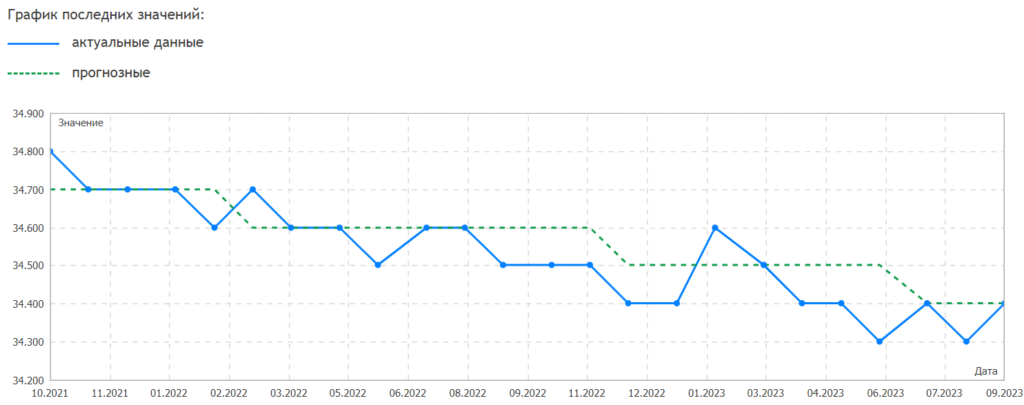
Pic. 36
The number of unemployed in Germany has been growing for 7 months in a row:
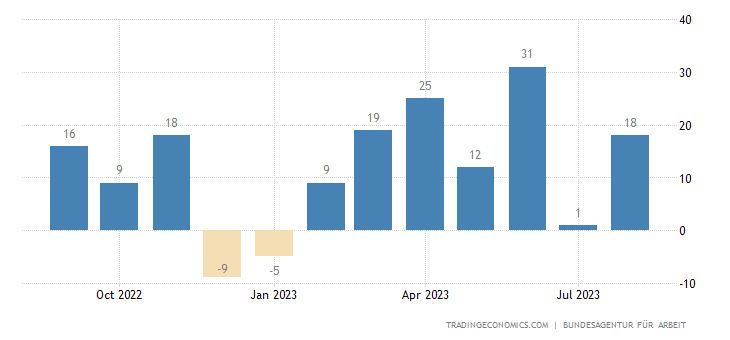
Pic. 37
And already for the maximum of 26 months, and excluding the covid surge – from the end of 2016:
Pic. 38
And, finally, one of the most informative indicators of the general economic state of affairs for some EU countries:
Retail sales in Sweden -2.1% per year – the 15th negative in a row:
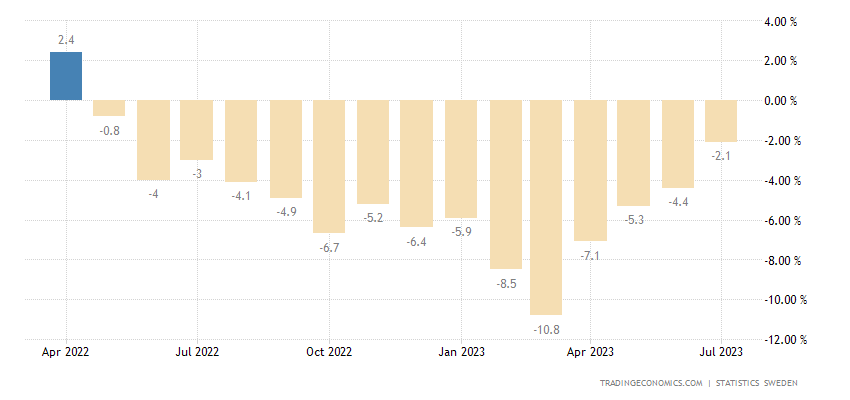
Pic. 39
German retail -2.2% per year – also the 15th negative in a row:
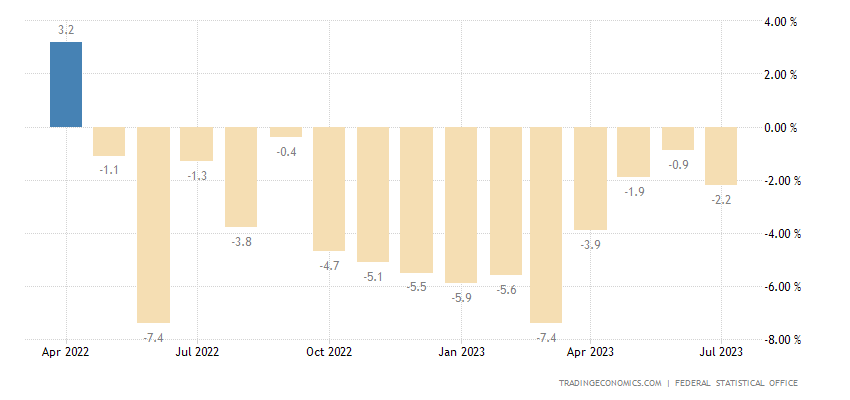
Pic. 40
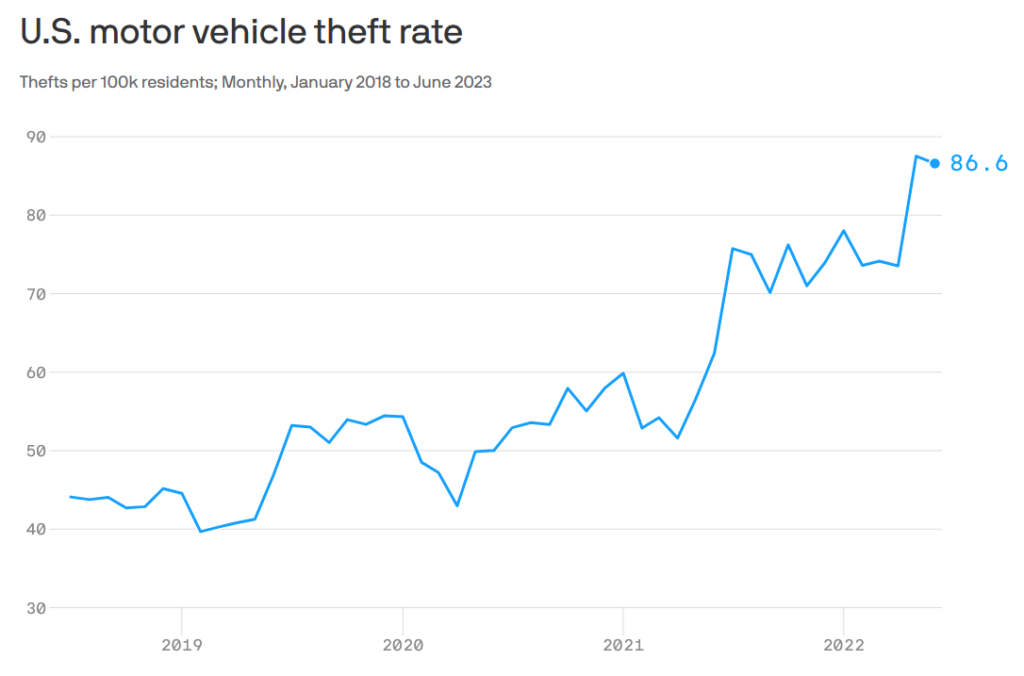
Main conclusions. The structural crisis continues, but it seems that its scale is growing. This should not be in accordance with the theory, but only in a situation where the state does not interfere in the economy. And it actively intervenes, and on a fairly large scale. As a result, structural changes begin. Car theft is on the rise in the US
And the ratio of prices for rent and purchase of housing is changing:
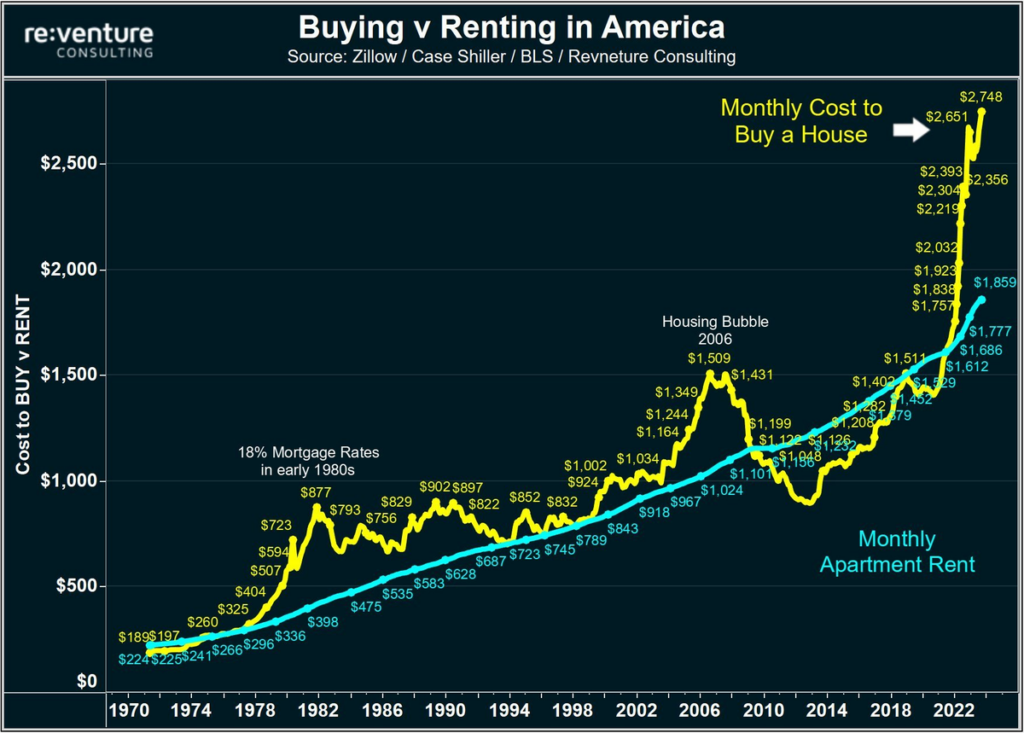
The relationship between the two is very stable (if the price of a house goes up, households stop buying and start renting), so such a strong distortion indicates a serious problem in the economy.
Well, another graph showing sharp structural changes in the US economy:
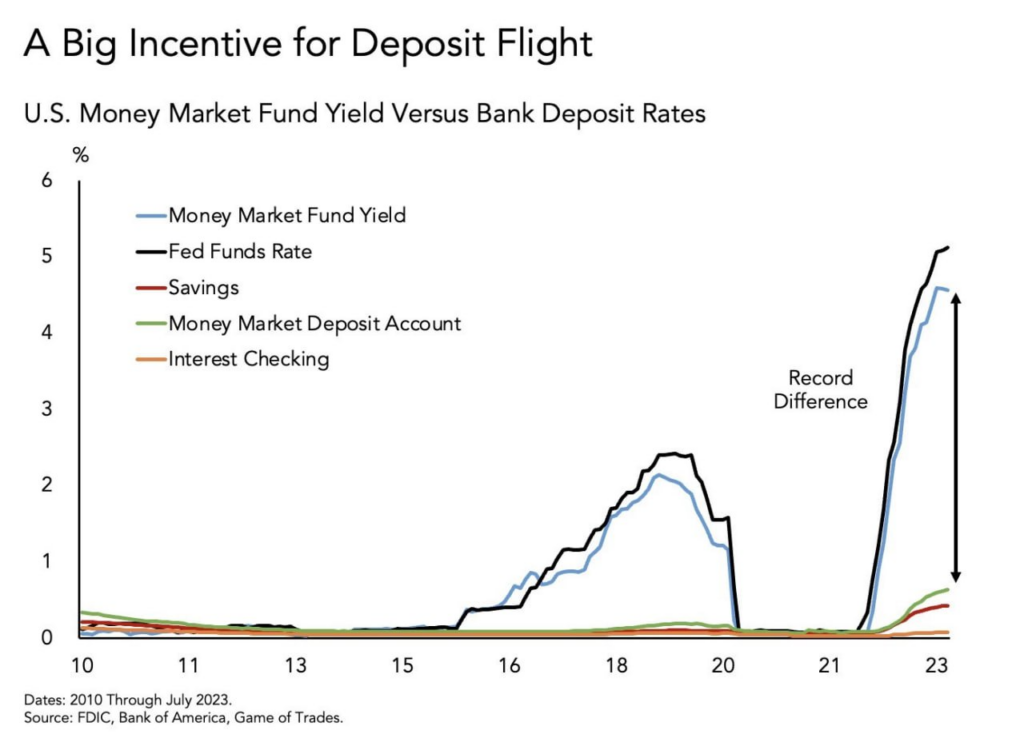
We will not even comment on the possible reasons for such changes, just their presence is enough.
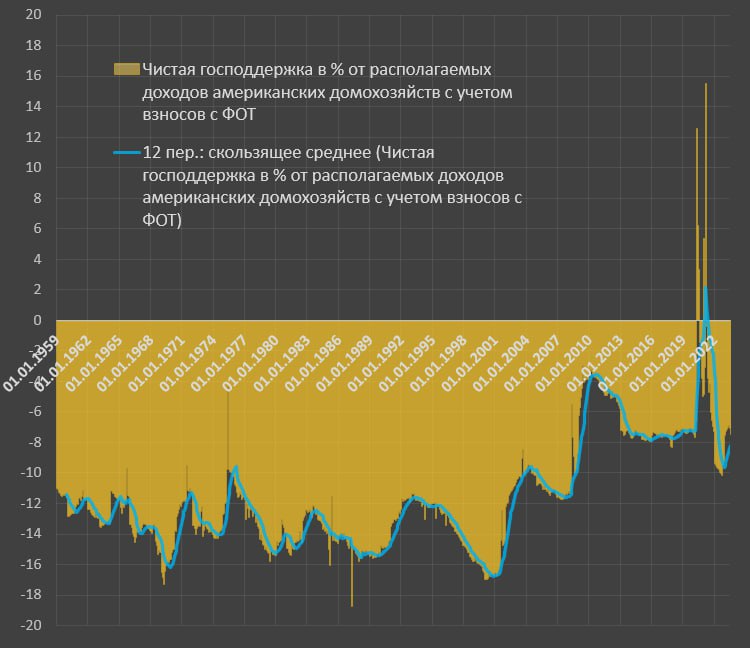
Well, in conclusion, we state that, as we showed in recent reviews, the surplus of household income created during the covid period (at the expense of the budget) is practically consumed. And this means that if you do not start a new campaign to issue budget money to households, then a serious drop in aggregate demand will begin. And this is extremely dangerous in an election year.
As an illustration, here are two graphs published by Pavel Ryabov (Spydell) in his telegram channel:
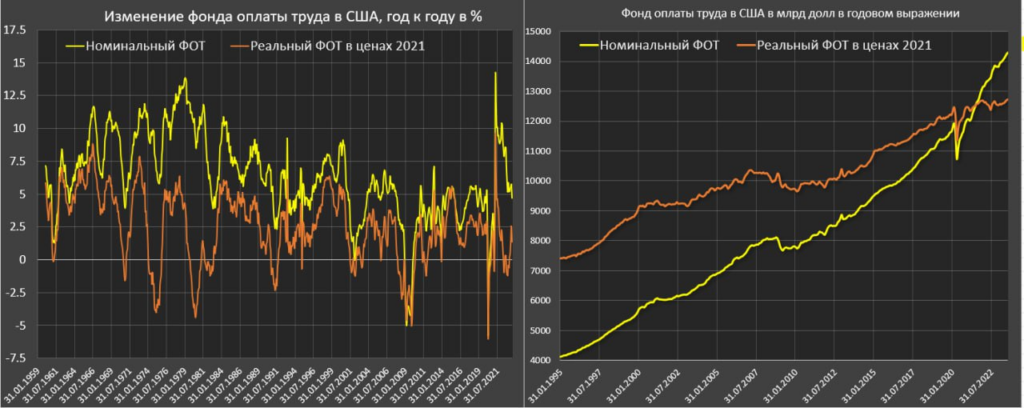
In general, there is a feeling that the summer is over (calendarly, for sure) and you need to prepare for harsh everyday life. So we wish our readers to have a good rest on the weekend, apparently, difficult working weeks are starting!