
May, 13-19
Big news. Negotiations on the limit of public debt in the United States. It’s clear why, the US Treasury’s Fed account fell to $68 billion on May 17, 2023 (below the minimum allowable threshold for setting activity) – a high cache stock since December 16, 2021 ($42 billion).
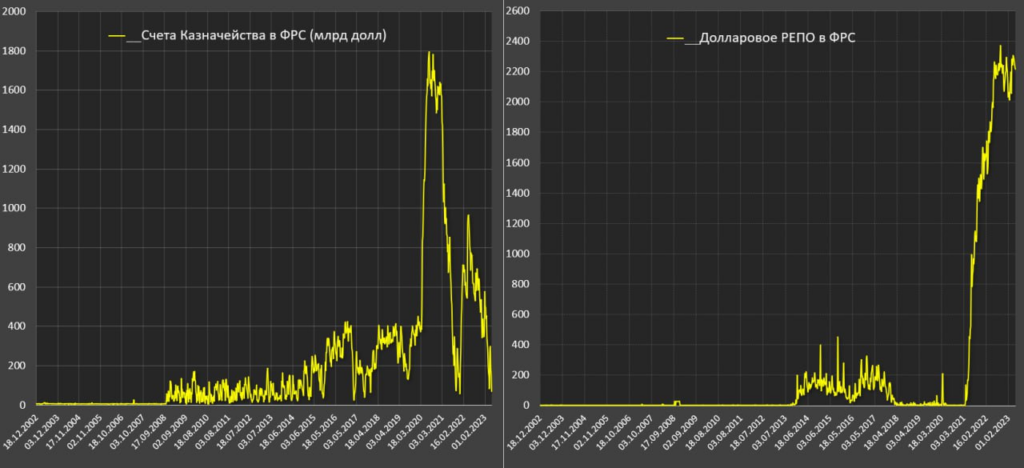
Next, we appeal to the data of Pavel Ryabov (Spydell): then, in December 2021, the collapse of the cache to this threshold led to an increase in the debt limit by $ 2.5 trillion and activation of the money pump – for two months to February 16, 2022, the US Treasury, in addition to financing the budget deficit replenished cash reserves by $ 650 billion.
The volume of borrowings for 2 months then amounted to $ 1.2 trillion, which then led to the first phase of the market decline by 8% even before the actualization of inflationary problems (recall, inflation began to rise in the fall of 2021, but then the Fed’s management ignored this problem) and expectations of monetary tightening – credit policy of the FRS. The lag between the beginning of borrowings and the market decline was 2 weeks (from the beginning of January 2022 they began to fall).
The expected amount of net borrowing from June to December 2023 is at least $1.5 trillion, but it is possible that this amount will reach up to $2.2 trillion.
In addition to large borrowings, there are sales from the Fed. From mid-March 2023 to May 17, the Fed sells 95 billion in accordance with the announced plan, the backlog has stabilized. This is due to a significant increase in demand for bonds on the part of money market funds and the public after the maximum outflow of liquidity from deposits in US banks in history.
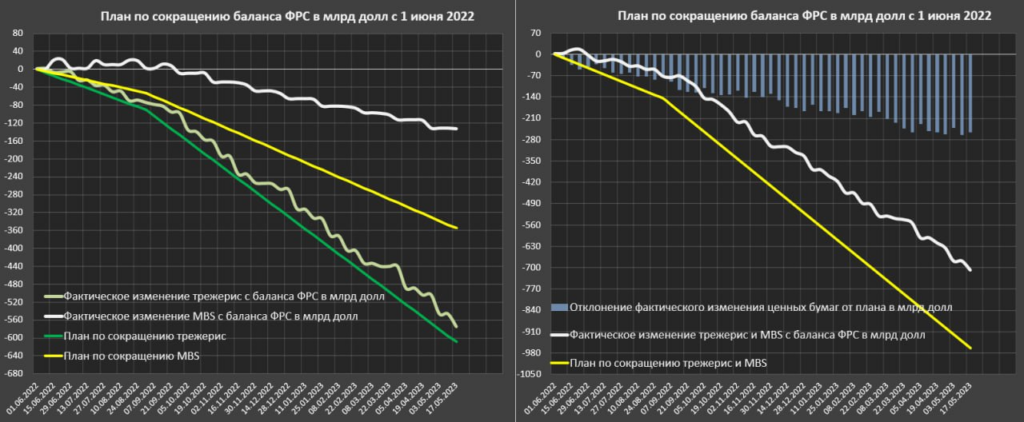
They withdraw from deposits, buy stocks and bonds, and market conditions allow the Fed to dump papers and successfully cover positions, which is why over the past two months they have been selling plus or minus at a rate of 95 billion per month.
As you can see on the chart, there is a relationship between the S&P 500 and the amount of liquidity in the US financial system. What is the reason for the increase in liquidity against the backdrop of the sale of securities from the Fed? Lending operations by the Fed after the banking panic in March + operations by the Treasury to sell cash from the Fed’s accounts (this leads to an increase in liquidity).

If the national debt limit is raised, this will lead to a sharp reduction in liquidity in the US monetary system, which can cause numerous negative consequences. Including an increase in the cost of real credit in banks, which will accelerate the pace of the economic downturn and lower the standard of living of the population. The leadership of the Treasury will no longer be responsible for this, but the leadership of the Treasury, but this will inevitably entail serious political consequences.
As of today (Friday evening, May 19), negotiations between the Biden administration and the leadership of the House of Representatives have not ended in anything. Speakers of the Republican Party left the meeting with representatives of the White House. One of the negotiators from the House of Representatives, Garrett Graves, said the following: “We have not yet reached an agreement and are at an impasse! We decided to take a break because it’s just not productive! Further negotiations are simply unreasonable. It is not known if we will meet again today or at the weekend.”
Based on the experience of previous decades, the public debt limit will be raised and there should be no problems. But there are serious reasons to believe that in this case this problem will be used to solve much more complex problems, and for this reason, a simple and quick result will not work. In any case, the Speaker of the House of Representatives McCarthy said that the problem will be solved, and that there will be problems with this without reducing the budget expenditures. So understand it as you know!
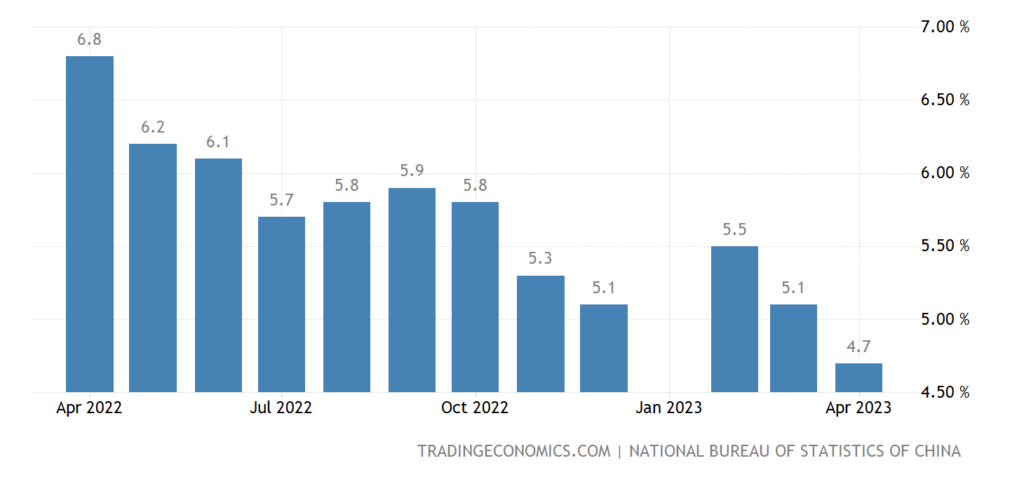
Macroeconomics. As we promised, we are dealing with the Chinese economy. The data for April was disappointing: investment in fixed assets slowed down, while acceleration was expected:
Pic. 4
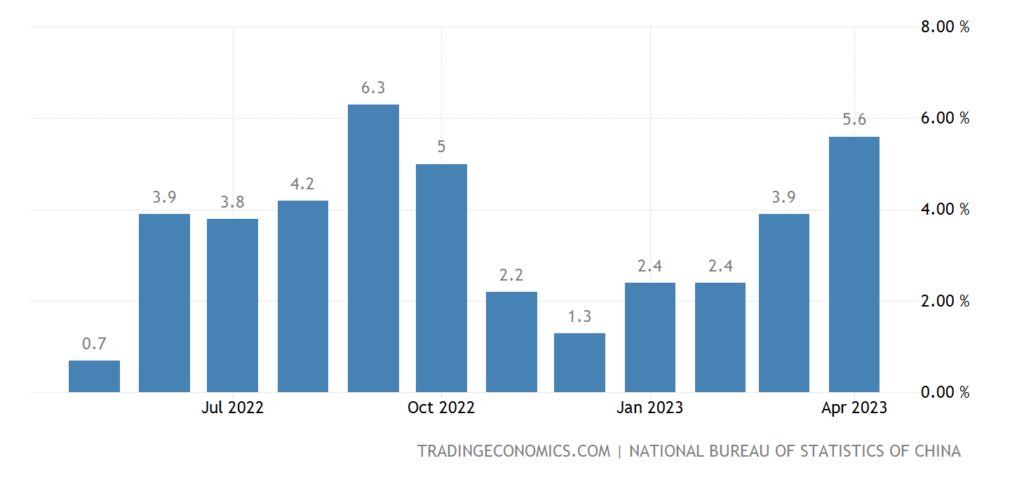
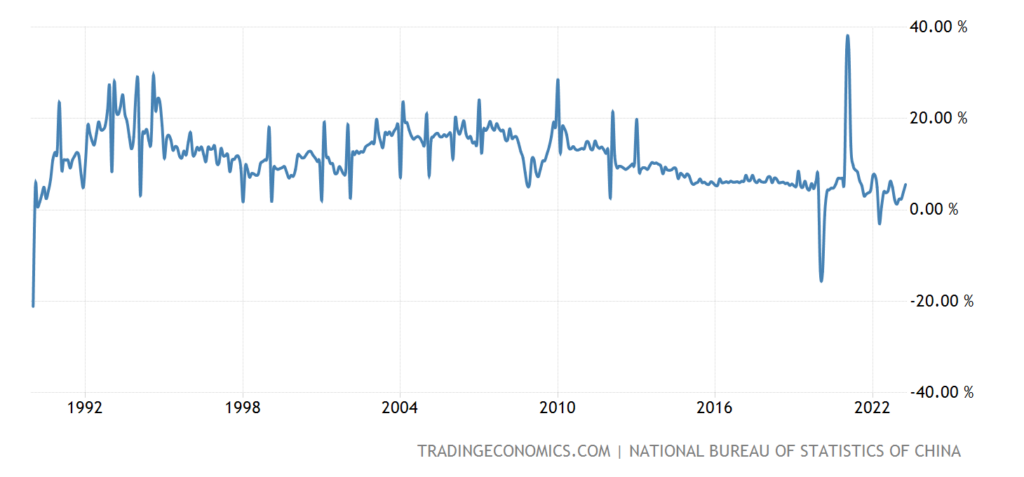
Industrial production +5.6% per year – twice as weak as expected:
Pic. 5
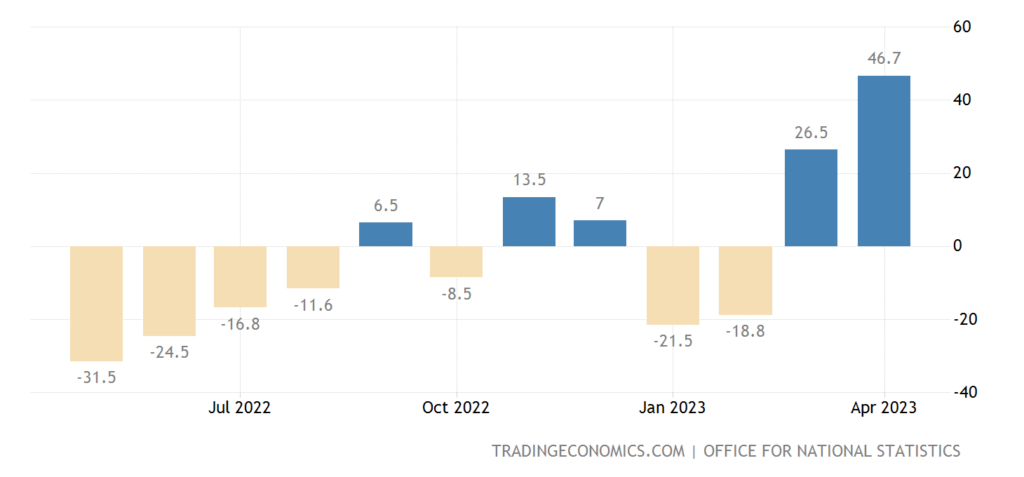
Retail sales +18.4% per year due to a very low base a year ago – and this is below forecasts:
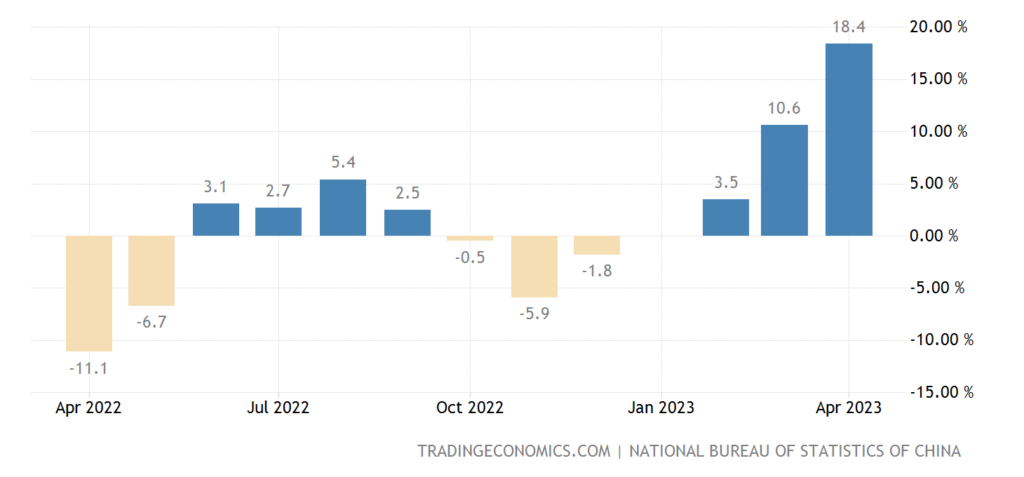
Pic. 6
Note that this is all against the backdrop of understated (albeit not as much as in the EU and the US) inflation!
Eurozone industrial production -4.1% m/m – 3rd worst in 33 years of observation:
Pic. 7
In Japan -0.6% per year – the 5th negative in a row:
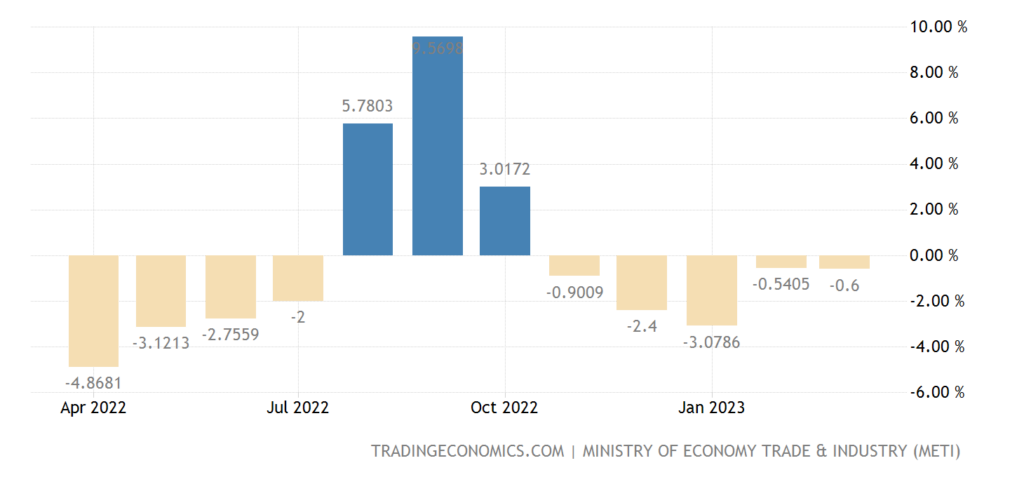
Pic. 8
US manufacturing output -0.9% per year – 4th minus in the last 5 months:
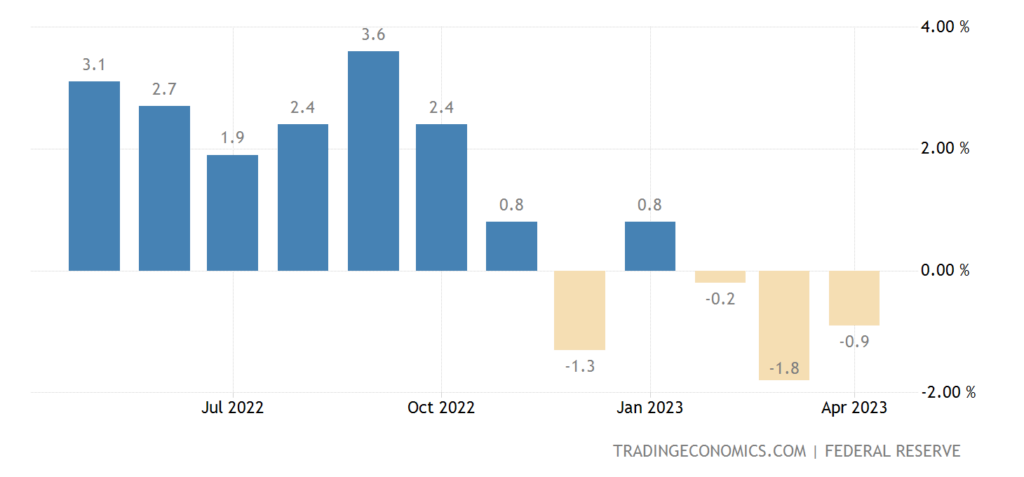
Pic. 9
The New York Fed index for the 3rd time in a year was at levels near the bottom of 2009:
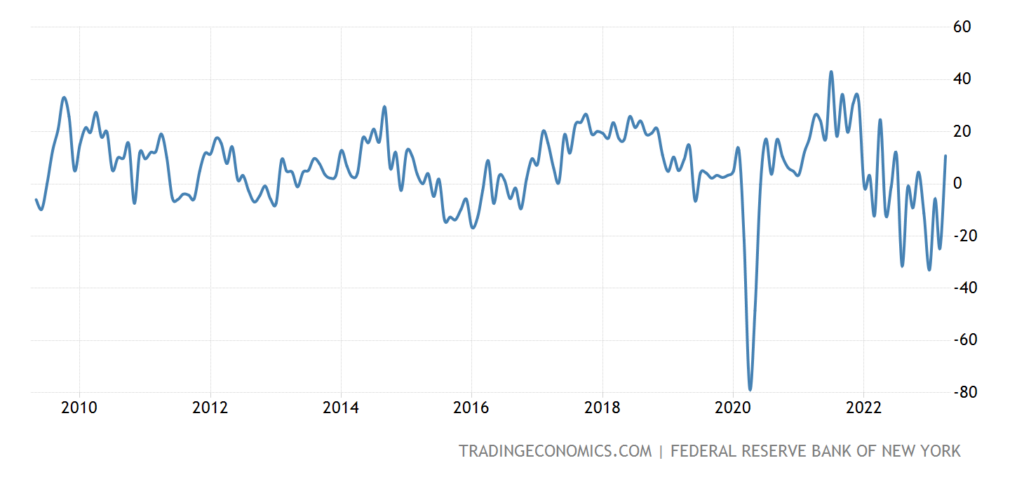
Pic. 10
The Philadelphia Fed index slightly retreated from a 3-year low, but remained in the red for the 9th month in a row:
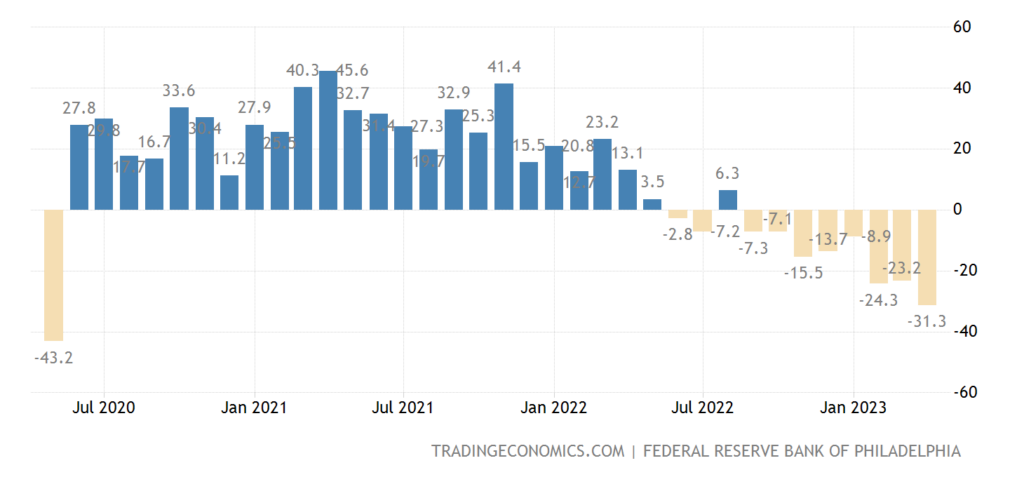
Pic. 11
Leading indicators in the US have been deteriorating for 13 consecutive months:
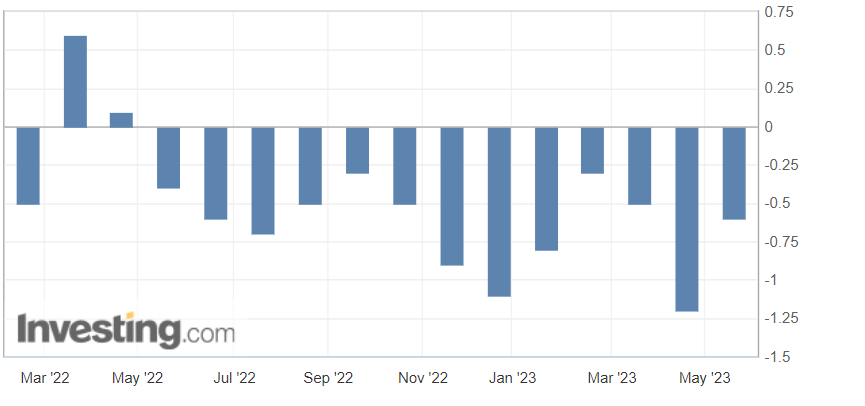
Pic. 12
The LEI_US chart ((Leading Economic Index® United States from the Conference Board) shows the change in these indicators for half a year (“on an annualized basis”, that is, simply doubled), it clearly portends an official recession, as always, when the -4% level is broken.
Another chart (LEI&GDP_US) shows the correlation of annual changes in leading indicators and GDP.
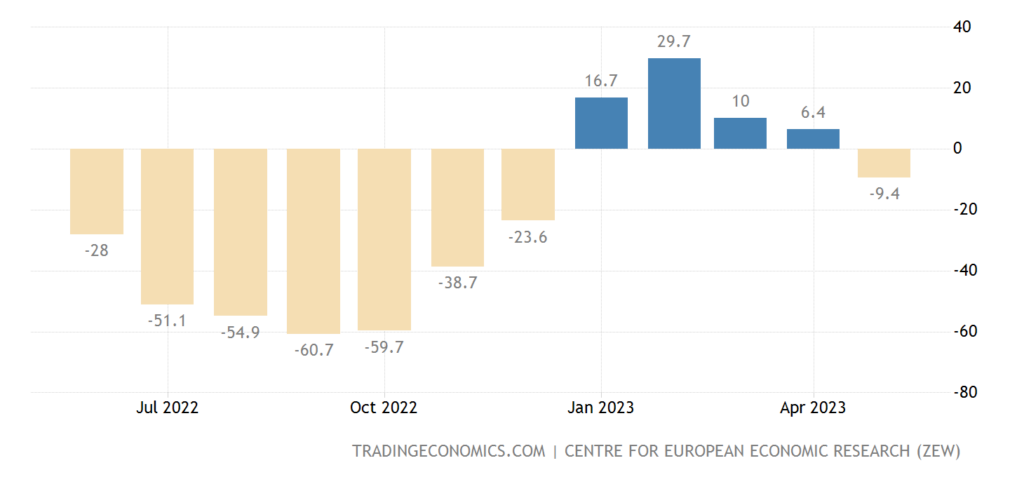
Economic sentiment index in Germany (ZEW review) returned to minus and the worst in 5 months:
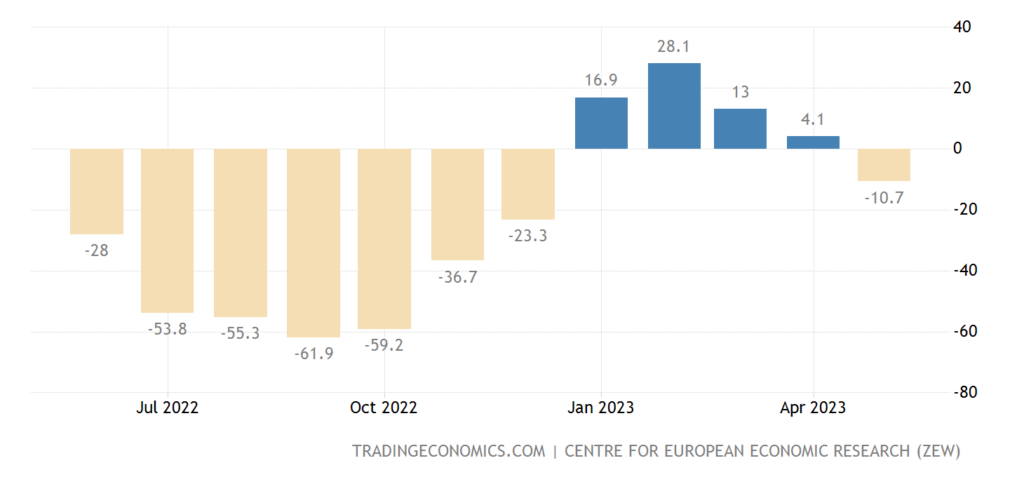
Pic. 13
In general, the same is true in the eurozone:
Pic. 14
Building permits in Australia -17.3% per year – the 18th consecutive minus:
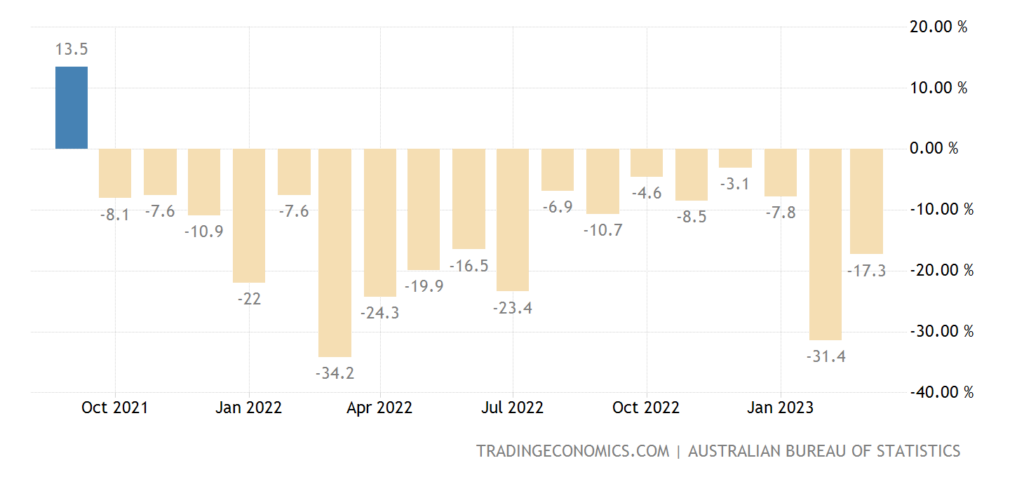
Pic. 15
Up to 11-year low:
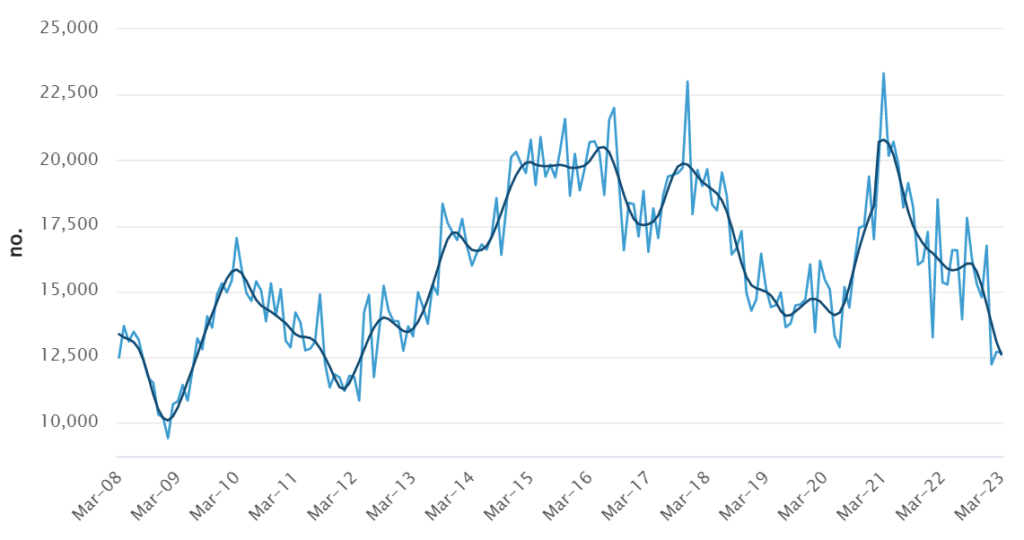
Pic. 16
Food inflation in Japan (+8.4% per year) is the highest in 47 years:

Pic. 17
And the general consumer prices without food and fuel (+4.1% per year) – for 42 years:
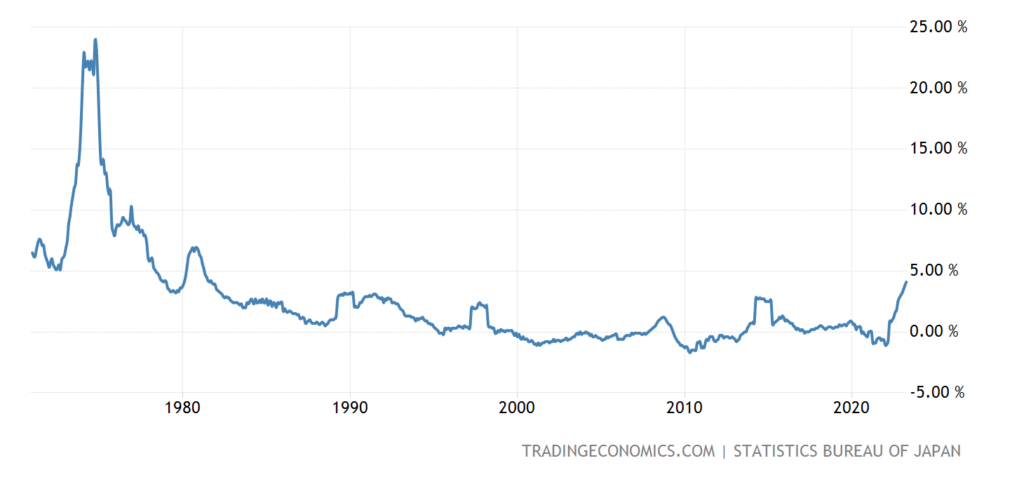
Pic. 18
CPI (consumer price index) of Argentina +8.4% per month – a record for 10 years of keeping statistics according to the current methodology:
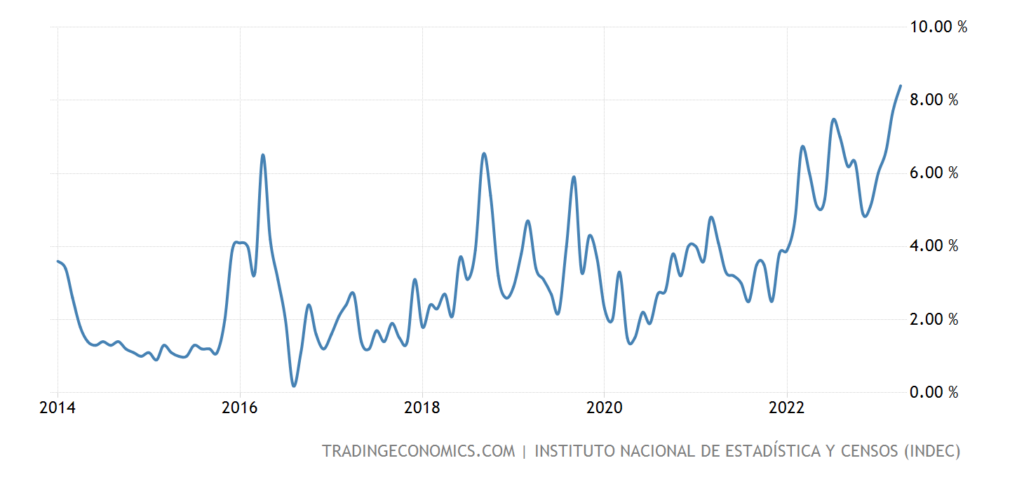
Pic. 19
And 108.8% per year is a 32-year high:
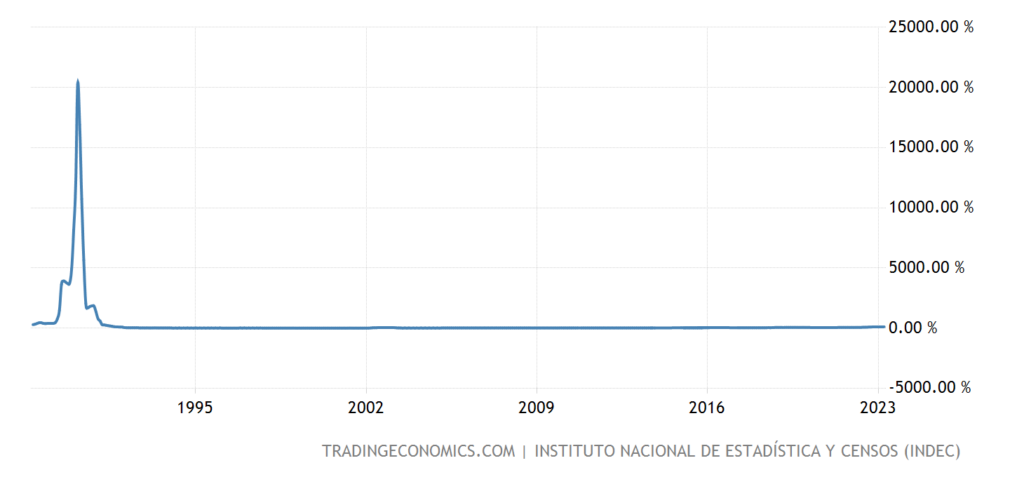
Pic. 20
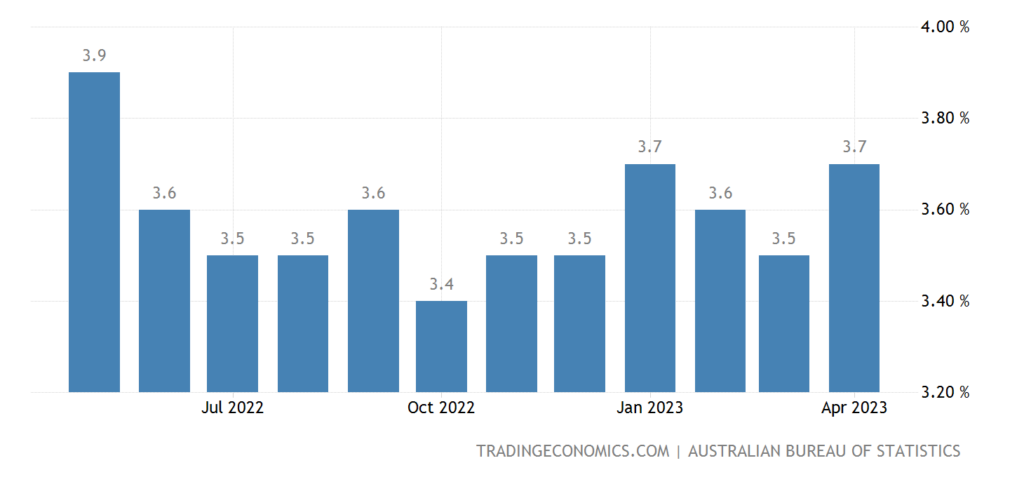
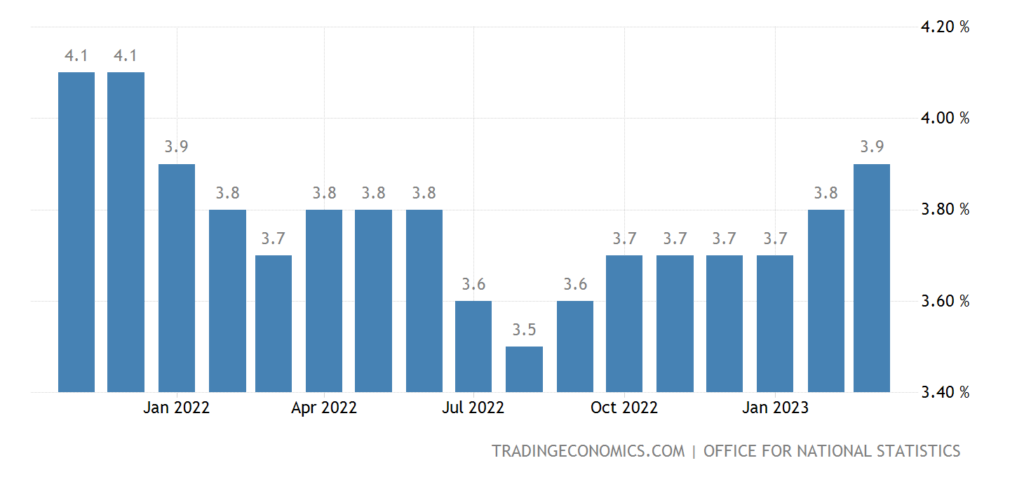
Salaries in Australia +3.7% per year – 11-year high:
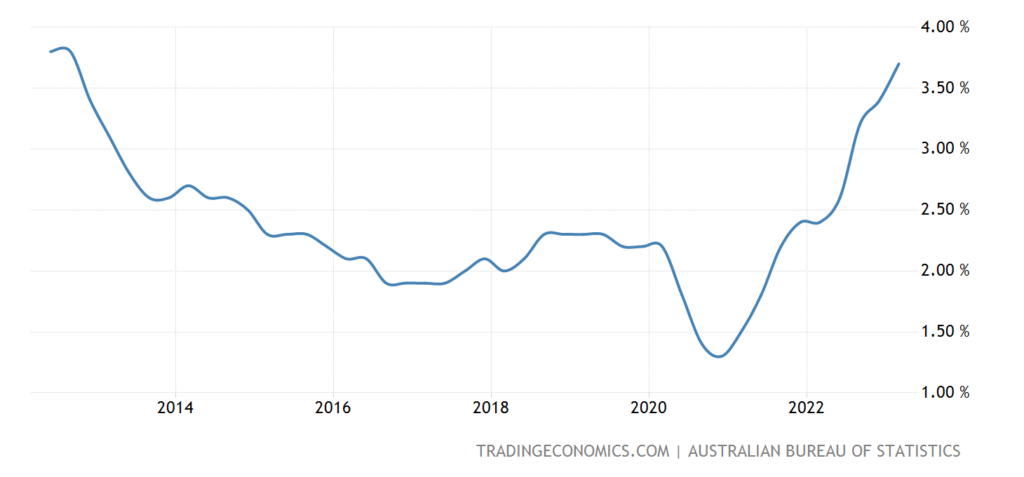
Pic. 21
But at the same time, unemployment in it unexpectedly rose to an annual high:
Pic. 22
The rise in unemployment in Britain is actively accelerating:
Pic. 23
Why is its level at its peak in 1.5 years, and without taking into account the covid surge – in 4.5 years:
Pic. 24
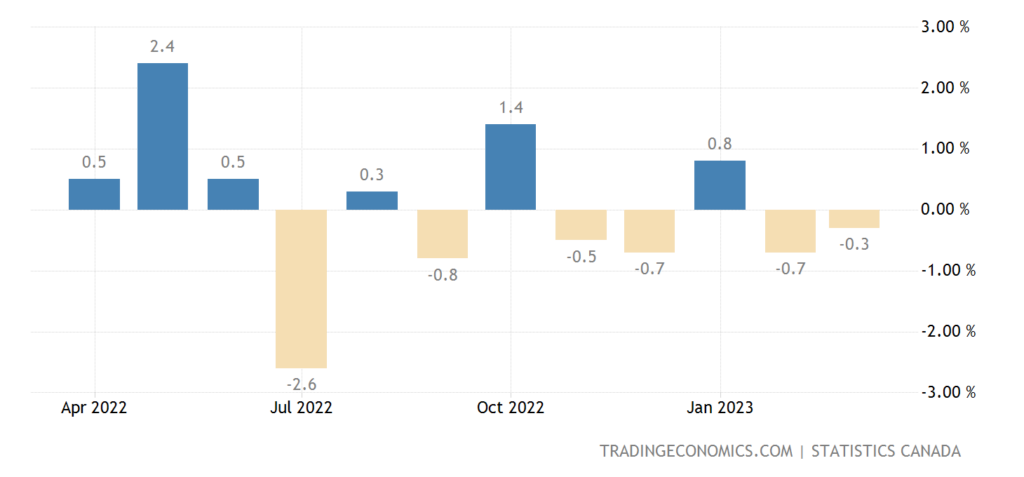
Wholesales in Canada -0.1% per month – 4th minus in the last 5 months:
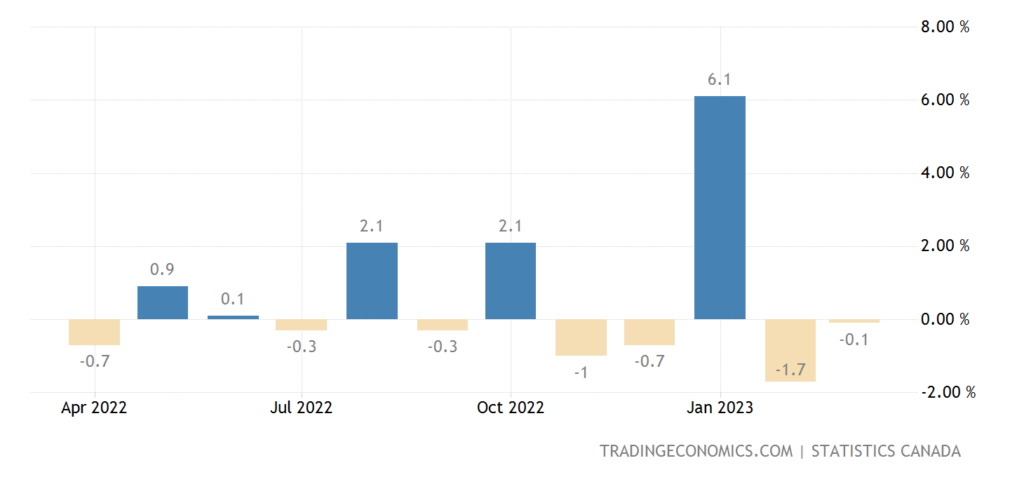
Pic. 25
And retail -1.4% per month is also the 4th minus for 5 months:
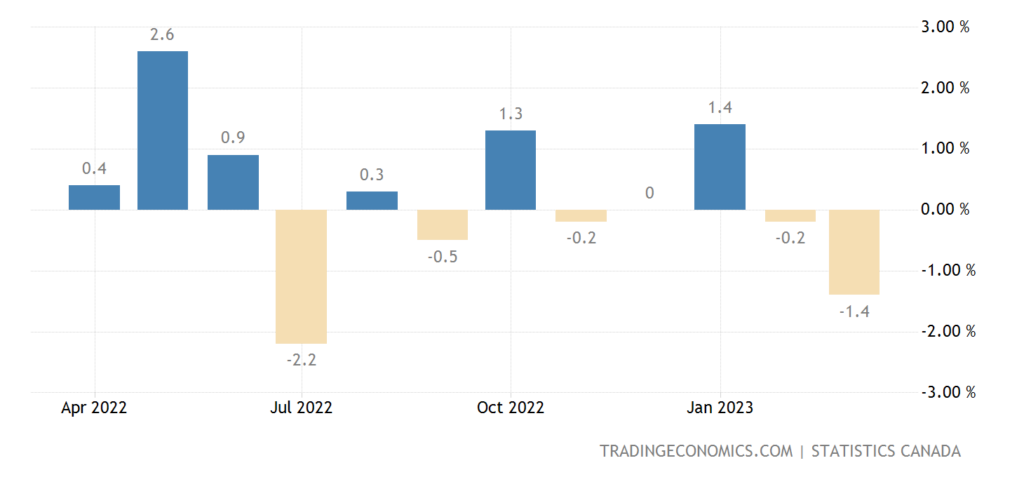
Pic. 26
A similar picture for sales excluding cars:
Pic. 27
The Central Bank of Argentina at an emergency meeting raised the rate by 6% to 97% amid a collapse of the peso by 20% a week. But the Central Bank of Mexico left everything unchanged.
If we talk about leading indicators in the US, which were partially discussed in the previous section, we recommend that you read the review by Pavel Ryabov in his telegram channel: https://t.me/spydell_finance/3391 and https://t.me/spydell_finance/3392 .
At the same time, we note that it is impossible to approach these data too seriously: both because they seriously differ from reality due to the distortion of statistical data, and because the current state of the economy is too different from the one in which the statistics on the effectiveness of these indicators were collected. .
Returning to the main topic of the Review. In one of the recent reviews, we wrote that the strategic management system in the United States was destroyed and an event of the magnitude of September 11, 2001 is needed to restore it. And default can be just such an event. Since many people in the US already understand that a lack of strategic management cannot be tolerated, it is very likely that events will develop in which a default will be created on purpose. Of course, the political management of the situation has already been thought out, but here are the economic consequences of this … Our task is to warn our readers about such a development of events.
Another interesting moment, literally at the moment when these lines were being written, there was a conference between the current head of the US Federal Reserve, Powell, and one of the previous leaders (who recently received the Nobel Memorial Prize) Bernanke. By the way, it was he who was the head of the Fed during the 2008 crisis. What can be noted from the results of this event.
The main theses of the conference: JP Morgan may become the only bank in America by the end; the relationship between the weakening of the labor market and inflation is no different from what it was before the pandemic; inflation in non-housing services is particularly sensitive to labor outcomes; inflation may be more sensitive to changes in the labor market; Price stability is the foundation of a stable economy. The Fed is obliged to return the inflation rate to 2%; inflation is now well above the Fed’s target; Fed chairs still have hawkish rhetoric. They clearly understand the pain of households (consumers); the US banking system is strong enough to withstand current and future challenges; due to tightening banking conditions, the rate may not be raised as much as we planned earlier; continued aggression in raising rates could stress the market. We may decide not to raise again; “weakness in the labor market” or its absence is an extremely important factor for future inflation; it will take more time to reduce inflation; we can afford to continue to carefully evaluate incoming macro data; no decision yet on the Fed’s rate ceiling. But until recently, we believed that further tightening of financial conditions was required.
The general conclusions are unequivocal: both Powell and Bernanke understand that inflation is much higher than acceptable (and, of course, not 5%, but significantly higher), but they also understand that further tightening of monetary policy will lead to political consequences. And therefore, they (well, more precisely, Powell, and Bernanke simply supports him) reserve the maximum corridor of opportunities for themselves and will demand a political decision from the White House. And here we again return to the logic of the need to restore the strategic management system in the United States.
In general, we are forced to leave our readers in a state of some anxiety. The only good news is that most people around the world do not understand what is happening at all, so our subscribers have serious competitive advantages. In this connection, they can rest easy on the weekend and look to the future with optimism during the work week!