
March 25-31, 2023
Big news. As we remember, in the previous review, three news items argued among themselves, one of which was the visit to Russia of the new-old head (“emperor”) of China Xi Jinping. We noted that this visit means in fact the elimination of the unipolar world, and simultaneously with the visit and in the next two incomplete weeks, the following happened:
- China and Brazil abandoned trade in dollars between their countries and reached an agreement to trade their own currencies;
- Saudi Arabia is considering accepting Chinese yuan for oil sales;
- China and France completed the first CNY LNG trade;
- Russia has announced that it is considering using the Chinese yuan as a reserve currency;
- Saudi Arabia is partnering with China to build a 83.7 billion Chinese yuan ($12.2 billion) oil refinery;
- China and Brazil agreed to use the Chinese yuan in cross-border transactions.
Well, the share of world reserves in US dollars has decreased from 72% in 1999 to 59% at present.
Thus, political events have an effect almost without a time lag. Well, or, the actions of large countries that are closed to the general public become public and begin to actively shape a new reality. Well, to make it even more fun, credit default swaps on one-year Treasury papers jumped sharply:
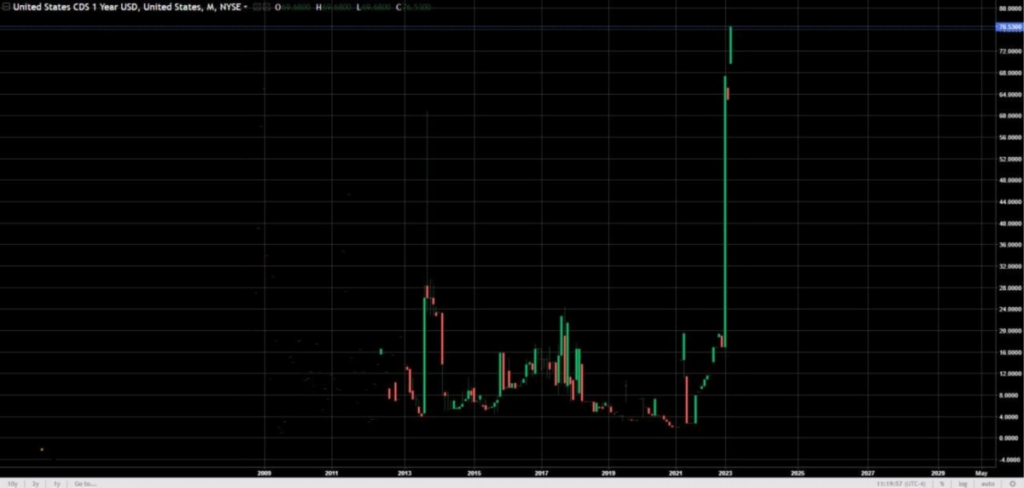
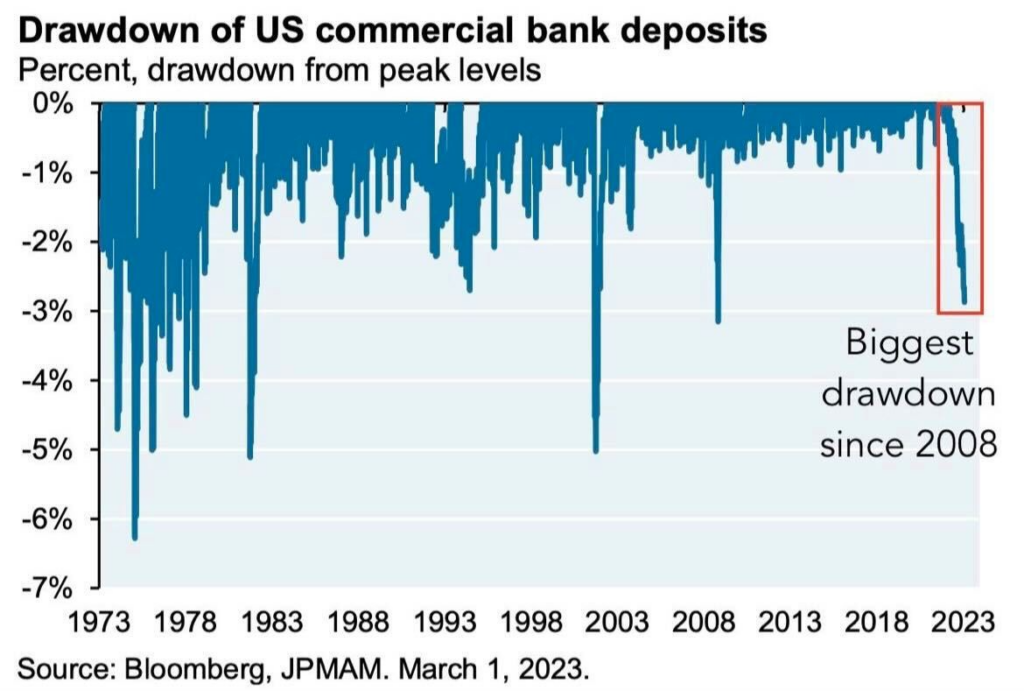
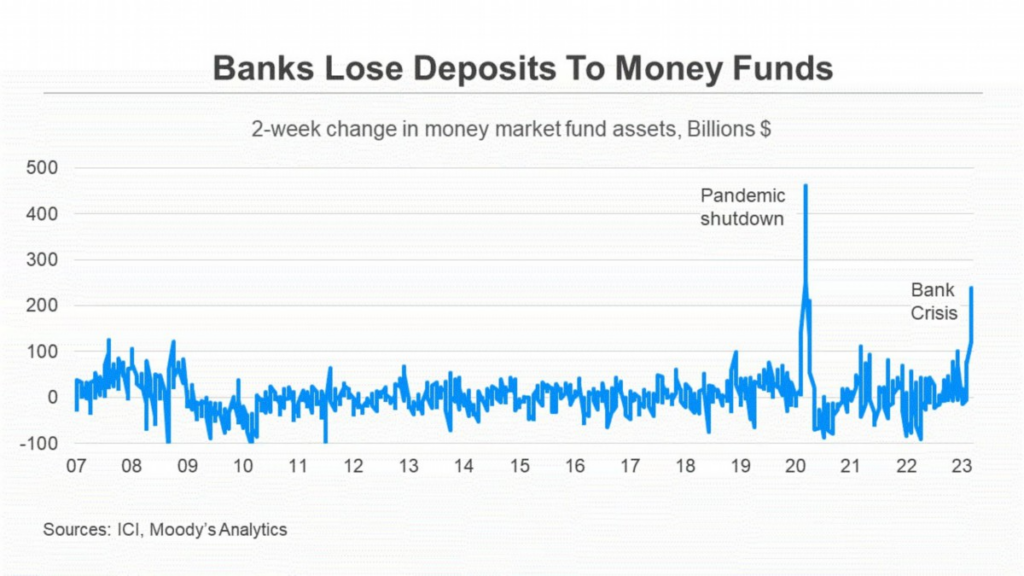
From the point of view of common sense – nonsense, of course, but the exchange has its own rules. But bank deposits are actively declining (and the scale of these reductions is already causing unhealthy associations):
In general, the main news of the week is a sharp drop in the “health” of the dollar. However, in the political field of the United States, all this was blocked by the news about the possible arrest of Trump…
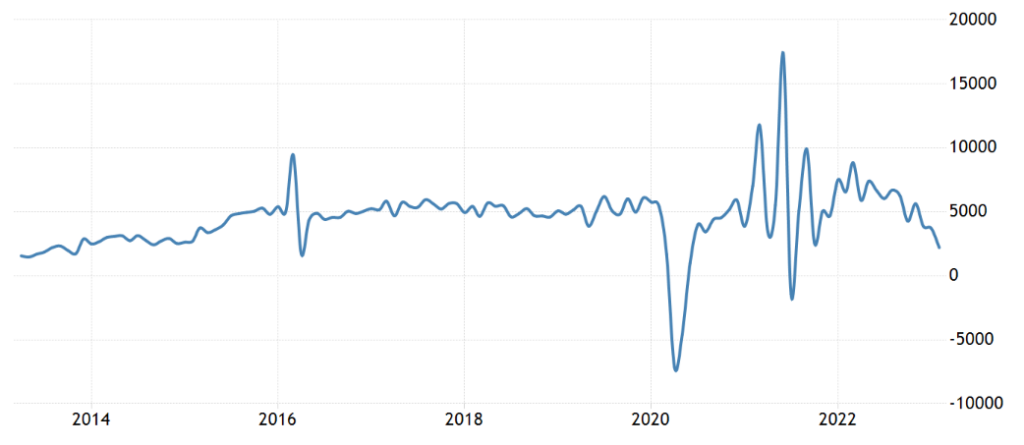
Macroeconomics. Industrial production in Brazil -0.3% per month – 3rd negative in a row and 5th in the last 6 months:
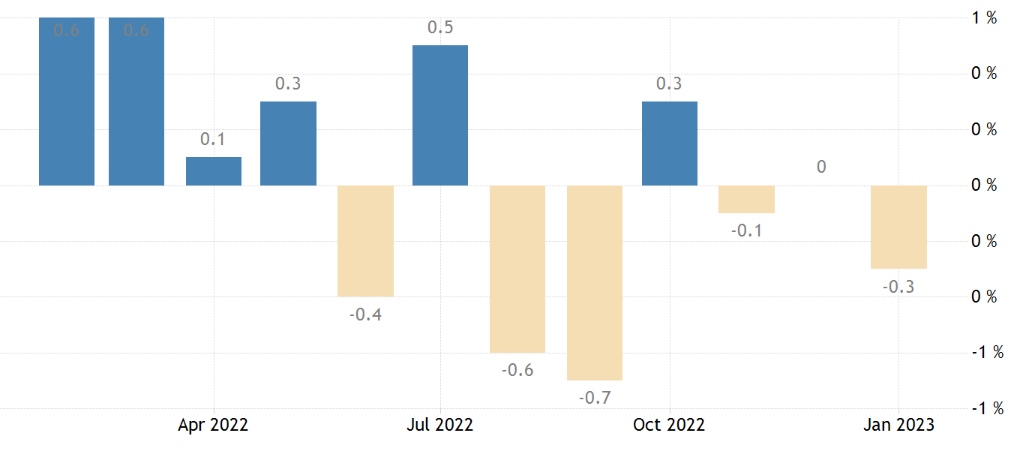
Pic. 3
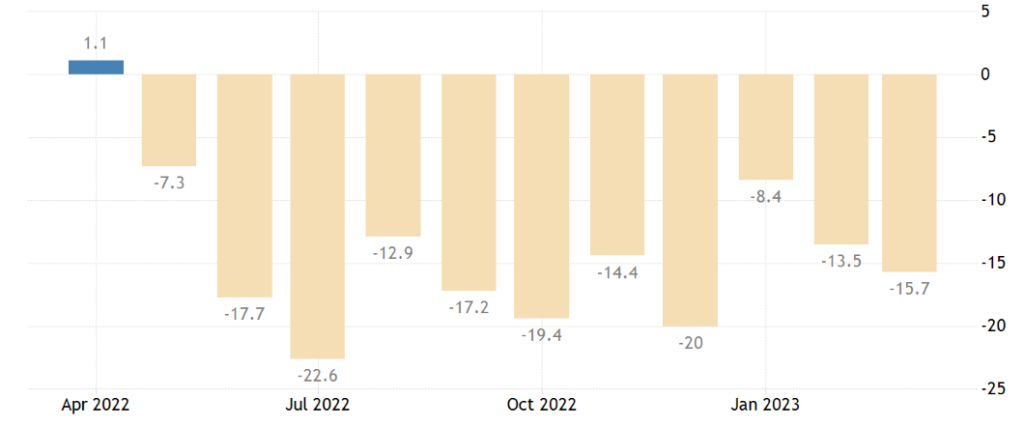
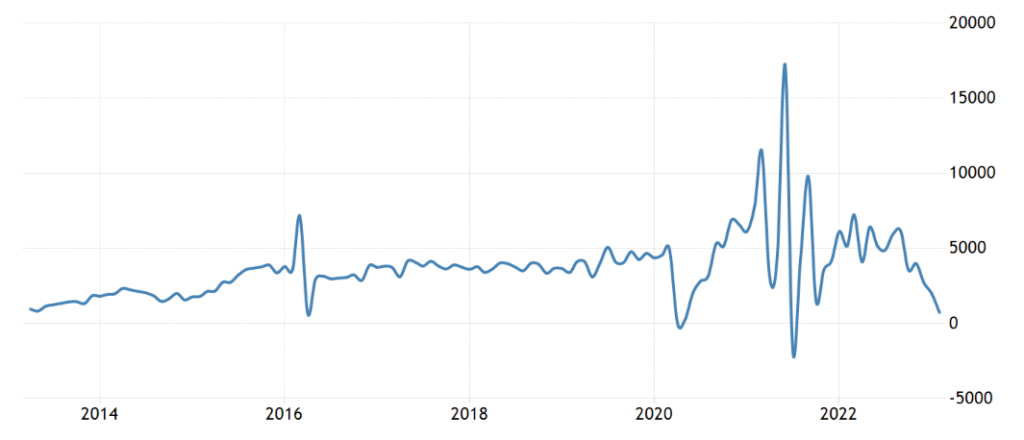
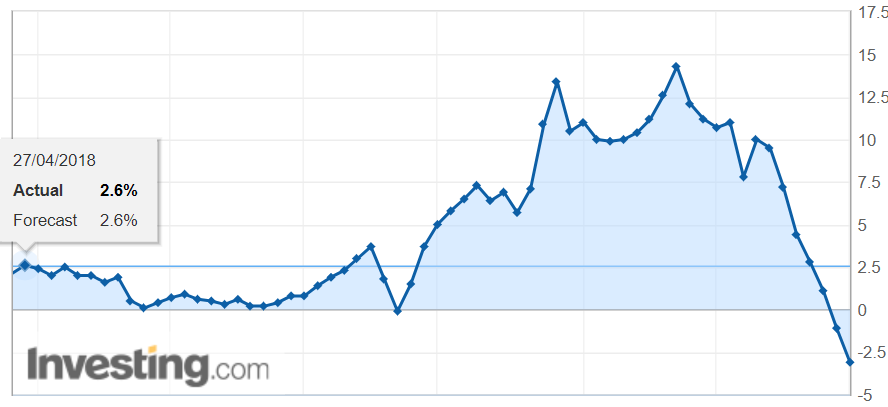
In Japan -0.6% per year – the 4th negative in a row:
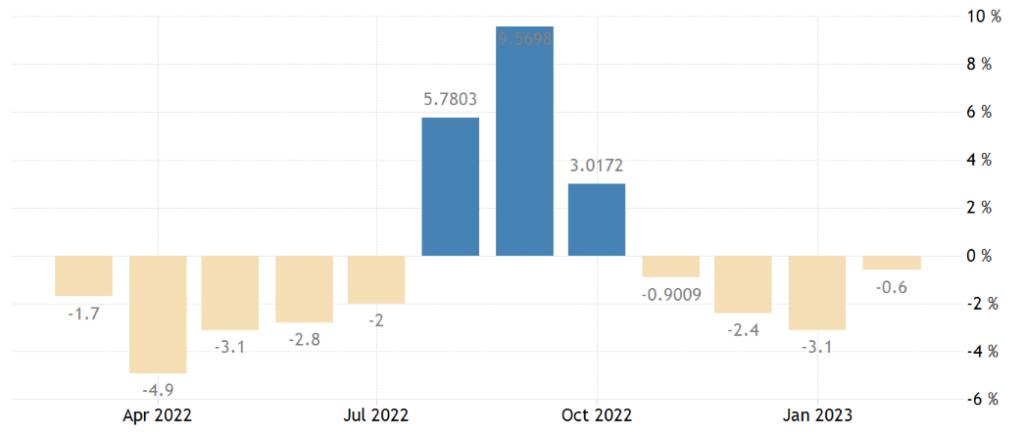
Pic. 4
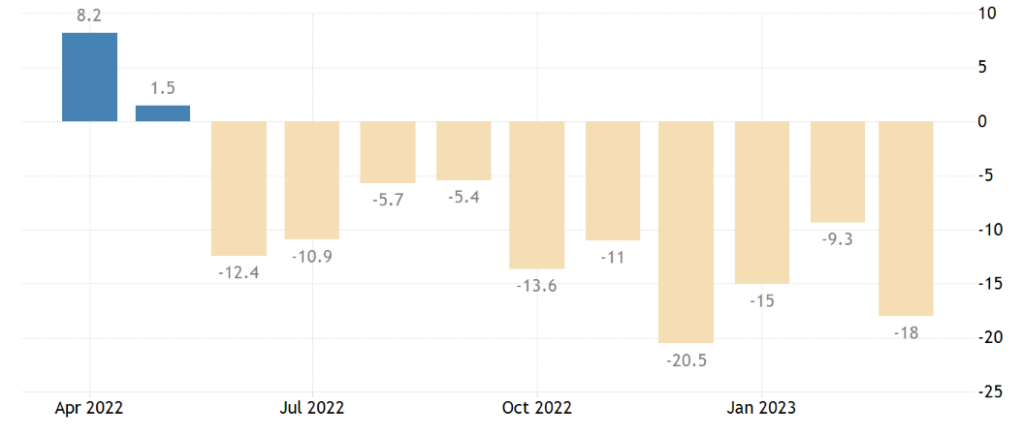
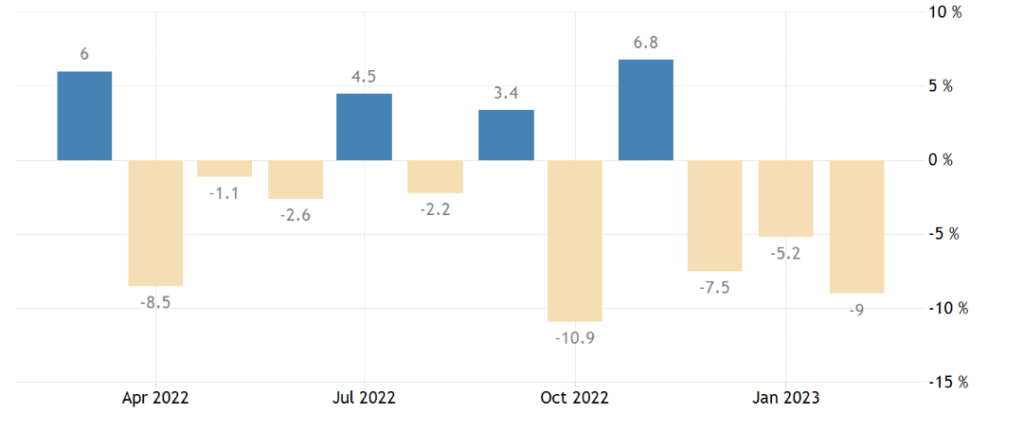
South Korean industrial output -3.2% per month – 7th minus in the last 8 months:
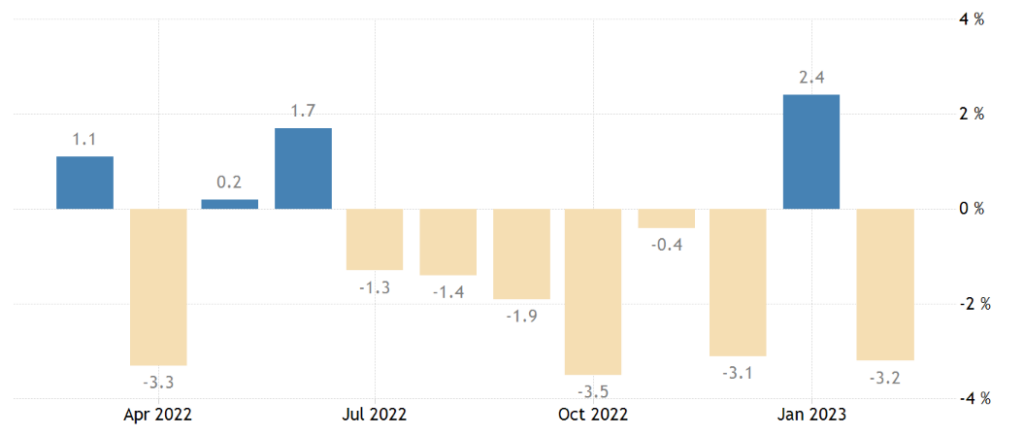
Pic. 5
And -8.1% per year — the 5th monthly loss in a row:
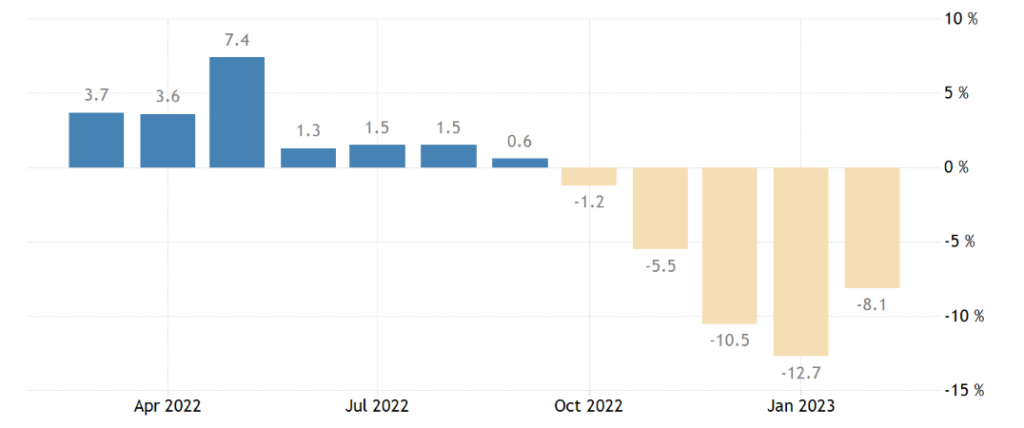
Pic. 6
But the official PMI (expert index of the state of the industry; its value is already 50 means stagnation and decline) of China’s non-manufacturing sectors is the highest in 12 years (58.2):
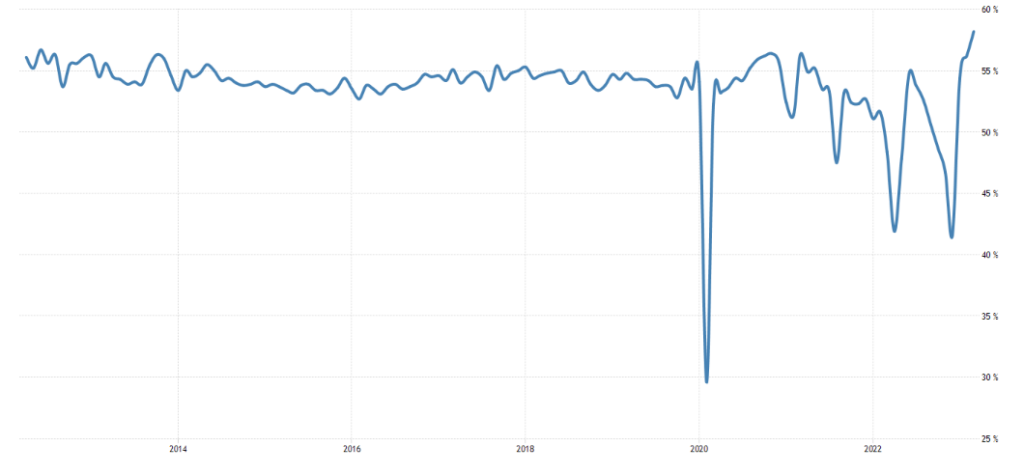
Pic. 7
The only question is, is this the result of emissive stimulation, the creativity of statistical bodies, or reality? Generally speaking, the answer is no.
The index of activity of the manufacturing sector in the area of the Federal Reserve Bank (FRB) of Texas has been in the red for 11 months in a row:
Pic. 8
And the service sector of the same region – 10 months in a row, the index is near a 3-year low:
Pic. 9
A similar indicator of the Richmond Fed updated the 3-year bottom and also showed the 10th negative in a row:
Pic. 10
There are no such data for Chicago this week, but Chicago PMI (43.8) has been in the decline zone for 7 months in a row:
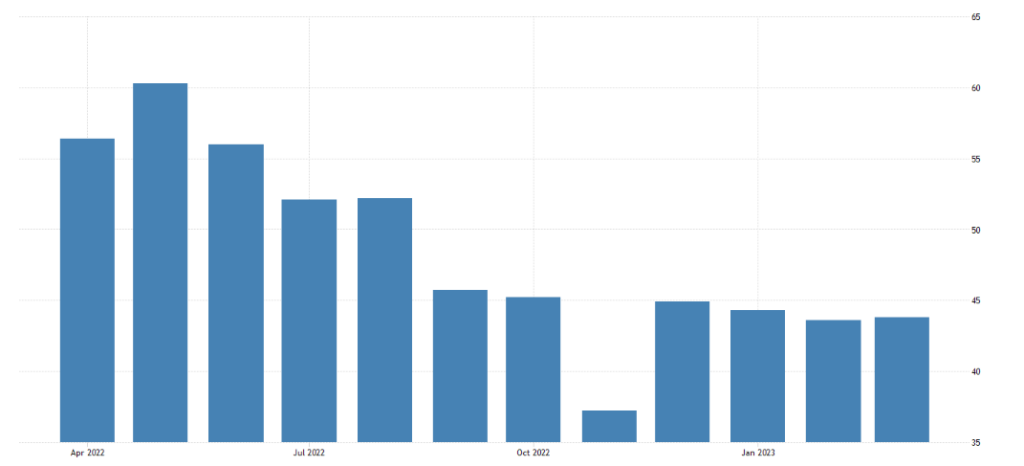
Pic. 11
Leading indicators of Japan at the bottom since November 2020:
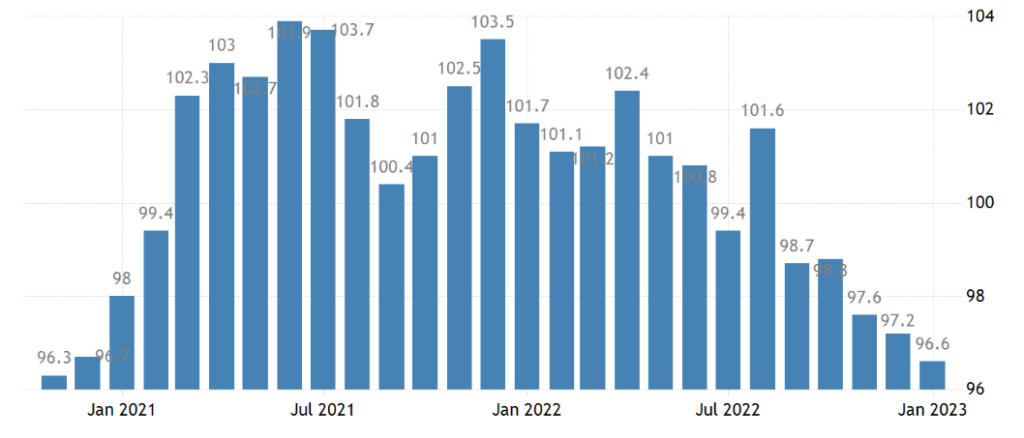
Pic. 12
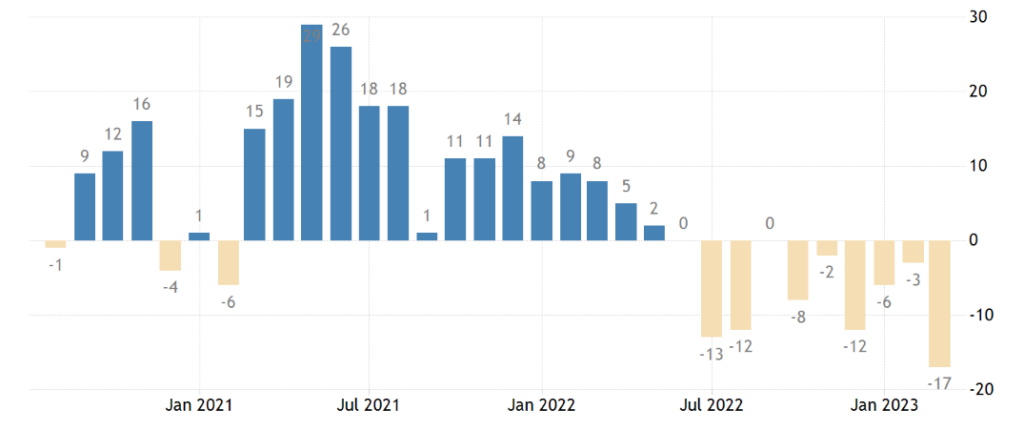
Building permits in New Zealand -9.0% per month – 3rd negative in a row:
Pic. 13
Pending sales of existing homes in the US -21.1% per year – the 21st monthly loss in a row; earlier, a longer period of decline was only in 2005/08:
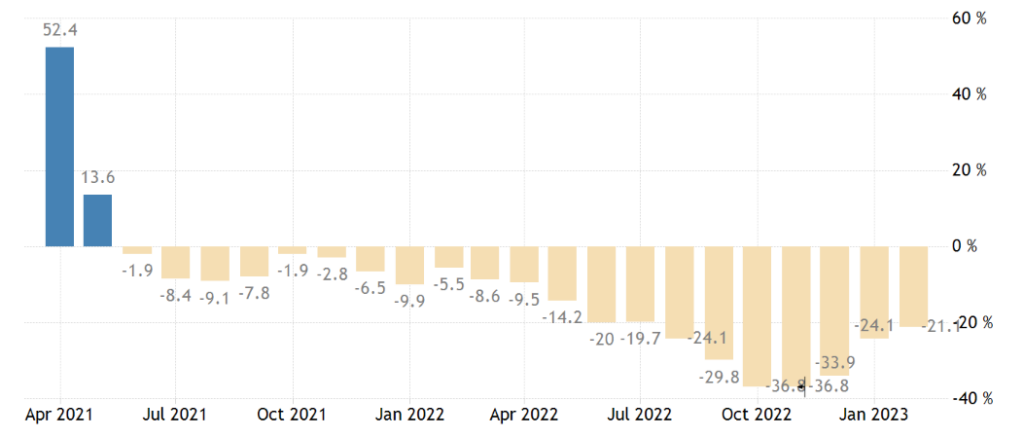
Pic. 14
Net mortgage lending in the UK is the lowest in 1.5 years, excluding the covid failure, since 2016 (then it was a consequence of Brexit), and before that – since 2013:
Pic. 15
A similar picture in lending to individuals in general:
Pic. 16
House prices in Britain -0.8% per month (7th consecutive minus) and -3.1% per year (the worst dynamics since 2009):
Pic. 17
Pic. 18
House prices in the US according to private experts -0.6% per month – the 7th minus in a row, for the first time in 11-12 years:
Pic. 19
And only +2.5% per year is the bottom since 2019; in San Francisco already -7.6%:
Pic. 20
Official data confirms the trend – the minimum increase in 3 years, and the west coast is already in decline:
Pic. 21
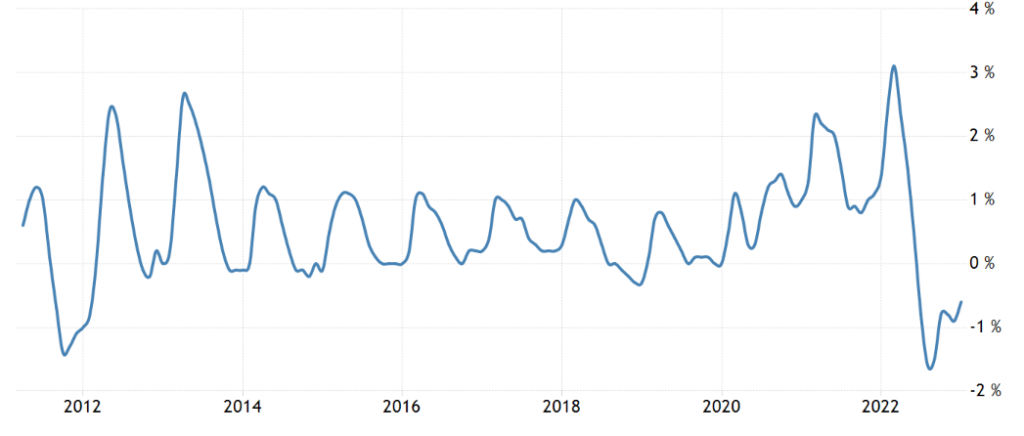
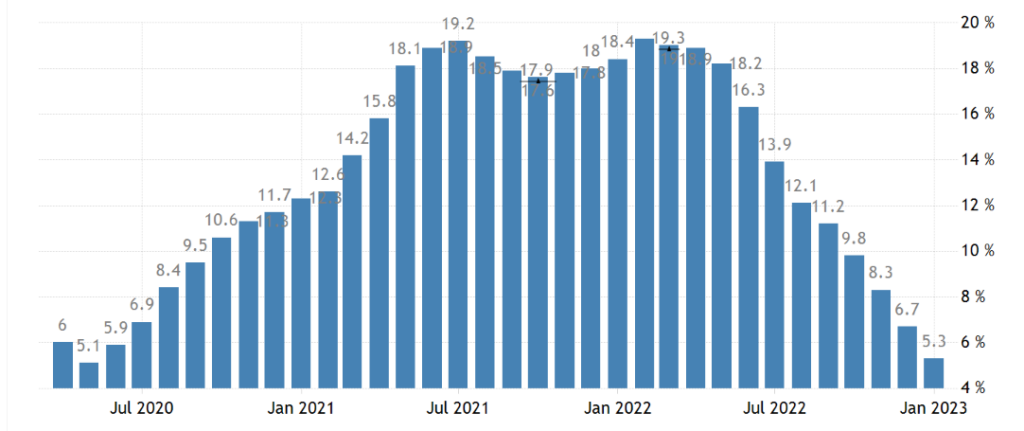
Unit M3 in the Eurozone +2.9% per year – the worst dynamics since October 2014:
Pic. 22
Pic. 23
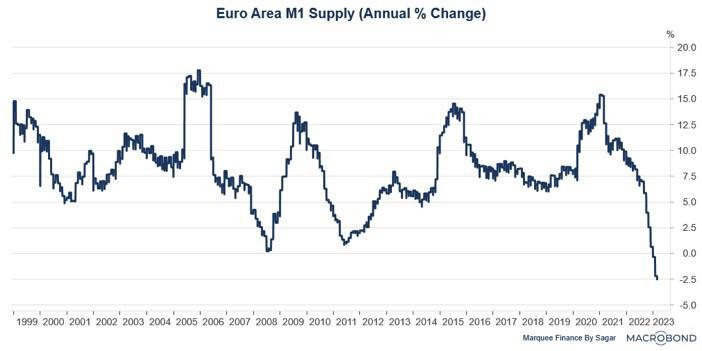
Someone will say: “Hurrah! Inflation will start to decrease!”, but this is not the case. In a period of structural crisis, the growth of inflation, in many respects, is in the nature of an increase in costs (maintaining a distorted structure of the economy costs more and more). This growth is not monetary, you cannot eliminate it by reducing the money supply, which is well remembered by our citizens from the “reforms” of the 1990s.
Moreover, since a decrease in the money supply reduces the investment process, cost-push inflation rises, we wrote about this, and the rate increase causes an increase in the structural component of inflation. So, most likely, such a slow growth in the money supply (much lower than even official inflation) means an intensification of degradation processes in the economy.
And here’s a picture for clarification:
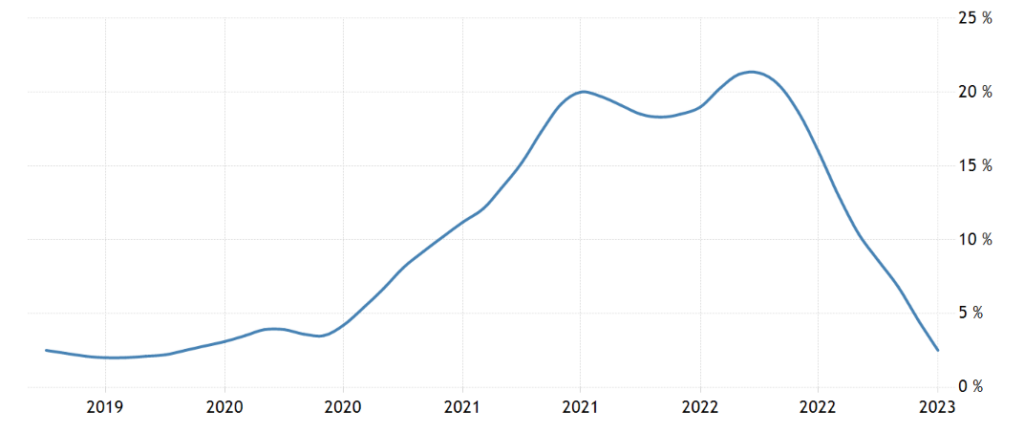
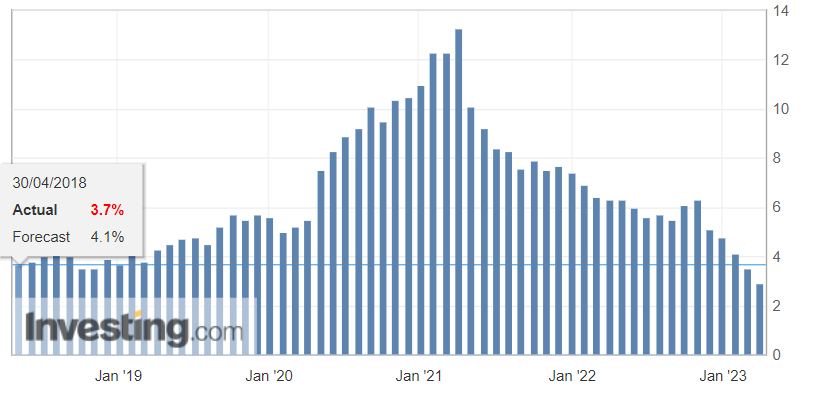
“Net” (minus the highly volatile components of food and fuel) CPI (consumer inflation index) of the eurozone + 5.7% per year – a record for 32 years of observation:
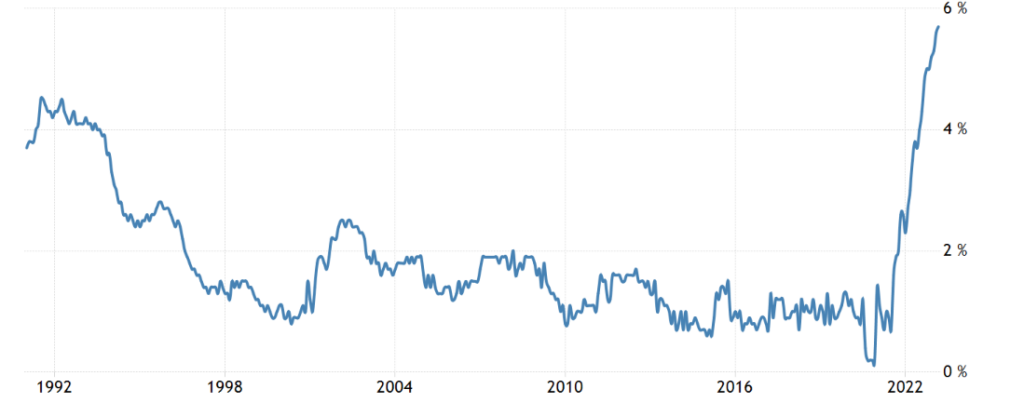
Pic. 25
Retail sales in Germany -1.3% per month – 3rd negative in a row:
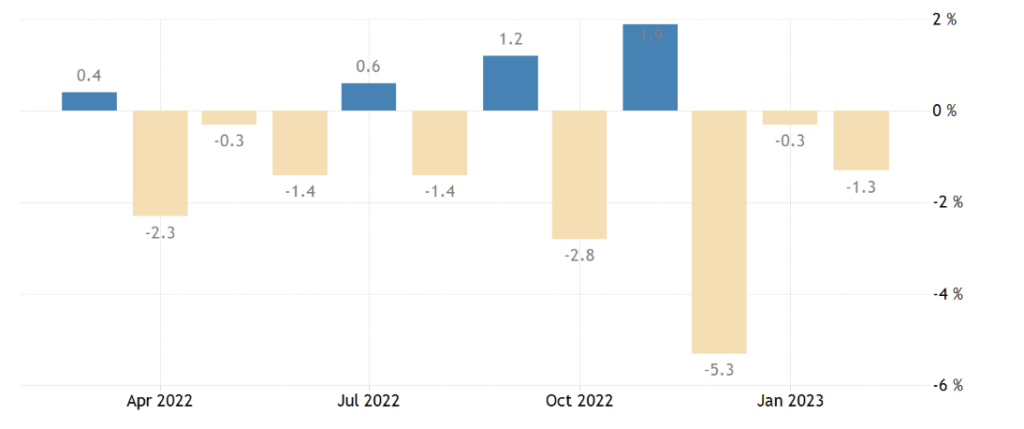
Pic. 26
And -7.1% per year — the 10th monthly loss in a row:
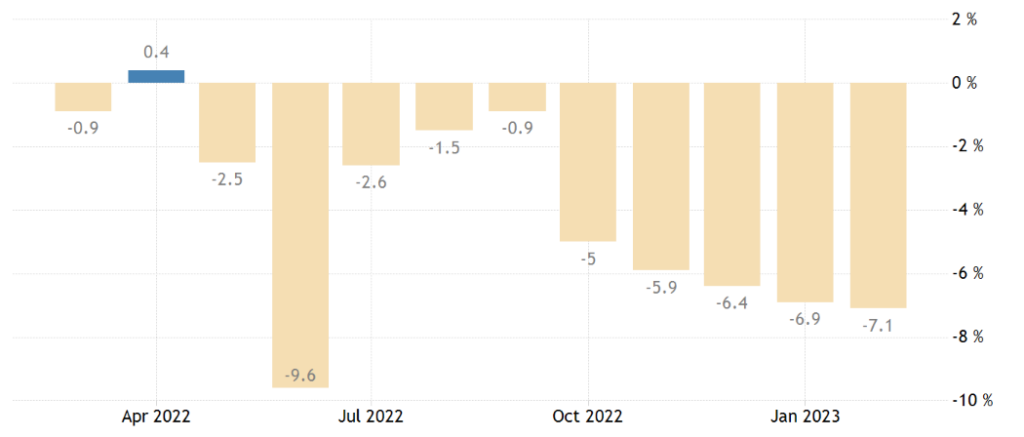
Pic. 27
And this is already a recession of the economy without any doubt.
Japanese unemployment at annual highs:
Pic. 28
And the German one is almost for 2-year-olds:
Pic. 29
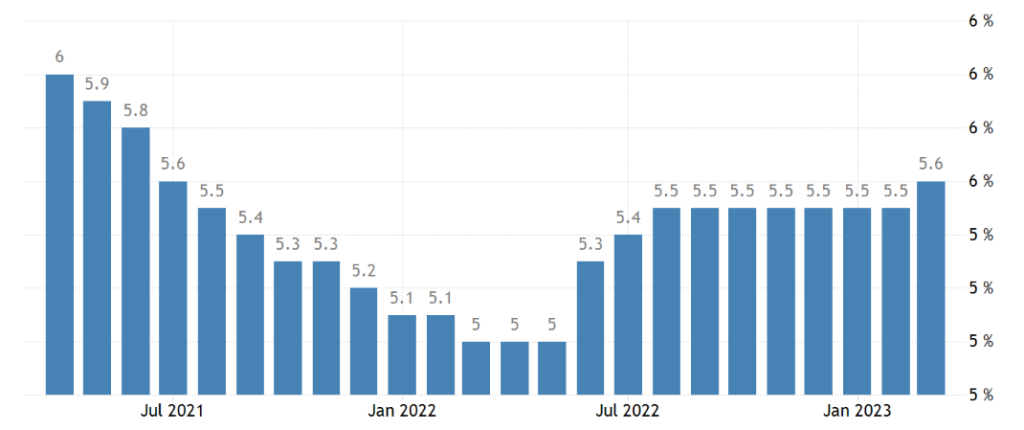
The Central Bank of South Africa raised the rate by 0.50% to 7.75%.
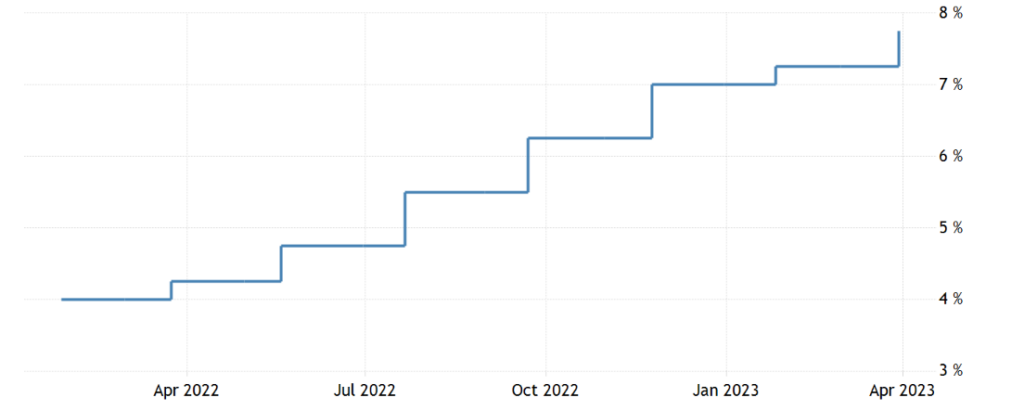
Pic. 30
The Central Bank of Mexico raised the interest rate by 0.25% to 11.00%.
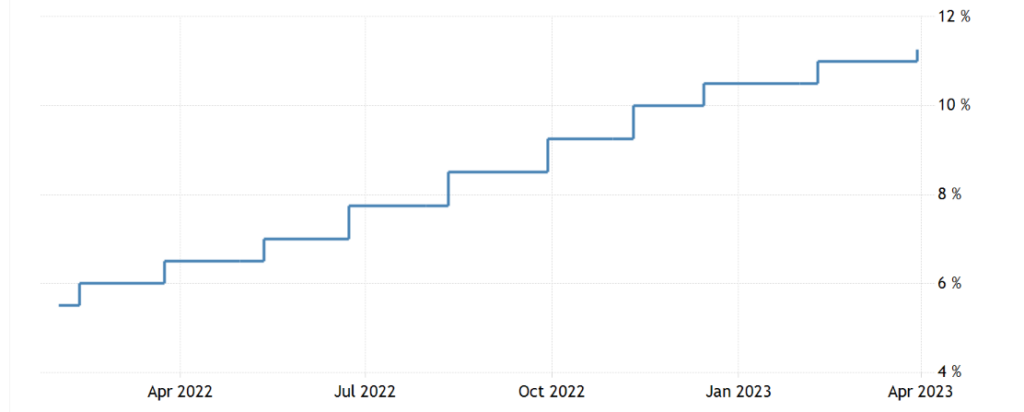
Pic. 31
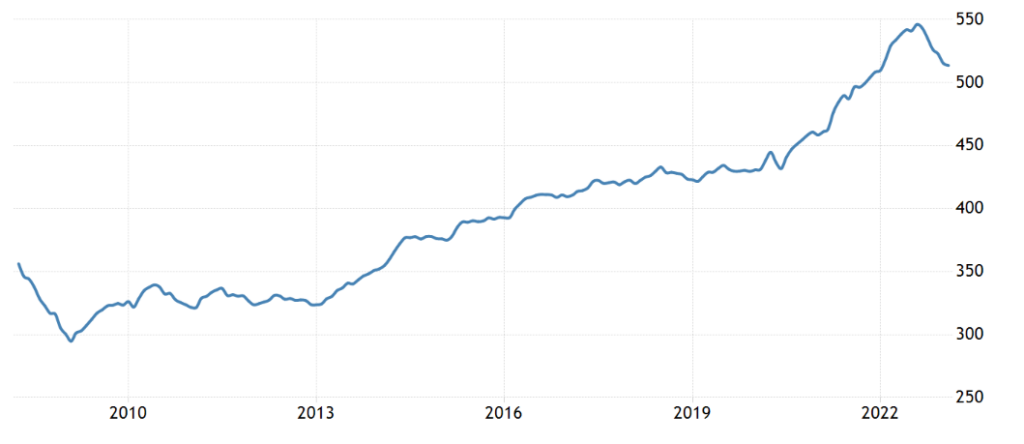
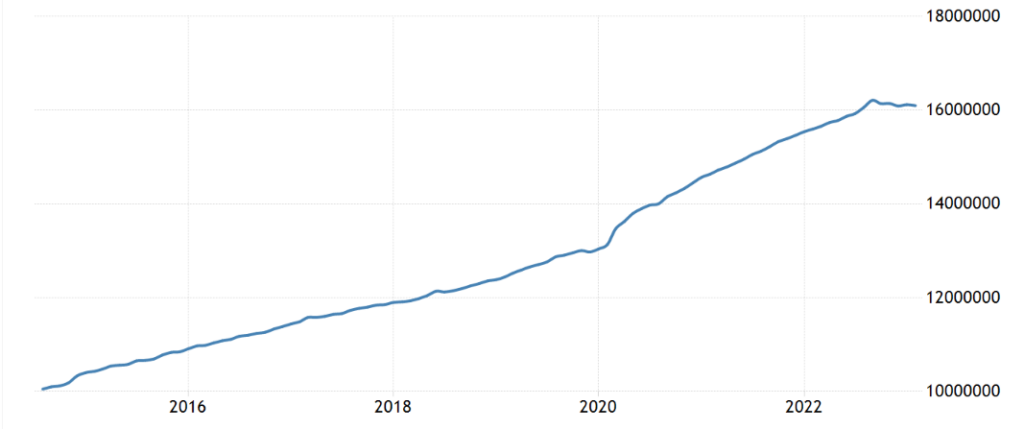
Main conclusions. For starters, according to the US regional reserve banks. Money supply chart (M2 unit) in the USA:
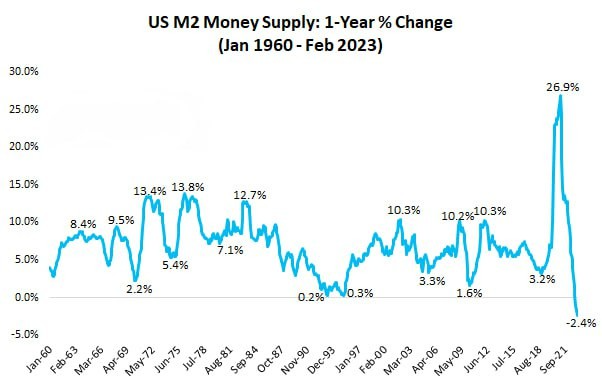
It would seem that the money supply is falling, inflation should be falling! But here the effect is the same as in the EU: the structural component of inflation does not decrease with an increase in the rate. But for banks, the ability to earn money is falling – which was demonstrated by the US financial elite in the recently orchestrated crisis.
In general, against the background of the fight against inflation, the economy begins to fall, which we see in the numbers, but the trouble is that the banks that have received significant amounts of money over the past three weeks will not help here. Since they do not want to invest (the risks are too high), and speculation will not help the economy, only inflation will jump, already the monetary component.
Moreover, citizens, as we have already noted, withdraw deposits and invest in speculative instruments, we already noted this in the last Review:
And in such a situation, banks are forced to reconsider their ability to invest “long-term” based on deposits from citizens: the risks here begin to seriously grow. Accordingly, the US economy begins to sag …
But otherwise, a typical structural crisis continues, which the US and EU monetary authorities cannot describe, but our experts have perfectly described. Therefore, our readers can rest easy on the weekend and continue their work next week, they understand what is happening and what it can lead to.
Until next week!