
March 11-17, 2023
Big news. Theoretically, this could be data on inflation in the US. But, firstly, they turned out to be quite ordinary (that is, they do not carry any additional information, details in the last section of the Review), and secondly, they were completely “hammered” by information about the “banking crisis”. Why quotes – a little lower.
And, thirdly, the consequences of this “crisis” devalued the inflation data, as they fully revealed the real development of the situation in the coming months. So the “banking crisis” became the key event.
It began with the bankruptcy of the Silicon Valley bank (we managed to write about the beginning of the problems in the previous review, since the bank’s insolvency was announced on Friday afternoon). It continued with several other, smaller banks in the US and intensified on Monday with large banks in the European Union. And here we can note some oddities.
First of all, the actual closing of the bank was announced in the middle of the working day. Which, as you know, significantly unleashed the panic. In addition, many sources began to clearly hysteria, having, by and large, no objective reason for panic. Well, on Sunday everything became clear, since the Fed received the “go-ahead” from the political authorities to resume the emission. Next is the bare texture.
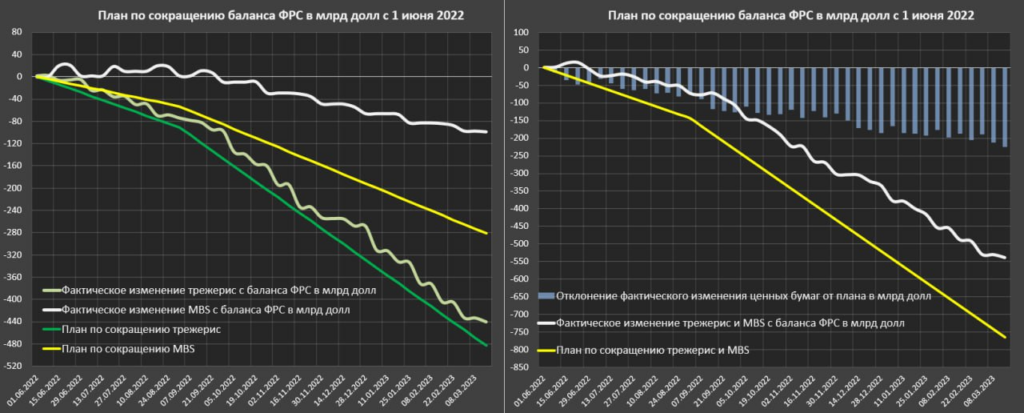
This, as is clear, is part of a plan to tighten monetary policy. This plan was not carried out, and the deviation towards a softer policy was growing all the time.
Further, the data on the balance sheet of the US Federal Reserve:
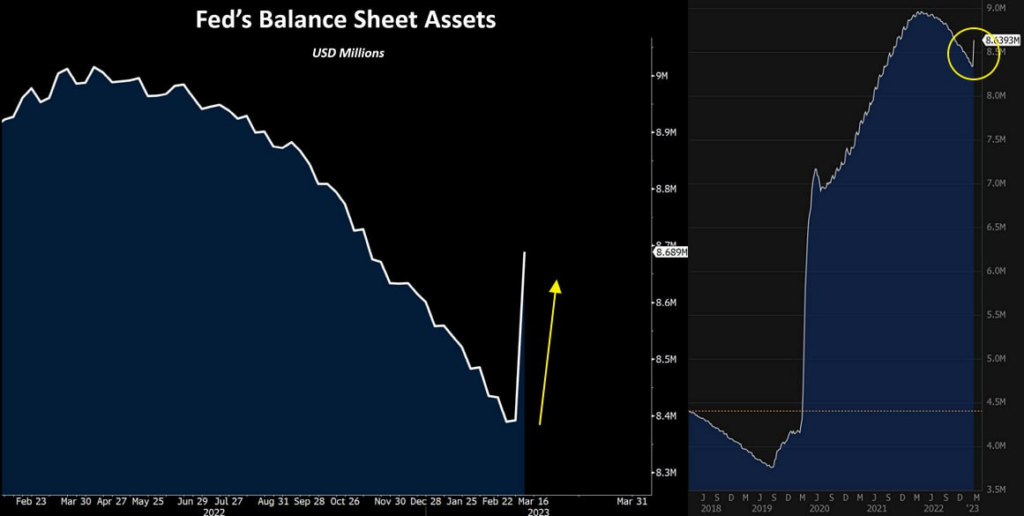
Beautiful picture of the last week, isn’t it? And here are the indicators for weekly support of the banking system:
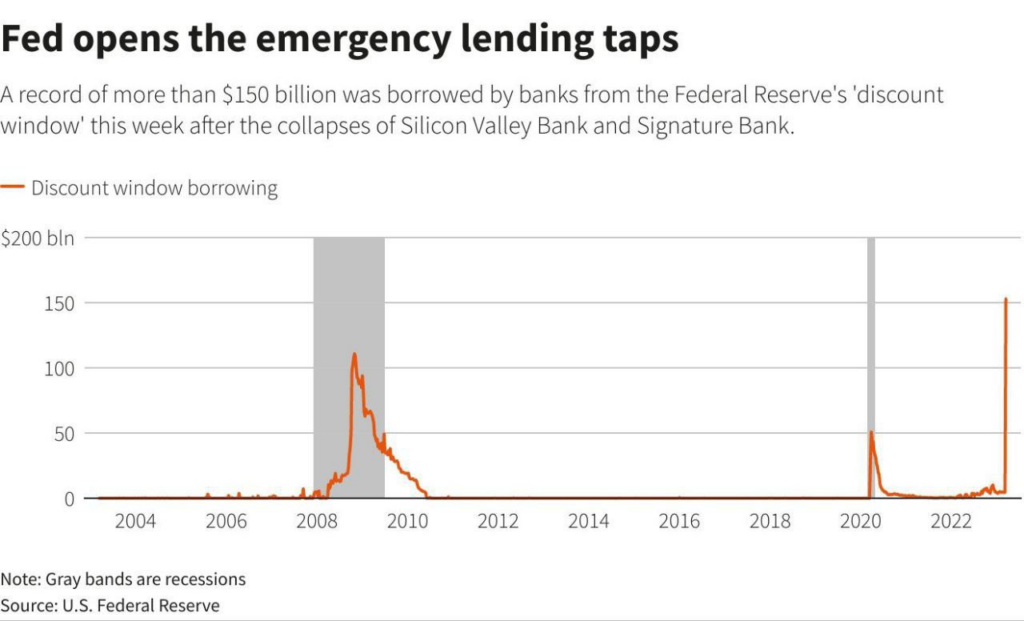
I remind you that the gray bar is the official recession.
For reference, the Fed’s balance sheet structure is:
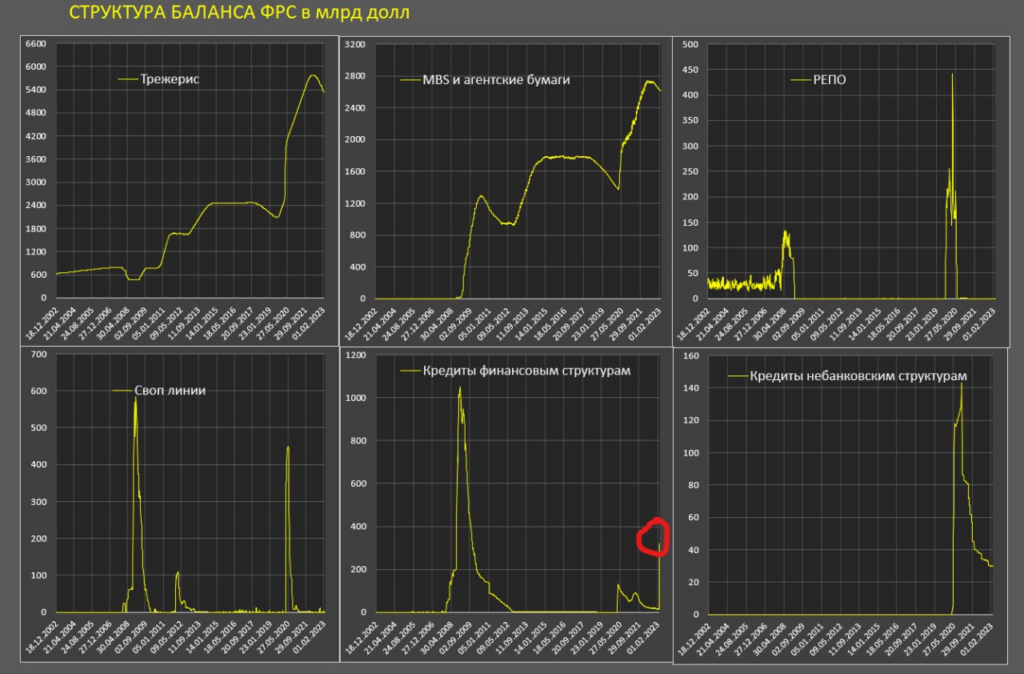
In fact, today we can safely say that there was no threat to the US financial system, and the panic was deliberately inflated in order to stop the tightening of monetary policy. As soon as permission was received on Sunday, the panic was quickly closed.
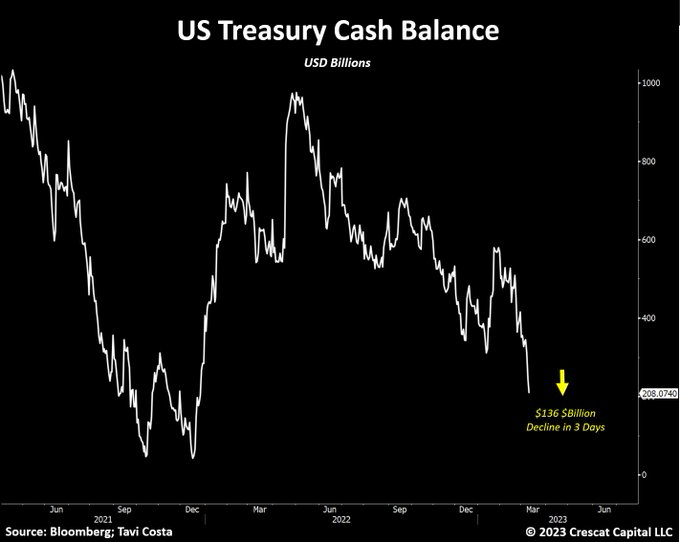
True, there are some problems, the main of which is the budget. Especially given the need to raise the public debt limit, without which there is very little money left in the Treasury accounts.
As for the EU, the situation there is absolutely similar. The fact that “Credit Suisse”, “Crédit Lyonnais” and “Deutsche Bank” are dying has long been known (Daisuke Kotegawa told me about this for the first time at the “Dialogue of Civilizations” in Rhodes 10 years ago), this will not surprise anyone. But under well-inflated panic, the Bank of Switzerland was allowed to allocate more than 50 billion francs to support Credit Suisse, similar decisions will be made for other banks.
Taking into account the fact that there was a meeting of the ECB last week, which raised the rate by 0.5%, it can be assumed that the monetary authorities of the EU decided to continue their policy, in which the rate is raised, but the banks are given money. As for the real sector, it seems to be recommended to move to other regions…
It should be noted that under the bankruptcy of Silicon Valley, a number of dubious “investment” projects related to “big farm” and “green energy” were also written off, and, perhaps, we will find out something else like that. By the way, the management of the bank, which has been withdrawing their own money from it for several months, will most likely end up in the dock, which is also useful for easing social tensions.
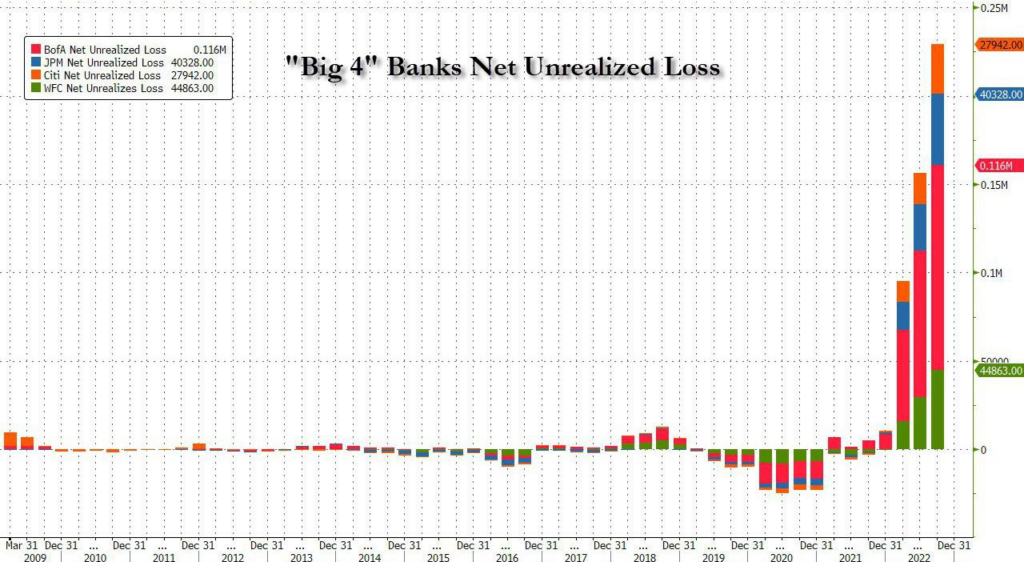
Although, by and large, large US banks have problems. But not today:
Well, the conclusions are in the final section of the Review.
Macronomics. New Zealand GDP -0.6% qoq:
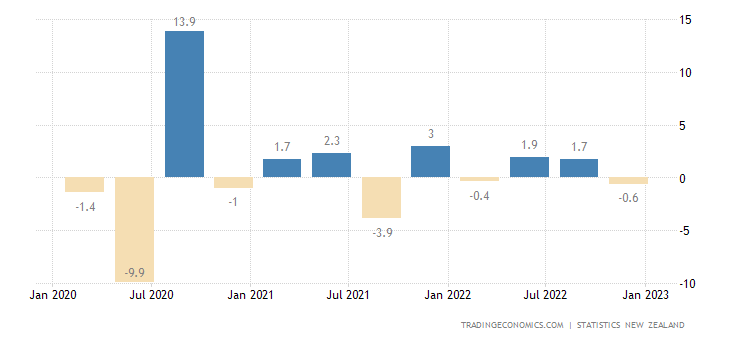
Pic. 7
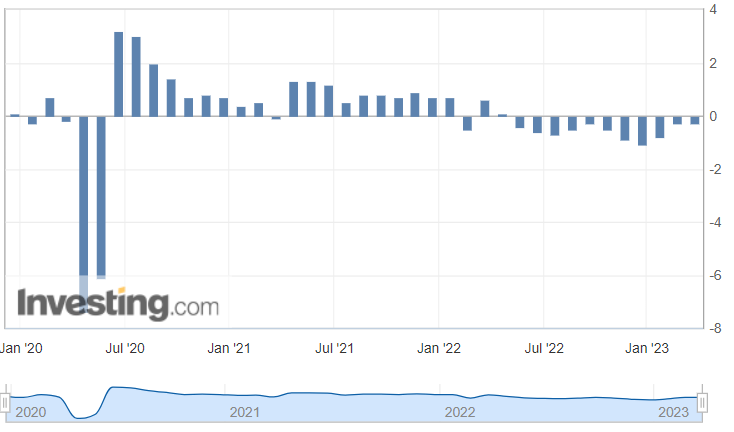
Norway’s GDP -0.2% per month – 3rd minus in the last 4 months:
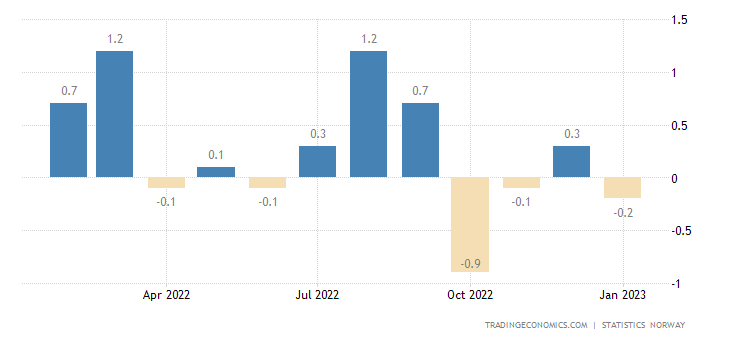
Pic. 8
Foreign direct investment in China in January-February grew by only 1% per year (in dollars):
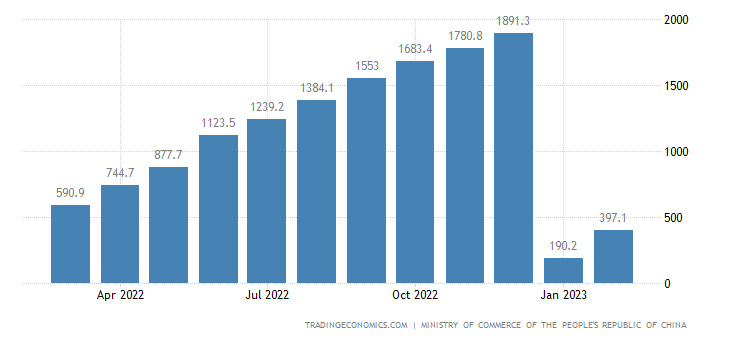
Pic. 9
Industrial production in Italy -0.7% per month – the 4th minus in the last 5 months:
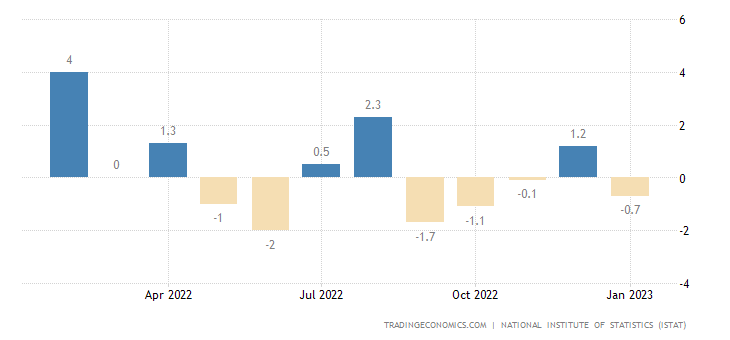
Pic. 10
In the USA -0.2% per year – the 1st minus in the last 2 years:
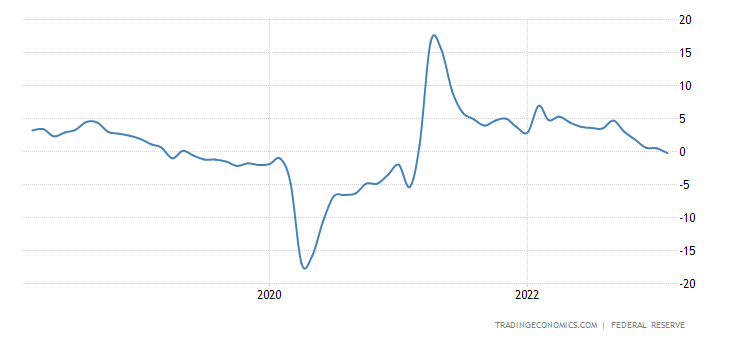
Pic. 11
Output in the Japanese industry -5.3% per month – the worst dynamics in 8 months:
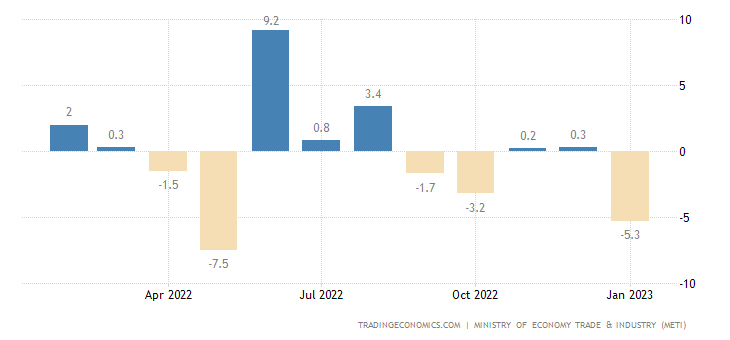
Pic. 12
And -3.1% per year — the 3rd negative in a row:
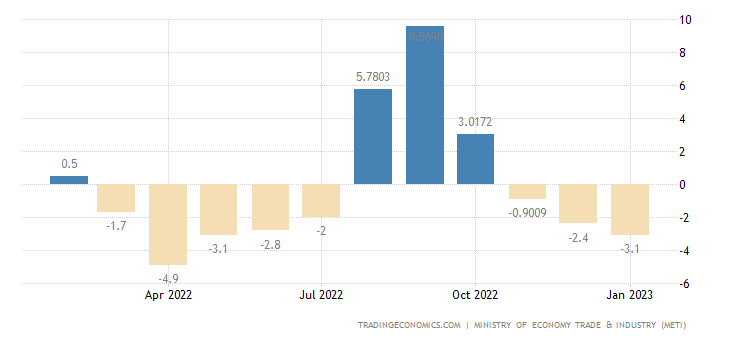
Pic. 13
The New York Fed Index has been in the red for 4 months in a row:
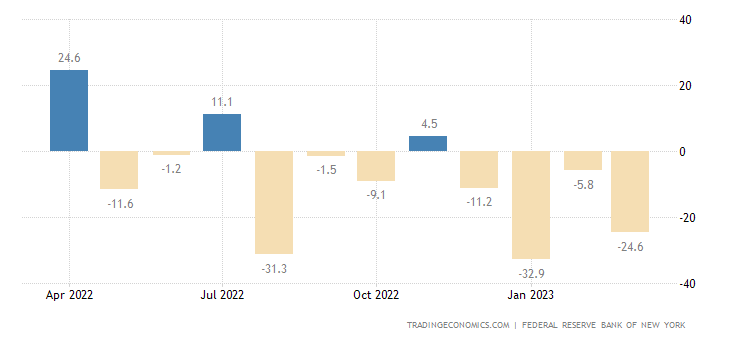
Pic. 14
Philadelphia Fed Index – 7 consecutive months:
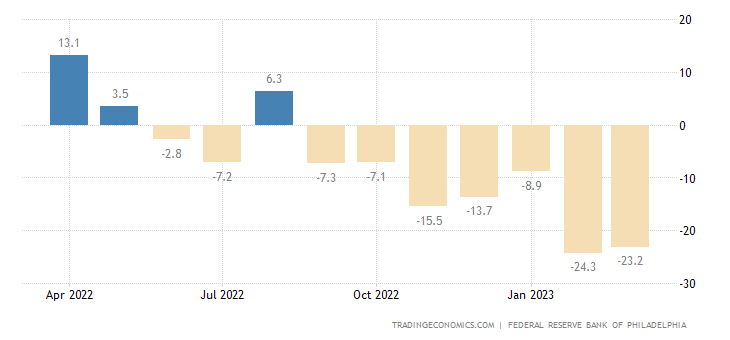
Pic. 15
And its new orders component has been at the bottom since 2009, not counting the covid drop in 2020:
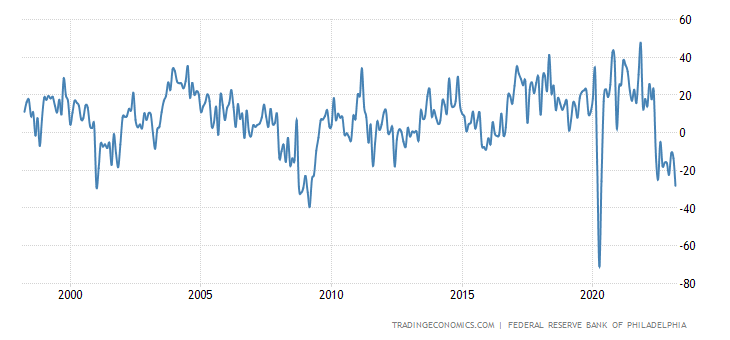
Pic. 16
Leading indicators in the US have been declining for 11 months in a row:
Pic. 17
The confidence of major manufacturers in Japan has been minimal since 2020, and before that – since 2014:

Pic. 18
Turkey has a record current account deficit:

Pic. 19
The budget deficit is also a record:
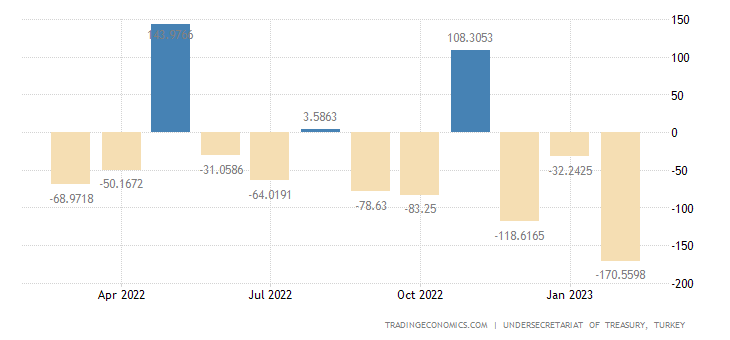
Pic. 20
Building permits in South Africa -40.4% p.a. to levels that are the worst (excluding the failure of 2020) in 10 years:
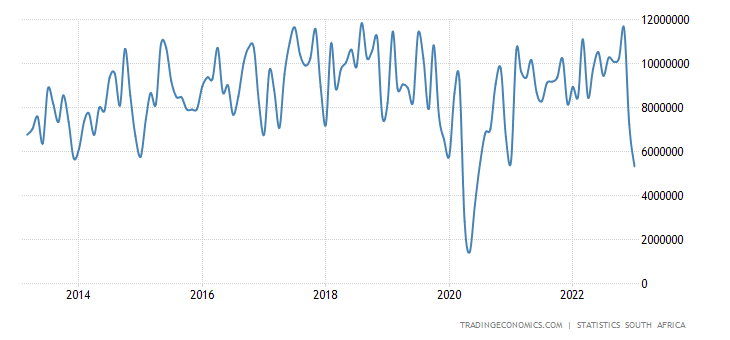
Pic. 21
Housing prices in China remain in the annual red for 10 months in a row:
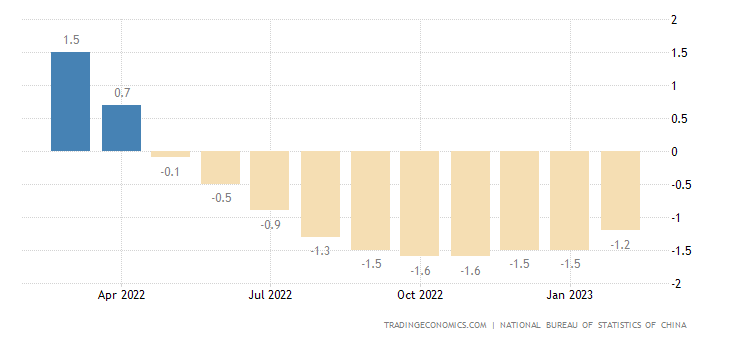
Pic. 22
CPI (Consumer Inflation Index) Argentina +102.5% per year – the highest since 1991:
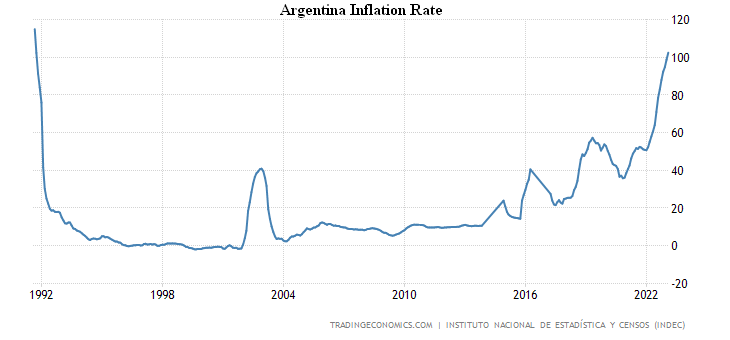
Pic. 23
French CPI +6.3% per year – peak since 1985:
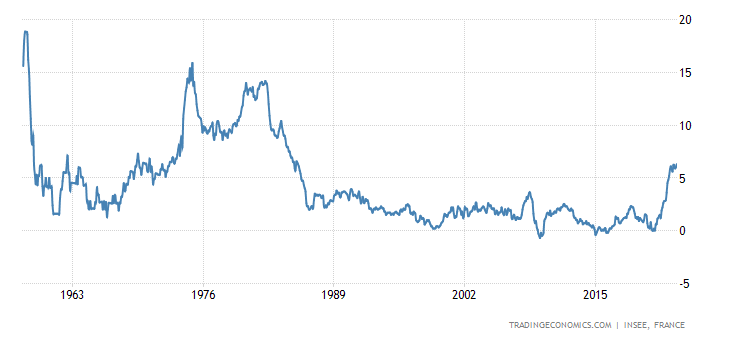
Pic. 24
“Net” (excluding highly volatile components of food and fuel) Eurozone CPI +5.6% per year – a record for 32 years of observations:
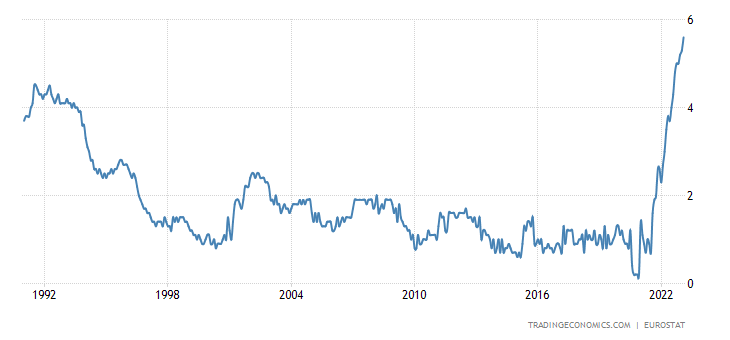
Pic. 25
Food in the region also experienced a record rise in price (+16.3% per year):
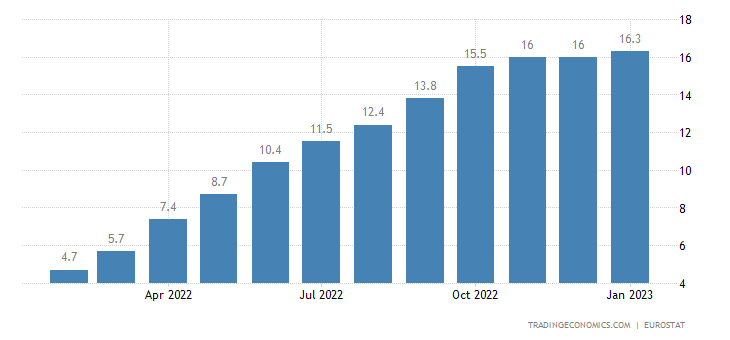
Pic. 26
The cost of food in New Zealand +12.0% per year – the highest since 1989:
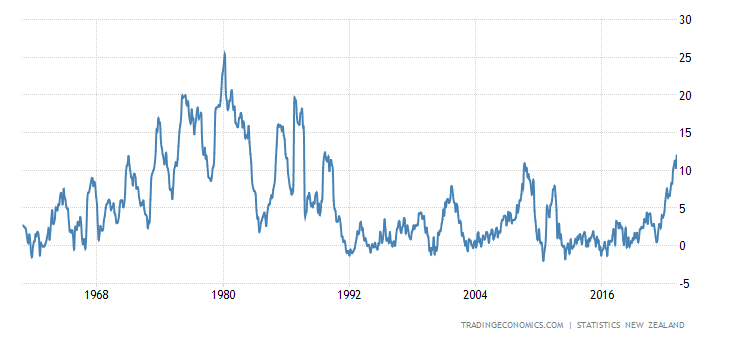
Pic. 27
US retail sales -0.4% per month – 3rd negative in the last 4 months:
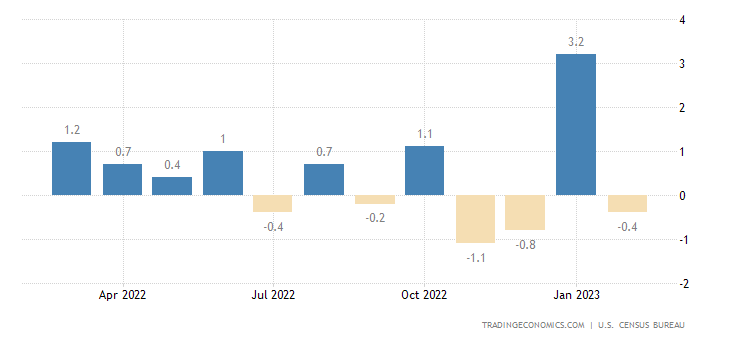
Pic. 28
Salaries and bonuses in Britain, adjusted for official inflation -3.2% per year – the bottom since 2009:
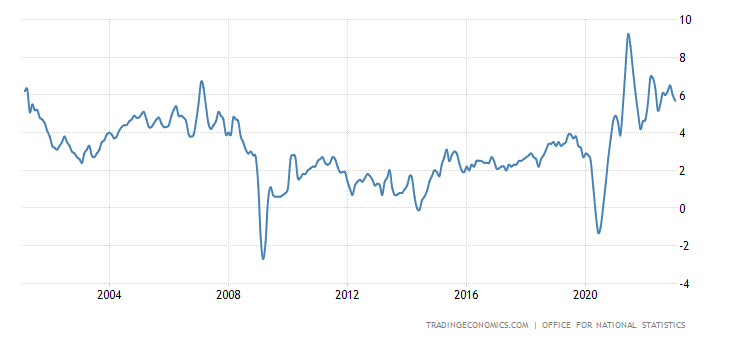
Pic. 29
The ECB raised the rate by 0.5% to 3.5%, ready to support banks in case of need. The Central Bank of Argentina raised the percentage by 3% to 78%. The Central Bank of Indonesia left the monetary policy the same.
Main conclusions. For starters, here is a chart that we cited back in “The Decline of the Dollar Empire…” 20 years ago:
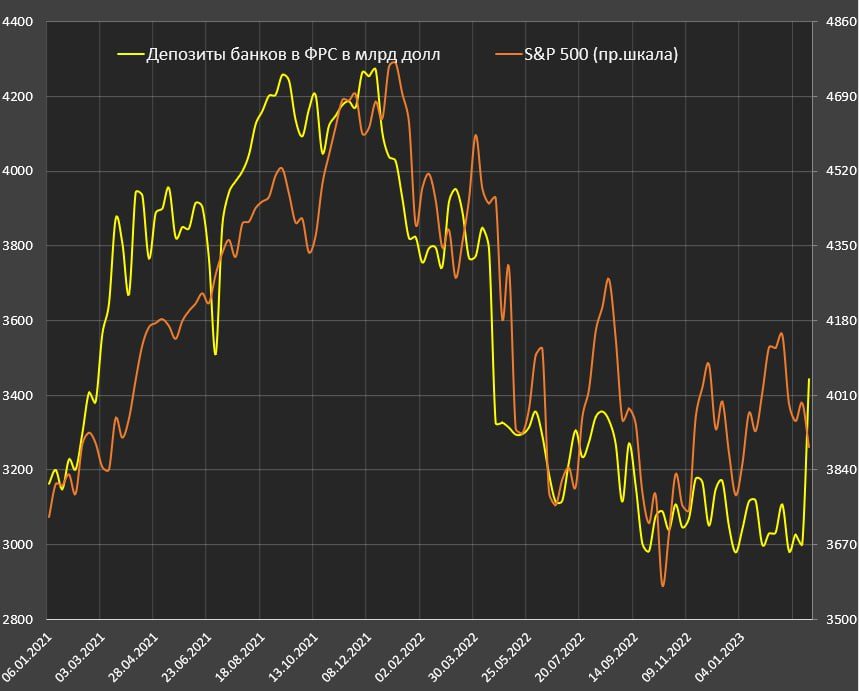
Then, however, there was a different time interval, but the meaning has not changed: they gave the banks money, stock indices rose. Well, as everyone understands, the higher it rises, the harder it falls. The second conclusion is also obvious: inflation will rise. For this reason, it is not interesting to discuss inflation in the US (it practically did not change in February), it will actively grow in the coming months. There is actually one interesting point.
The fact is that inflation has fallen sharply for a full range of industrial goods:
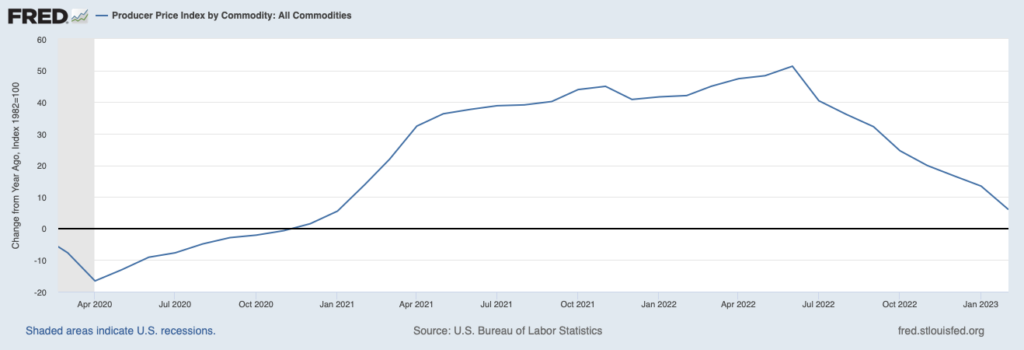
And there is an opinion that there may already be degradation mechanisms associated with the decline of industry, aggregate demand and aggregate sales. A very interesting topic, to which we will return.
In fact, based on the results of the past working week, we can confidently say that the US financial elite (well, in the EU too, but there is no industrial opposition there) took a powerful revenge for attempts to limit it through tightening monetary policy. Taking into account the growth of speculative assets, we can safely say that any industrialization programs now, neither in the United States nor on the scale of the AUCUS, will pass. Actually, we wrote a lot about it, but today it has become clear to everyone, industrialization requires the destruction of the Bretton Woods system and the national and world elites associated with it (transnational bankers).
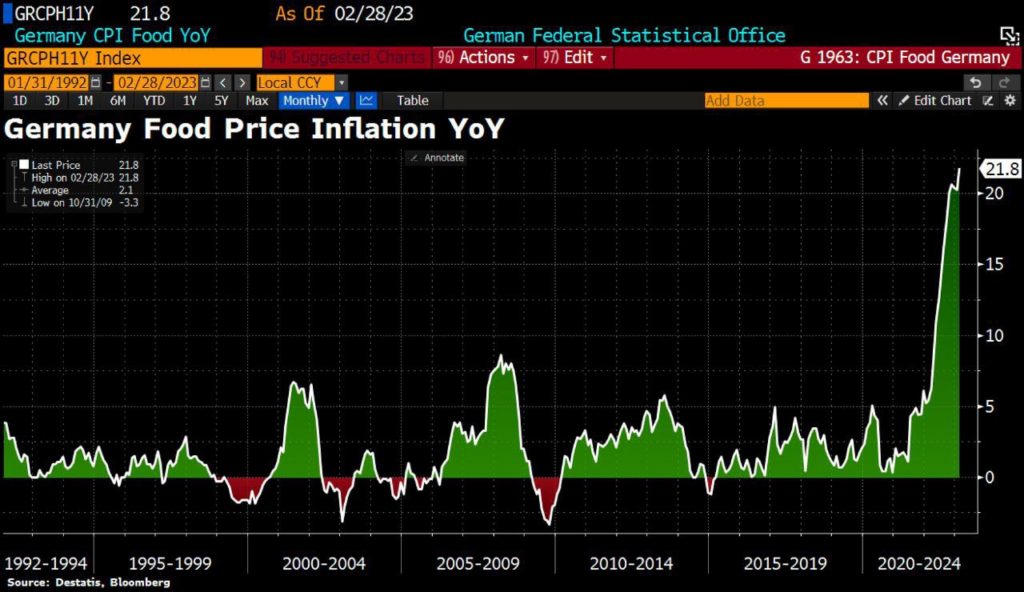
At the same time, the structural crisis continues in all its glory. Here, for example, is a graph of the rise in food prices in Germany:
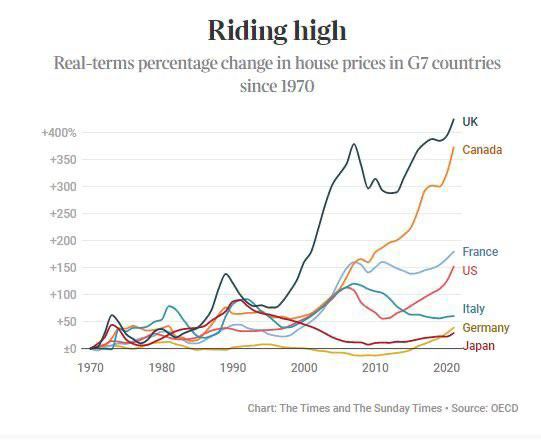
And here is the rise in prices for residential real estate in the main capitalist countries:
At the same time, supporting the global dollar system costs the United States (and its closest allies) a very high price, and this price is a decrease in their share in the global economy:
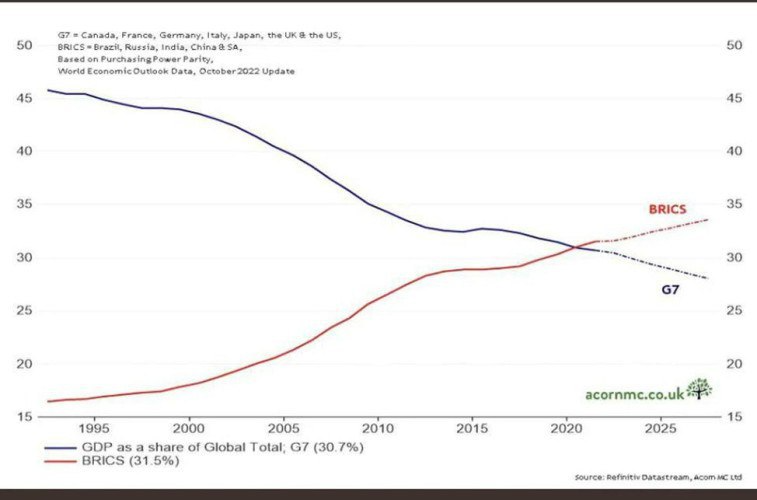
Actually, if we consider the United States alone, the picture becomes quite sad (14-18%). But the general essence does not change: it is not yet possible to break the total dominance of the financial sector, and it has only one tool, flooding problems with issuance dollars. With all the ensuing consequences.
Well, our readers can calmly look to the future, because they have the opportunity to learn about the real problems of the world economy before others. Which allows them to enjoy the weekend that has begun and the next working week!