
September 2-8, 2023
Big news. The main news of the week was a sharp drop in industrial orders in Germany by -11.7% per month (for July). Apart from the failure of 2020, which says little about the state of the economy as a whole, since it is associated with the Covid quarantine, this is the worst dynamics since 1976:
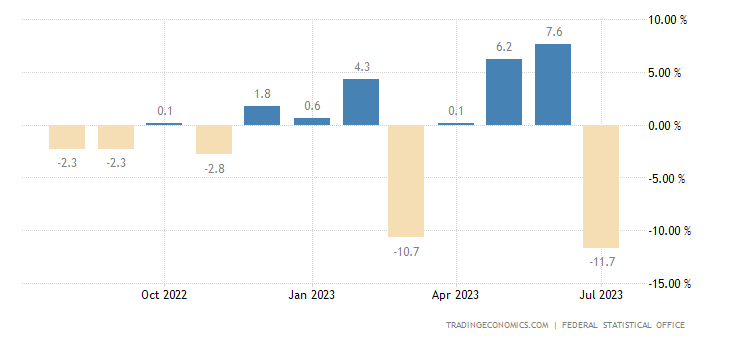
Pic. 1
The optimism associated with the fact that everything seemed to be fine in the previous months is not correct in this case. Indeed, the indicator of industrial orders is very volatile, but the annual value of industrial production (see the next section of the Review) is still in the decline zone. Well, the most important thing.
Let us remember that 1976 is the middle of the previous, 3rd PEC crisis (see M. Khazin, “Memories of the Future. Ideas of Modern Economics”). And the July collapse suggests that the crisis in European industry has already approached the indicators of a developed PEC crisis. Of course, theoretically, perhaps the situation will improve by the end of the year, but there are no economic grounds for this. But the political problems of the European economy have not gone away: the United States will not weaken its pressure regarding the transfer of industry from Western Europe to its territory.
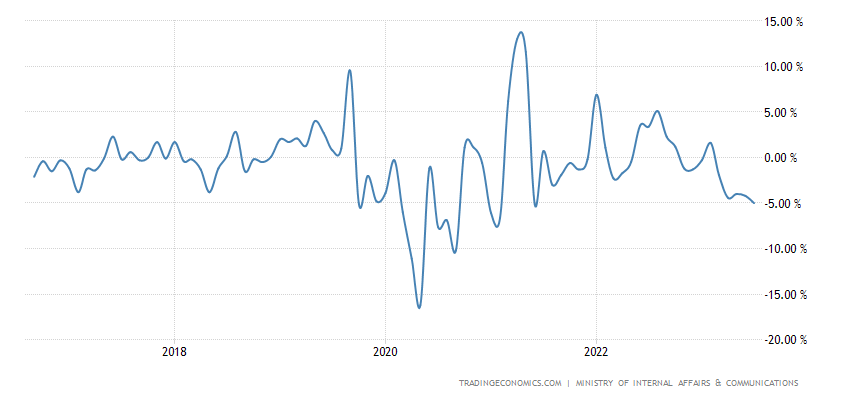
Macroeconomics. Let’s start with production in Germany, which amounted to -0.8% per month – the 3rd minus in a row:
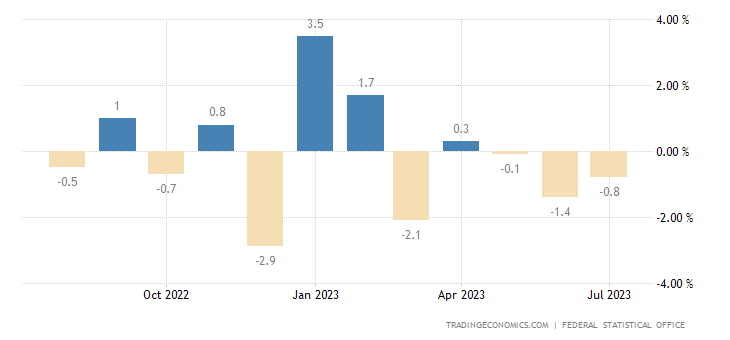
Pic. 2
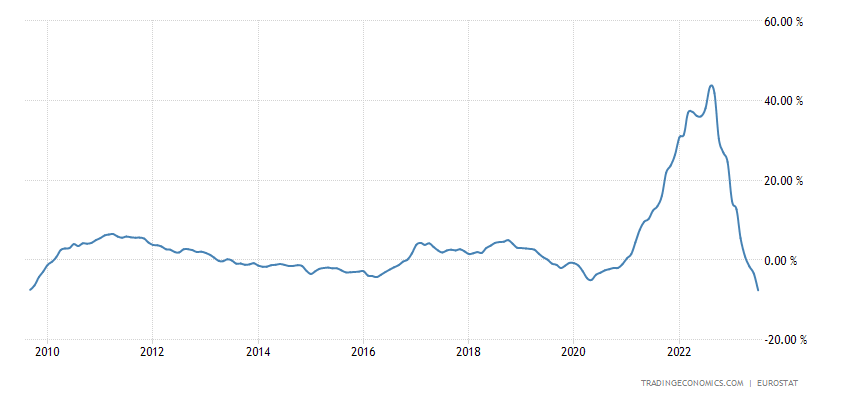
And annual production is in the red for two months:
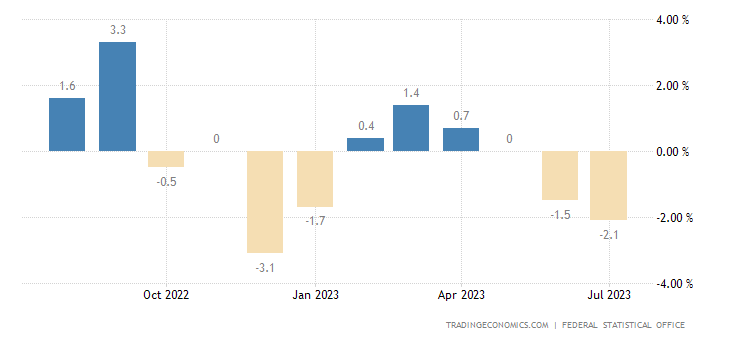
Pic. 3
Argentina’s industrial output -3.9% per year – the worst dynamics in 3 years:
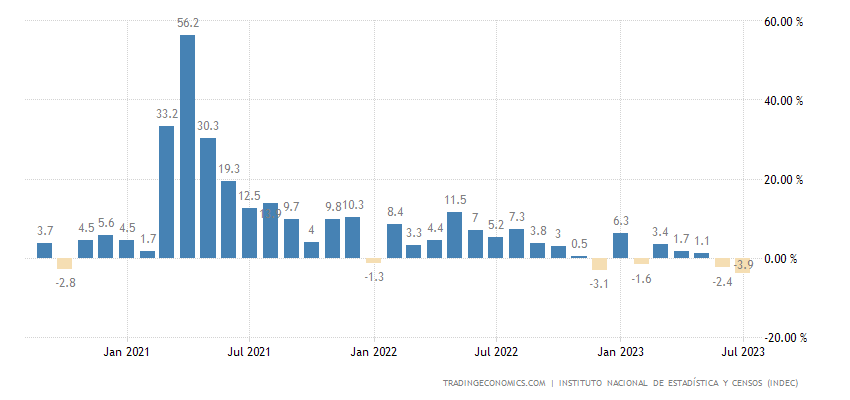
Pic. 4
A similar situation in Sweden (-4.0% per year – also a 3-year minimum):
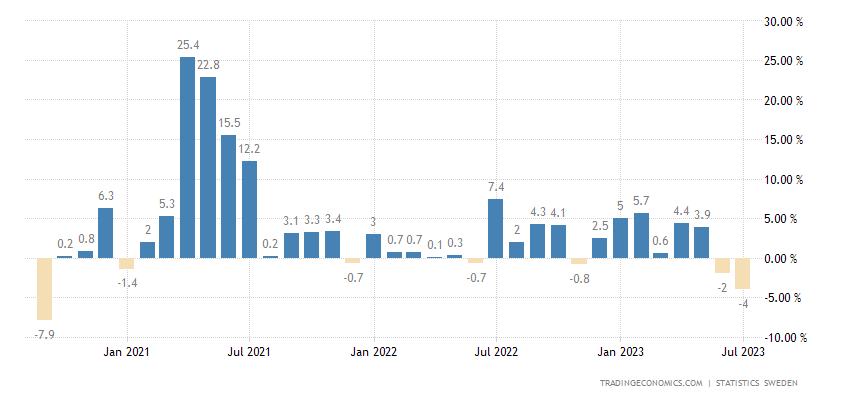
Pic. 5
PMI (expert index of industry condition; its value below 50 means stagnation and decline) of the Chinese service sector is the weakest in 8 months, but is still in the growth zone (51.8):
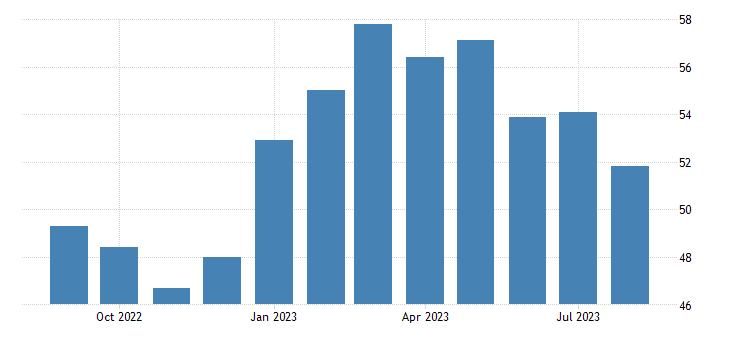
Pic. 6
In the eurozone, 47.9 is the minimum since January 2021, and before that – since 2013:
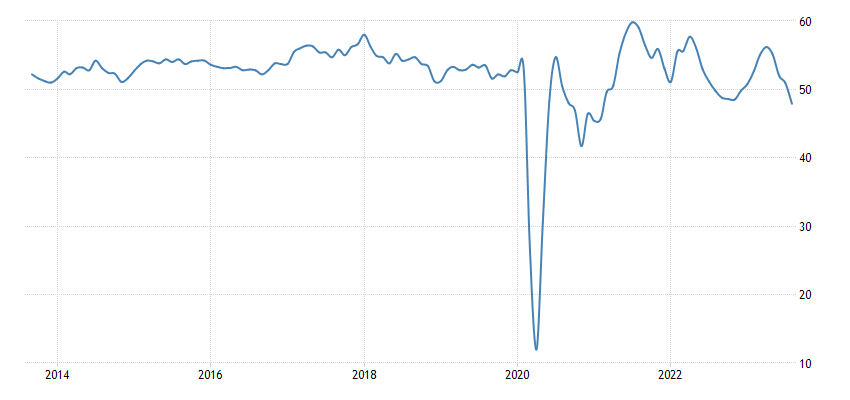
Pic. 7
Japan’s leading indicators are at their lowest in 3 years:
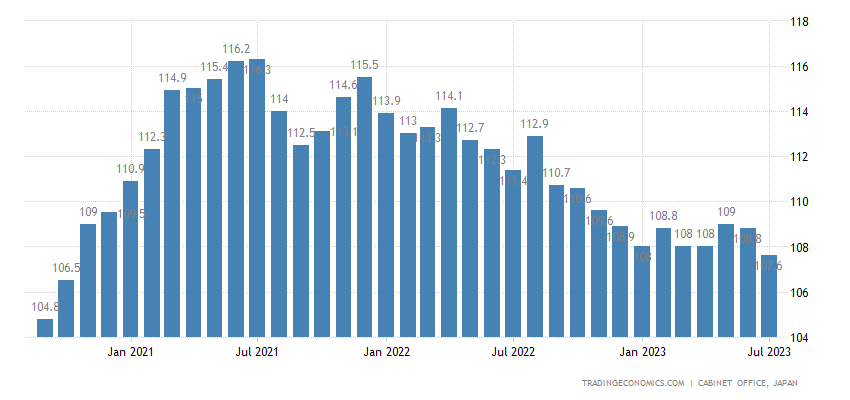
Pic. 8
Australian corporate profits -13.1% per quarter – an anti-record for 30 years of observation:
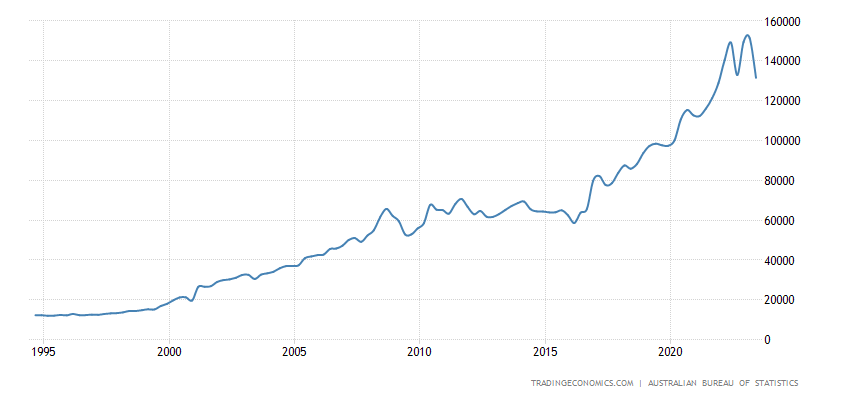
Pic. 9
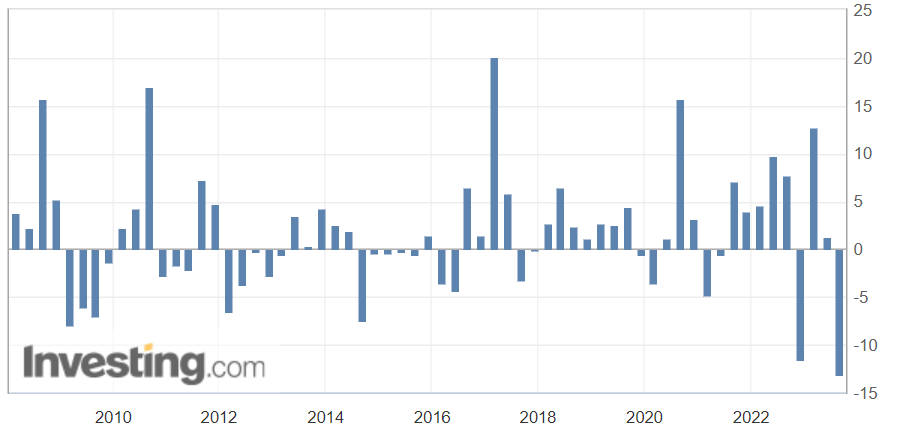
Pic. 10
Building permits in Australia confirmed as -10.6% per year – 22nd negative in a row:
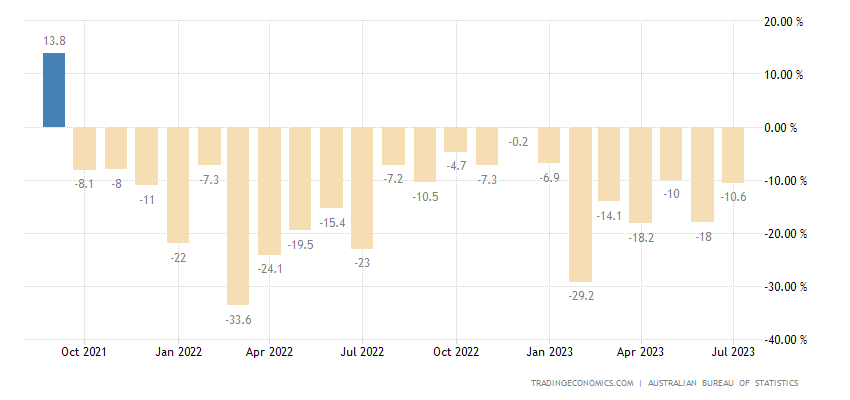
Pic. 11
The indicator is at the levels of 2008-13:
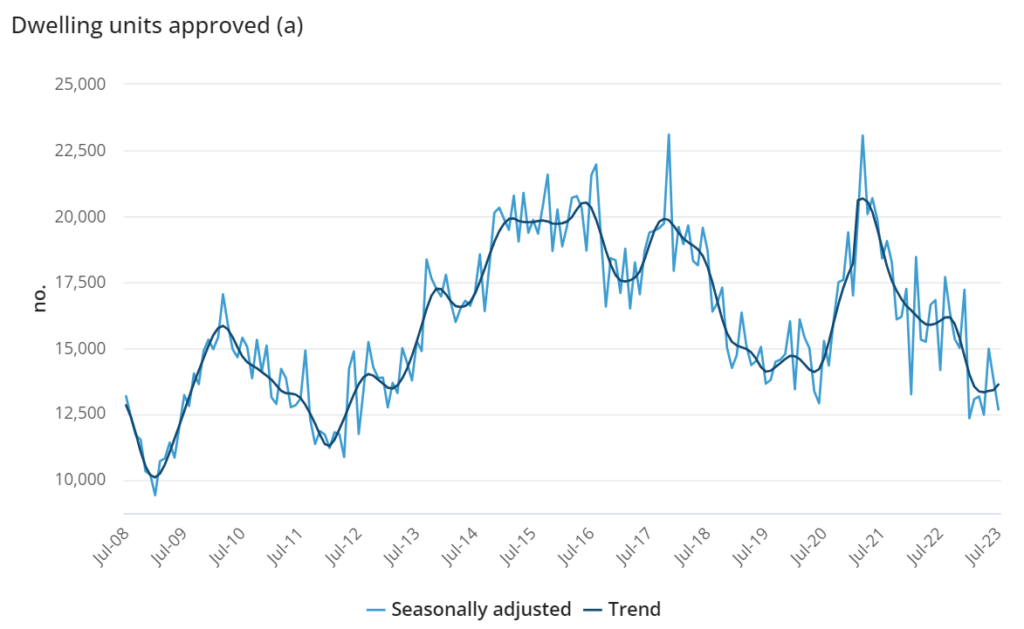
Pic. 12
Applications for mortgages in the US have been minimal since 1996:
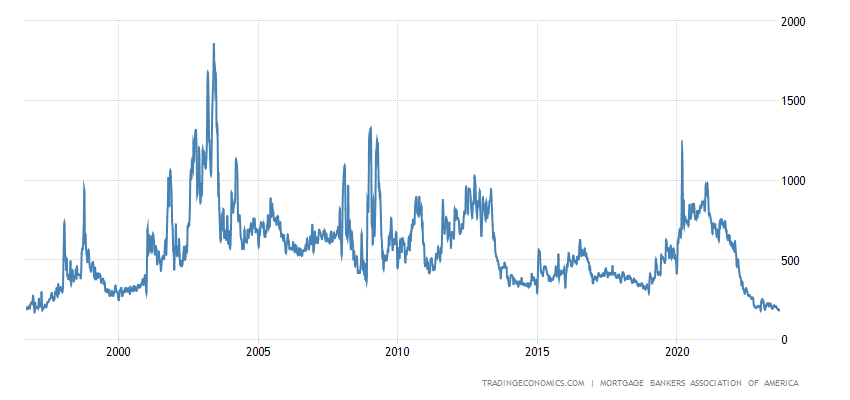
Pic. 13
Mainly thanks to applications for the purchase of housing (not refinancing) – they have had a bottom since 1995:
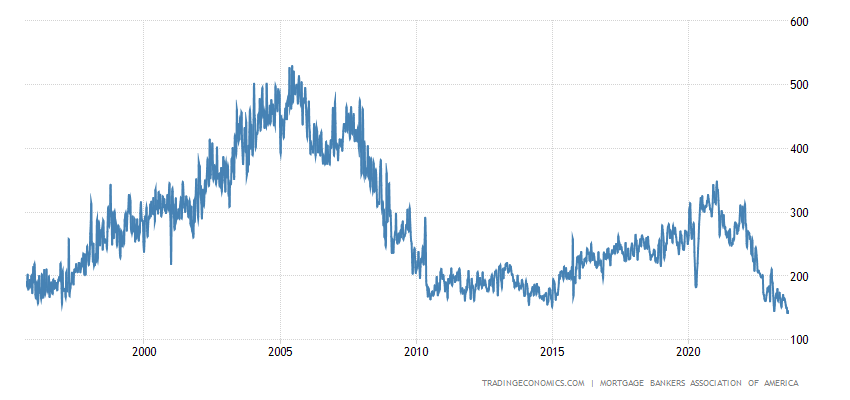
Pic. 14
The average 30-year mortgage rate in Britain has jumped to a 25-year high of 7.85%:
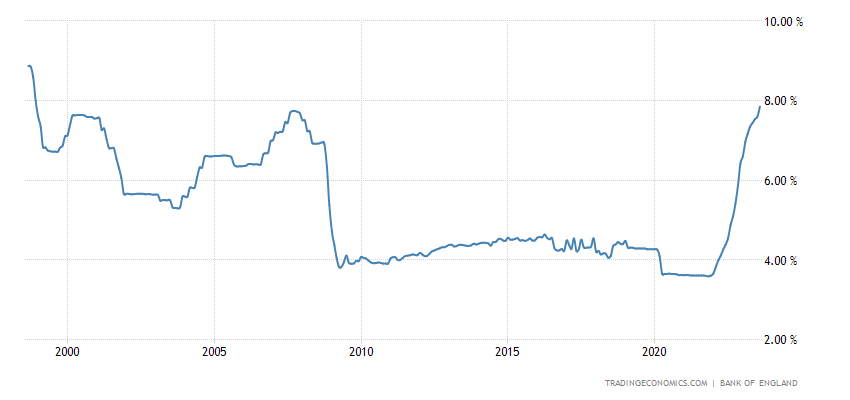
Pic. 15
House prices in Britain (Halifax review) -4.6% per year – minimum since 2009:
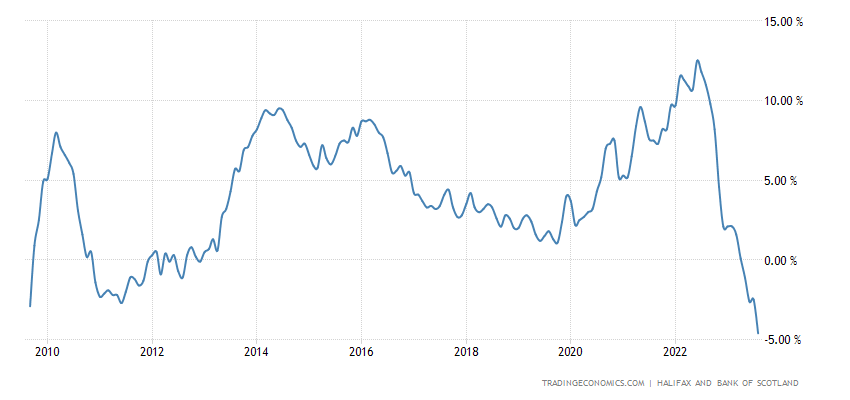
Pic. 16
Turkey’s CPI (consumer inflation index) continues to grow at an almost record pace – after +9.5% per month, another +9.1%:
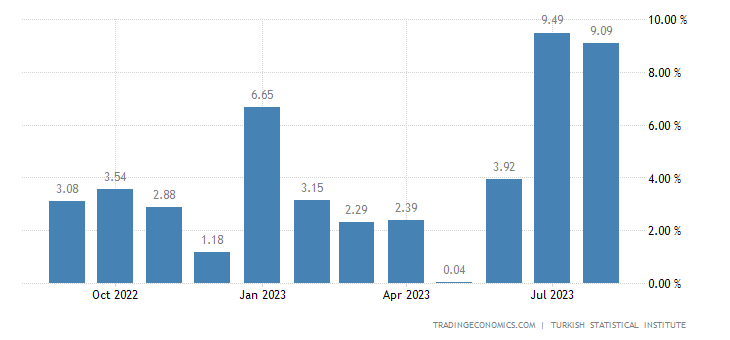
Pic. 17
In fact, Turkey’s economy is crumbling before our eyes.
PPI (industrial inflation index) of the eurozone -7.6% per year – it was lower only in 2009:
Pic. 18
This is about the state of industry – apparently, the 4th PEC crisis is already in full force even in a situation of supporting private demand, which did not exist in the 70s.
Household spending in Japan is -5.0% per year – without taking into account Covid-related failures, this is the minimum since the beginning of 2016:
Pic. 19
Eurozone retail sales -1.0% per year – 10th negative in a row:
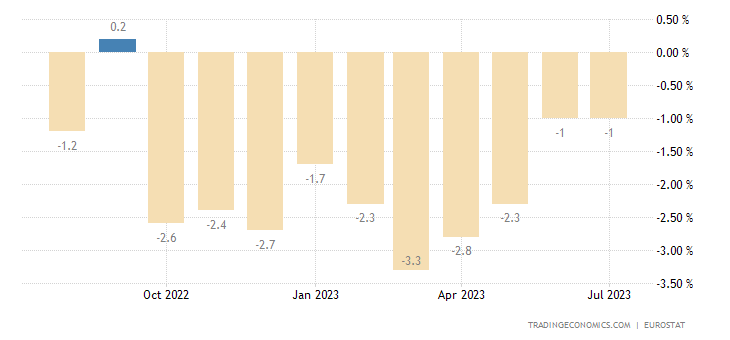
Pic. 20
The Central Bank of Australia left its monetary policy unchanged.
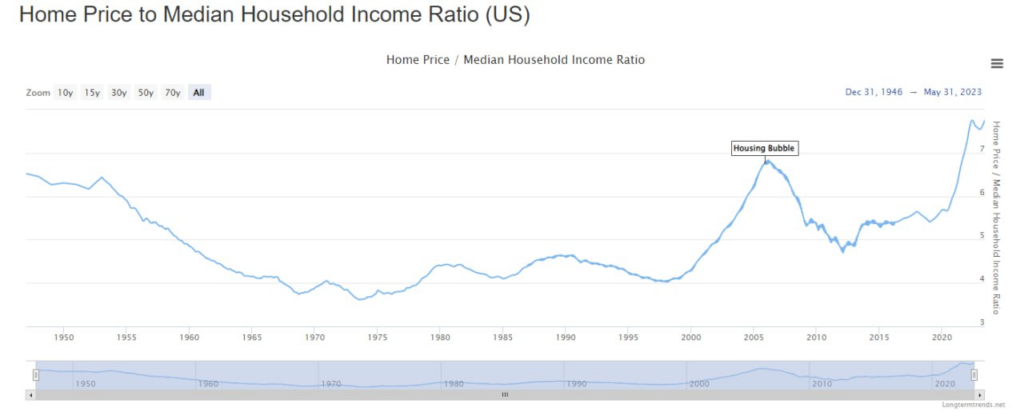
Main conclusions. As you can see, the real estate situation in the US is getting worse. This is natural if you look at the ratio of the average household’s annual income to the average house price (according to official estimates):
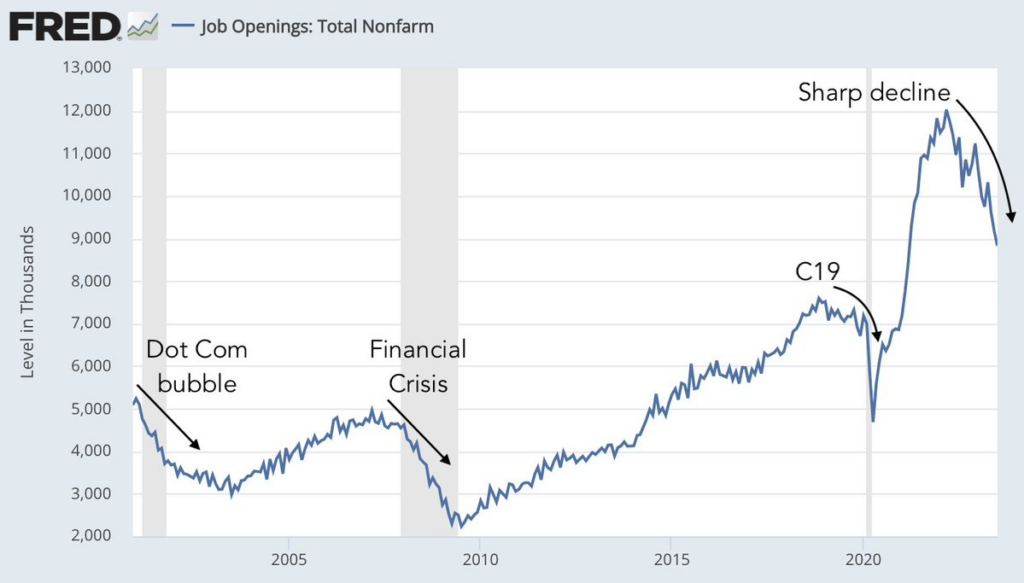
The job situation is clearly deteriorating:
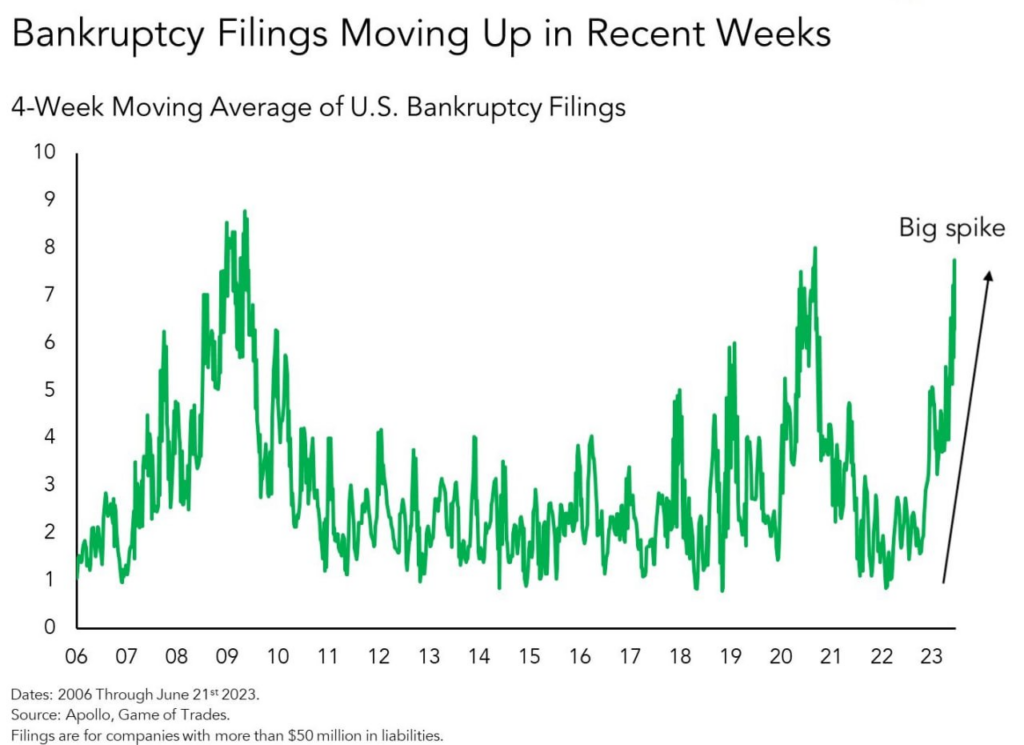
Well, things are not very good with bankruptcies:
Another interesting indicator is the net percentage of banks tightening standards for providing commercial and industrial loans to large and medium-sized firms in the market:
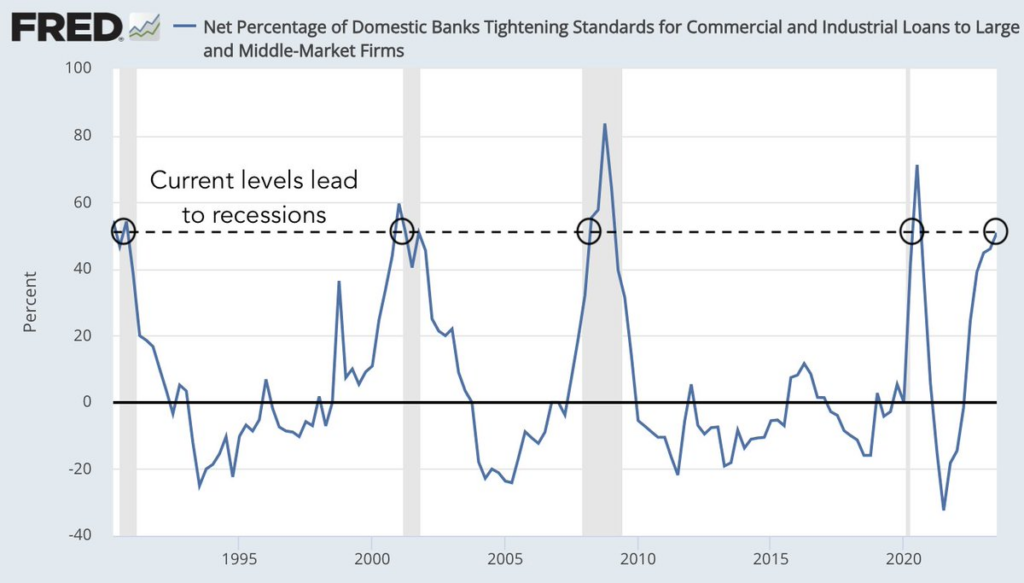
Liberal experts point out that when this indicator exceeds a certain critical value, a recession begins. The word “recession,” as we have noted more than once, has little relation to reality, but, as we see, the critical level has been reached.
This week the Federal Reserve’s so-called “Beige Book” was released, a report on the state of the US economy. If we take into account the natural desire to show that the situation is not so bad, the picture looks quite depressing:
- reports from most US counties showed modest economic growth in July and August;
- most counties reported that price increases have slowed;
- a rapid slowdown in price growth was observed in the manufacturing sector and the consumer goods sector (this is apparently synonymous with serious deflation, note by the Khazin Foundation);
- job growth across the country was subdued;
- in some Fed districts, consumers have exhausted their savings and gone into debt;
- in almost all districts, enterprises indicated expectations that wage growth will slow down significantly in the near future.
Let us note that all these points have long been noted in our reviews. In most cases, before (and sometimes long before) the US Federal Reserve admitted that problems even existed. So our readers can feel much more confident than their colleagues and competitors, which allows them to relax on weekends and look confidently into the future at work.