
Big news. The theoretical main news was to be a speech by Fed Chairman Powell before the House of Representatives of the US Congress. We will certainly discuss this development in the last section of the Review, but the most important development was a leak made by the Financial Times, which reported that it was listed by its US presidential administrations in order of choice of large commodity traders to trade Russian oil.
Of course, it was only about oil that complies with price restrictions, but the EU already some time ago, in fact, allowed Russian oil to be mixed and pumped without hindrance. In combination with the FT report, this means that the attempt to move to regulated prices in the oil market ended in failure.
This is connected, of course, with the threat of a reduction in supplies from Russia, but this is not the main thing. The fact that the Bretton Woods system is breathing wildly, in general, has become clear to almost everyone. This system was built on free markets with the control of the elite of the “Western” global project (international bankers) over the issue of the dollar and credit. An attempt to regulate Russian oil prices is a completely different conceptual model for controlling the world economic situation, built on completely different principles, in particular, the rejection of free markets.
The failure of this operation means that no controlled transition from B.-V. there will be no model to some other, since this other model is not observed. The industrialization of AUCUS, which we have already written about many times, is, in fact, the rejection of global control over the world economy, AUCUS itself is just a dollar currency zone, one of 4-5 more or equal zones into which the world economy will fall apart. And it is precisely from such a development of events, apparently, that one should proceed.
Of course, this approach corresponds to our forecasts (which date back to the early works of O. Grigoriev, A. Kobyakov, M. Khazin, etc.), but theoretical reasoning is one thing, it is quite another when they are confirmed in practice. In this regard, we look more confidently into the future and can confidently make forecasts for the future based on objective macroeconomic data.
Last minute addition. At the very end of the working week, when it was already night in Moscow, information came about the bankruptcy of far from the smallest bank in the US, Silicon Valley Bank. Since there was practically no time to study the situation, we quote one of the best experts in US statistics, Pavel Ryabov, Spydell.
“This is the largest bankruptcy in the US since the collapse of Lehman Brothers on September 15, 2008, which set off a devastating chain reaction. The collapse of SVB followed almost simultaneously after the bankruptcy of Silvergate Capital One. The Federal Deposit Insurance Corporation (FDIC) has been appointed SVB’s manager and all business operations have been outsourced. On March 13, the FDIC will pay out the insured deposits, and later begin liquidation of the bank’s assets and payouts as part of the proportionate distribution of the certificate to the remaining uninsured investors. What is that? The main specialization of the bank was the provision of financial services to technology start-ups with a clear focus on venture capital financing. According to reports at the end of last year, the bank had about 209 billion in debt assets, and the source of funding was client deposits for 175 billion. There is no clarity about the volume of insured deposits – they are, apparently, several times less (about 7%).
But there is no point in speculating until the information from the FDIC appears. What is 200 billion assets for the US? Among commercial banks, SBV ranked 16th in terms of assets according to the Fed. If we isolate the investment banking divisions, highlighting only the assets of banks within the dollar system, we get the following: Capital One Financial Corporation – 452 billion, Goldman Sachs – 439 billion, The Bank of New York Mellon – 236 billion, Morgan Stanley – 209 billion, State Street Corporation – 209 billion, i.e. SVB at the level of monsters like Morgan Stanley, State Street and Bank of NY Mellon! American divisions in the United States of international banks: HSBC Bank USA – 231 billion, UBS – 201 billion, Barclays – 179 billion, Santander Bank – 166 billion, BNP Paribas – 143 billion, Deutsche Bank – 106 billion, Credit Suisse – 80 billion. it can be seen that SVB is second only to HSBC.
If we combine global assets, taking into account the investment banking division, then by assets the largest American financial institutions: JPMorgan Chase & Co – 3.66 trillion, Bank of America Corporation – 3.05 trillion, Citigroup Inc – 2.11 trillion, Wells Fargo & Company – 1.88 trillion, Goldman Sachs – 1.44 trillion, Morgan Stanley – 1.18 trillion, U.S. Bancorp – 0.67 trillion. Such a lengthy comparison is necessary to estimate the actual size of the SVB.
So what happened? SVB has had over $120 billion of investments in securities, which are almost entirely allocated in debt securities. Over 85% in the structure of investments were long-term bonds with a clear bias towards mortgage bonds in the MBS segment (58 billion). The investment portfolio of SVB was 54%, which is the absolute maximum among American banks. Closest competitor State Street with 42% In March last year, the Fed began a cycle of tightening monetary policy, by October the rates in the debt market were prohibitively high, and then the SVB started to have problems. A significant part of the investment was in fixed rate bonds, which have collapsed in value. By the end of 2022, SVB’s unrealized loss had risen to $16bn, up from $500m in Q1 2022, all of which was due to higher rates. As a result, SVB began to cut losses by shifting to short-term treasuries, variable coupon bonds, increasing hedging in the derivatives market. It did not help, because the bank’s capital was 16.2 billion as of December 2022.
In February 2023, after another surge in rates, the balance turned negative (losses exceeded 20 billion) and everything fell apart. The collapse of the bank was accelerated after a run of investors who tried to pull deposits literally in the last 7-10 days after the appearance in the media of potential problems in the bank.
The final trigger was precisely the incursion of investors, and the problems were accumulated and structural, at least from the middle of 2022, but SVB skillfully masked these problems, drawing a fabulous profit report of $1.7 billion in 2022, having a hole of more than $20 billion, which is three times higher than bank earnings.
The collapse of the SVB is extremely important in terms of weighing the potential risks. What is special about this event? Masking problems and swiftness. Unlike Lehman Brothers, where the first problems in the media were shown in early 2008, and the severity of the problems was revealed in the summer of 2008, with SVB it was different. Outline potential problems among insiders were highlighted in October 2022 (then the shares collapsed by 30%), however, the bank’s management, in fact, falsified reality to such an extent that by the beginning of February, the shares recovered all losses with an accumulated growth of over 75% in just 1.5 months .
10 days before bankruptcy in early March 2023, at a gala concert in London, SVB was recognized as the best bank in the “Bank of the Year” nomination, and the SVB CEO cynically outraged common sense and investor confidence, instilling confidence that “the situation is under control and the problems are far-fetched.
At this very moment, SVB traders restructured a hole in the balance sheet of 20 billion, having a capital of 16 billion with a fake profit of 1.6 billion. Only after the bank was attacked by hedge funds and venture capital competitors (a week before bankruptcy) – investors began to run on with the withdrawal of deposits from SVB for 40 billion (over 20% of the deposit base).
Actually, it also undermined the bank. The crushing collapse of investments due to rising rates could still somehow be balanced through falsified reporting and the derivatives market, and there was nothing to cover up the raids. Problems SVB is an investment strategy for long-term fixed income bonds with inadequate diversification and lack of hedging. SVB, like many hedge funds, assumed that zero rates would be forever.
The second problem is the growth of rates due to the policy of the Fed and the incursions of investors in early March. SVB tried to raise several billion in emergency funding, but failed. However, this is not surprising, because. A similar scenario I described in detail last year. Here everything is just logical and predictable, at least for me. The vector was known, but there was no certainty who would be the first to go to the exit and at what time. Now we know that SVB went under demolition on March 10, 2023. Another surprise is swiftness. Not even two days, but a few hours. In fact, less than 30 hours passed from the first obvious and public problems to the liquidation procedure. This may rather indicate not the size of the hole in the balance sheet, but the coordinated policy of the Fed, the US Treasury and the FDIC together with the primary dealers.
It could not be without their approval and participation. This is practically a tracing-paper with Lehman Brothers, which collapsed with the direct participation of well-known people (I will not point fingers) in the Fed, the Treasury and the largest US banks.
The bankruptcy of Lehman was necessary (in the role of a sacred victim) to create a fully controlled trigger for the legitimization of the TARP program, which was unthinkable at that time, and the redemption of assets by the Fed. It was only later that they slumped and began to shoot liquidity in all directions in an unlimited amount on demand without a motivational component, but not in 2008 (then the world was different).
Then insiders earned record profits, which were never covered after 15 years (in terms of speed and volume), because. interested parties bought the market when everything was sold. It’s hard to say what their intention is now. I assume that SVB problems are not local, but global, i.e. other banks have similar gaps in their balance sheets, there will most likely be an adaptation of public opinion that it is time to put on the brakes in tightening monetary policy. The market was expecting plus 0.5 pp at the Fed meeting on March 22, but it seems that 0.25 pp will be the line. I expect the Fed to change its tone. The question remains, how far will they go and will the SVB case be promoted somehow? The collapse of the SVB itself will not have an impact on the financial system, unlike Lehman, because. SVB is quite isolated, but there is a secondary effect of infection of the system and undermining confidence, the inevitable redistribution of liquidity from small banks to large ones.
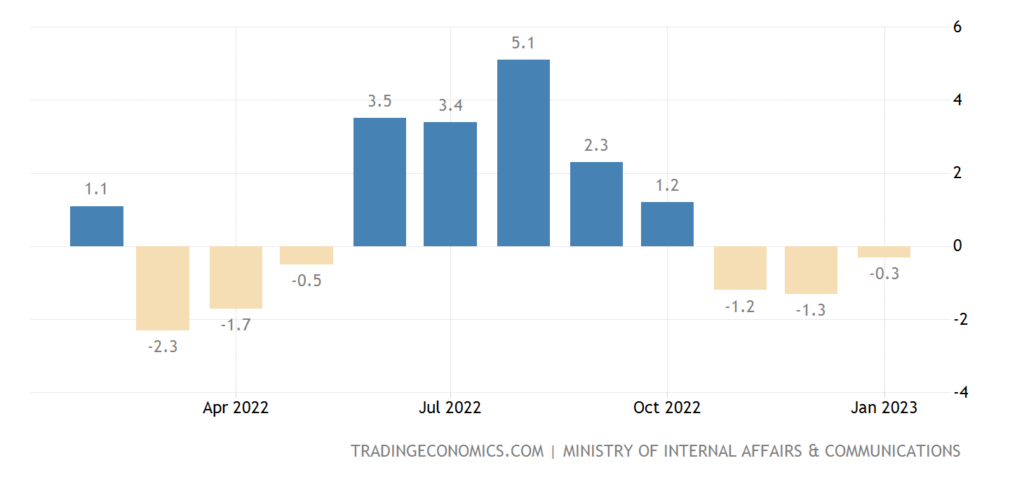
Macroeconomics. South Korea’s GDP -0.4% per quarter – 1st minus in 2.5 years:
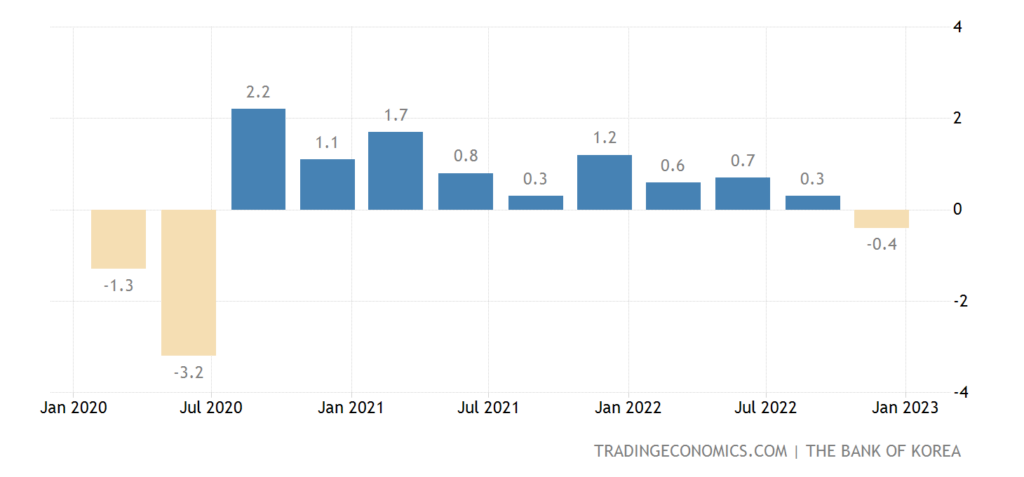
Pic. 1
South African GDP -1.3% per quarter:
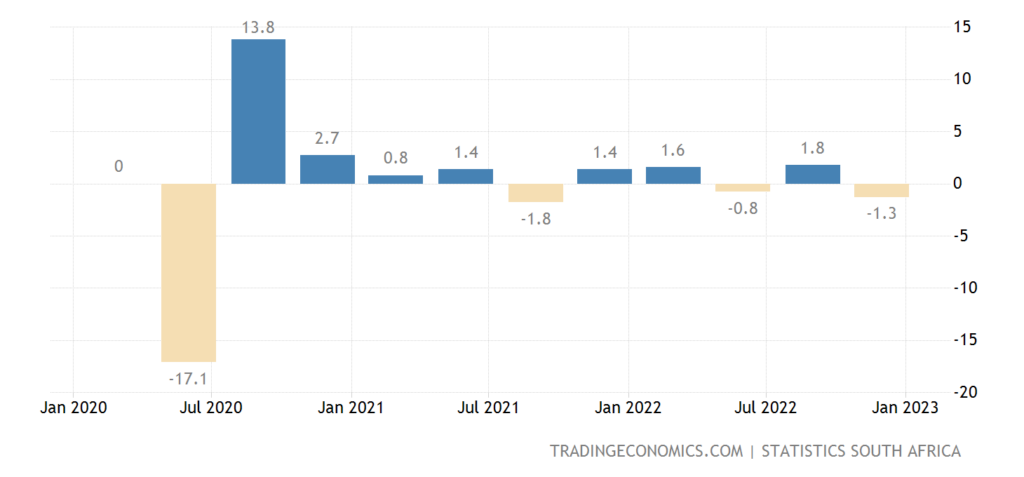
Pic. 2
Eurozone GDP 0.0% per quarter:
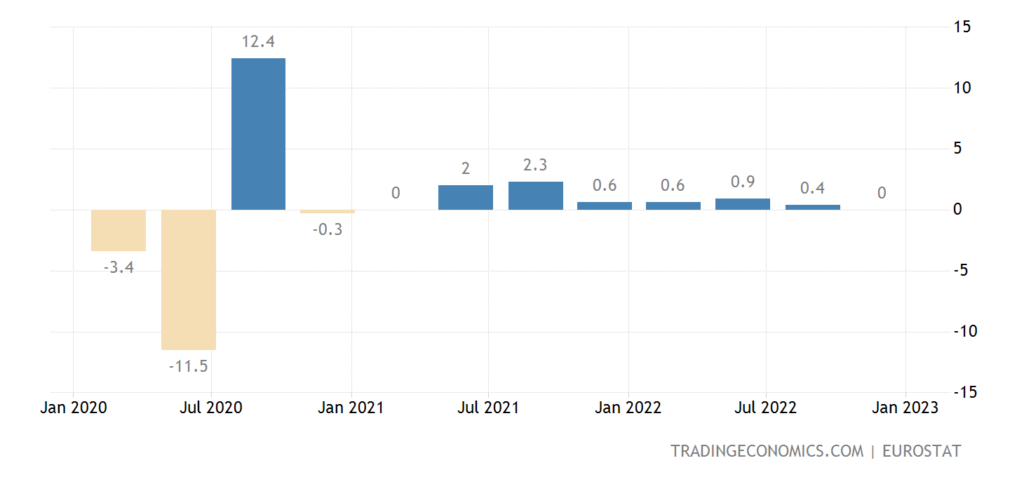
Pic. 3
As in Japan:
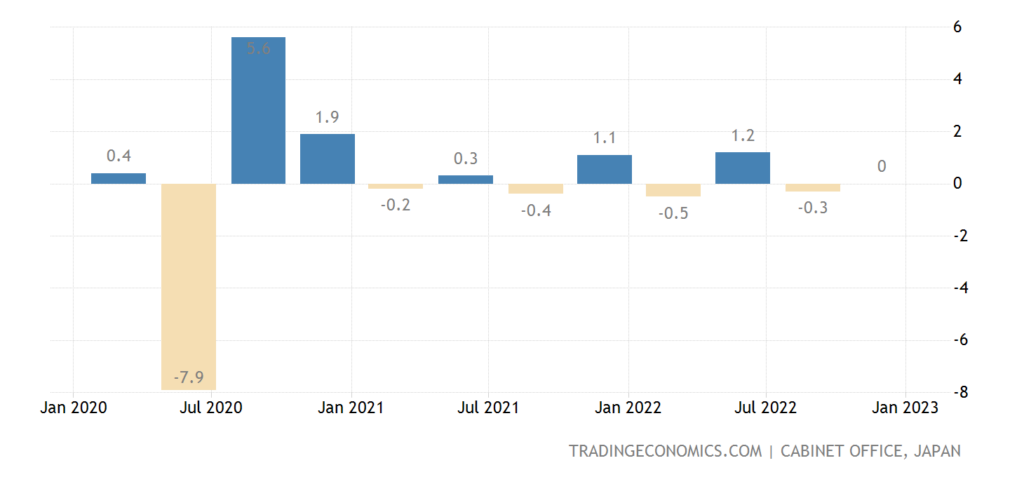
Pic. 4
UK GDP 0.0% per year:
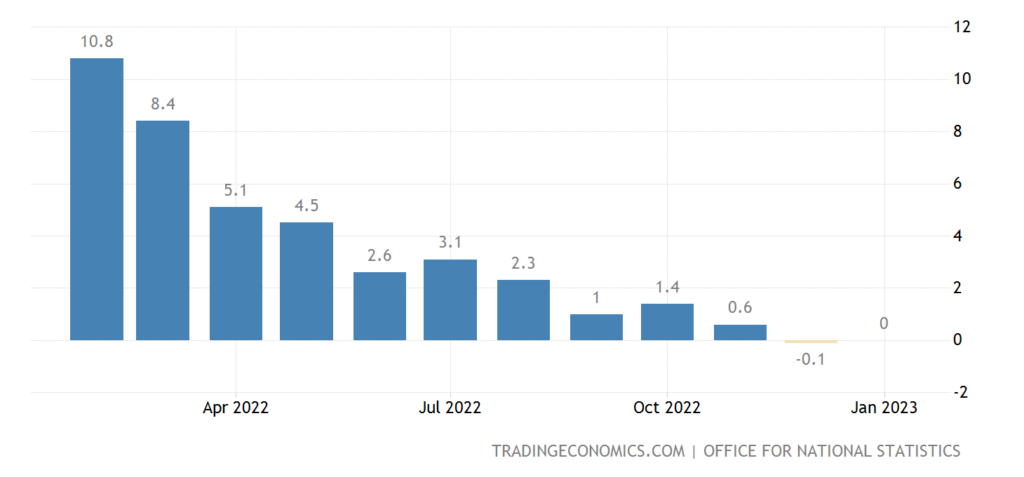
Pic. 5
Industrial output in Norway -6.6% per year – bottom in 26 months:
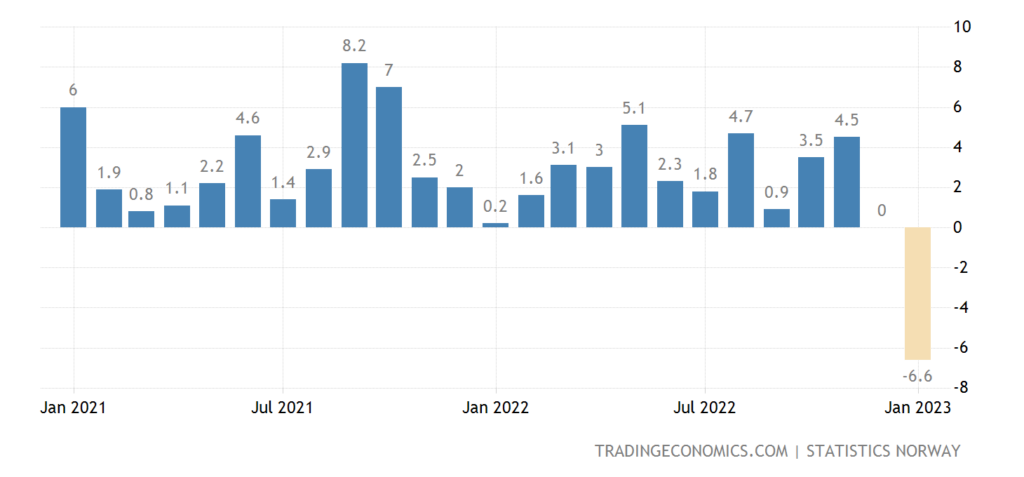
Pic. 6
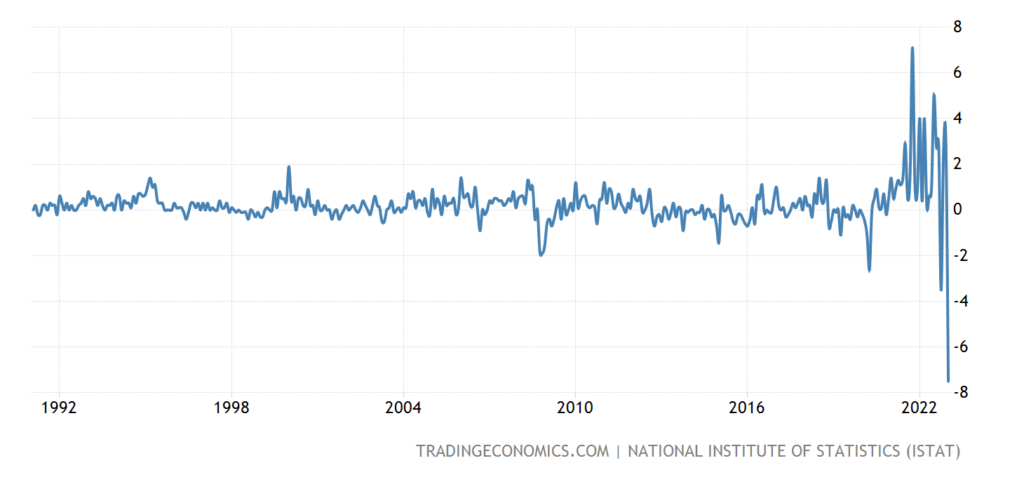
And -8.3% per month – the worst dynamics since 2001:
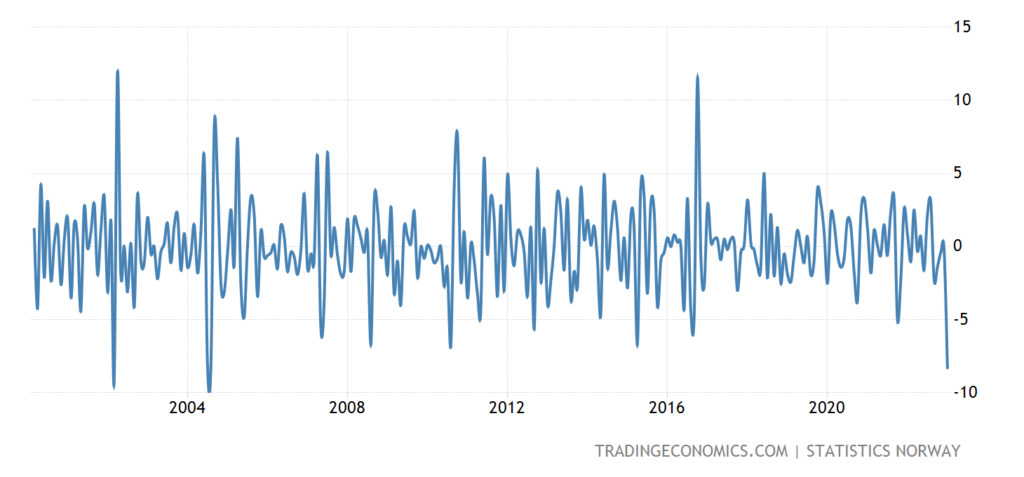
Pic. 7
Industrial production in Germany -1.6% per year – the 4th negative in a row and the 9th in the last 11 months:
Pic. 8
In Britain -4.3% per year – the 16th negative in a row:
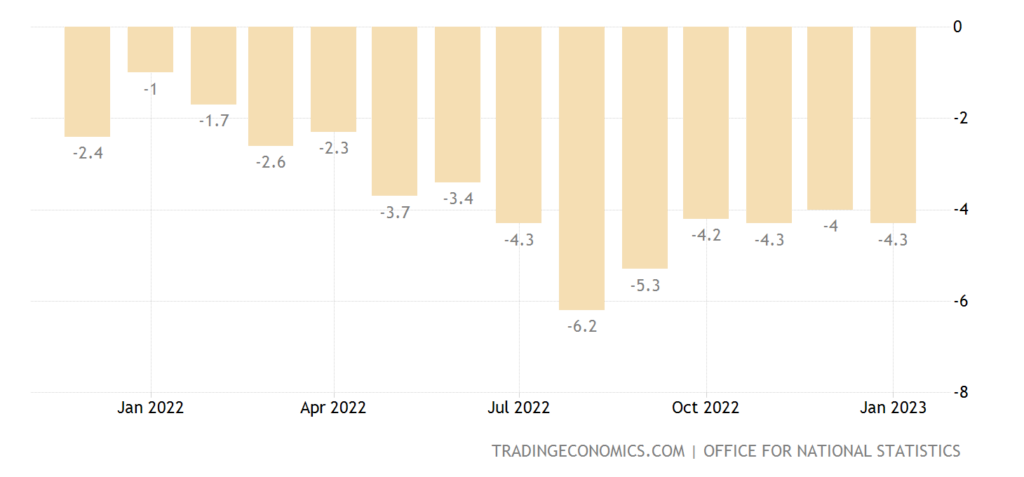
Pic. 9
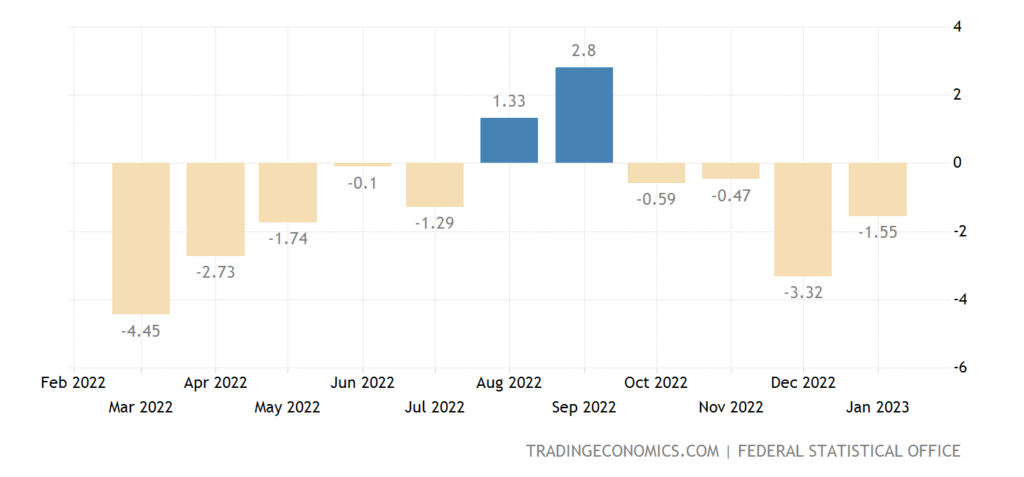
US industrial orders -1.6% per month – 2nd minus in the last 3 months:
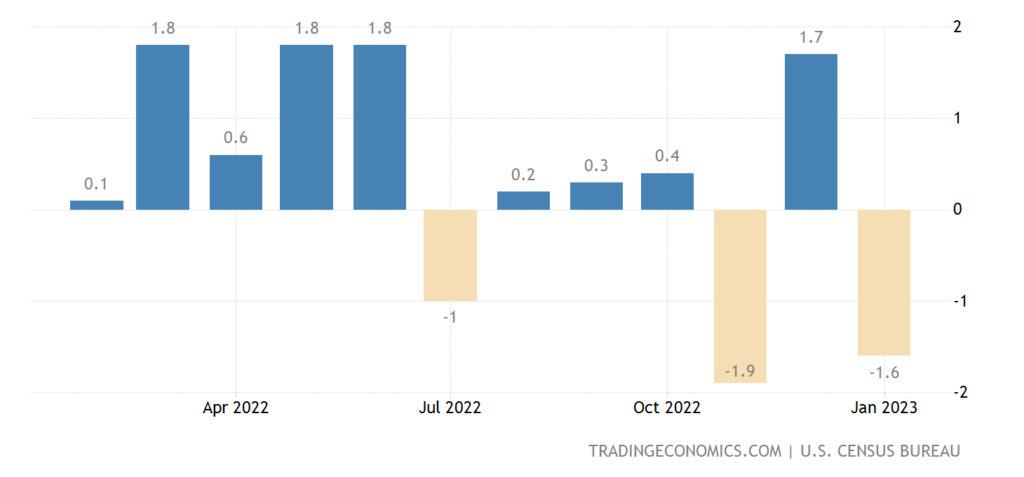
Pic. 10
In Germany -10.9% per year – the 11th negative in a row:
Pic. 11
Since the fall in orders outstrips the decline in production, it can be concluded that no improvement in the situation in Germany can occur in the coming months.
In Sweden -20.2% per month and -10.5% per year:
Pic. 12
Machine building orders in Japan -10.7% per year, including domestic -20.3%: Machine building orders in Japan -10.7% per year, including domestic -20.3%:
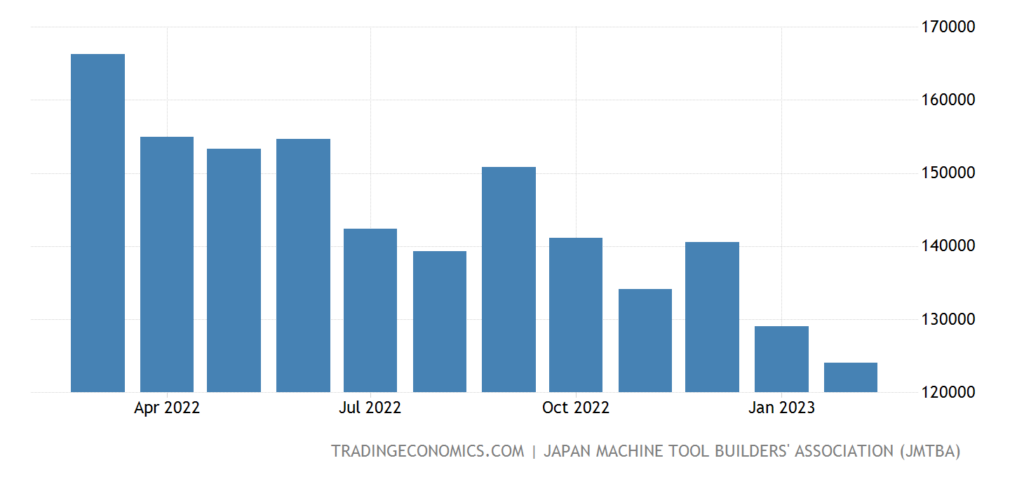
Pic. 13
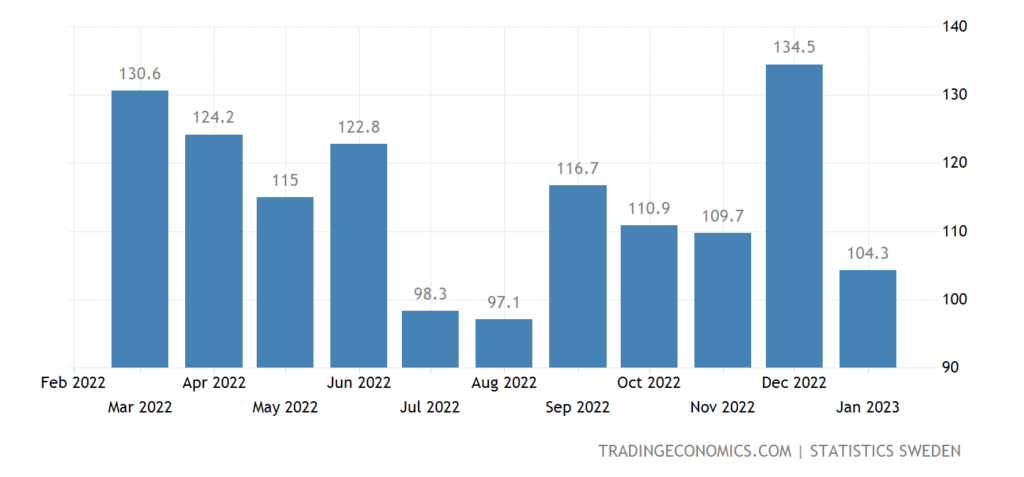
Not surprisingly, in this situation, Japan’s leading indicators are at their lowest in 26 months:
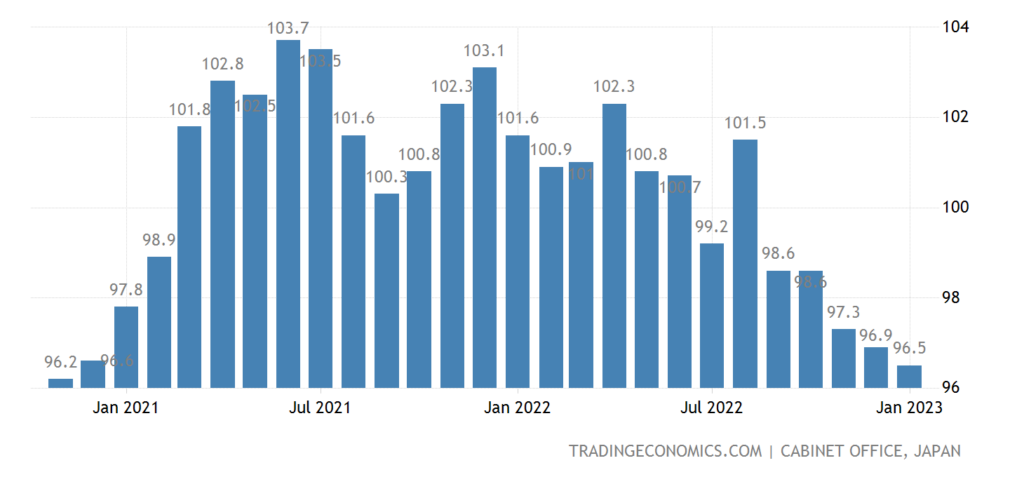
Pic. 14
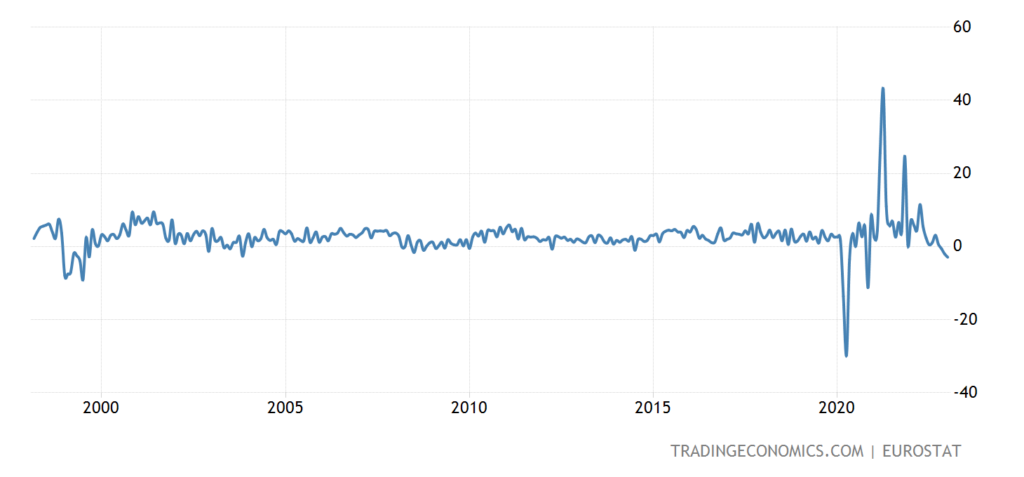
Exports and imports continue to decline in China:
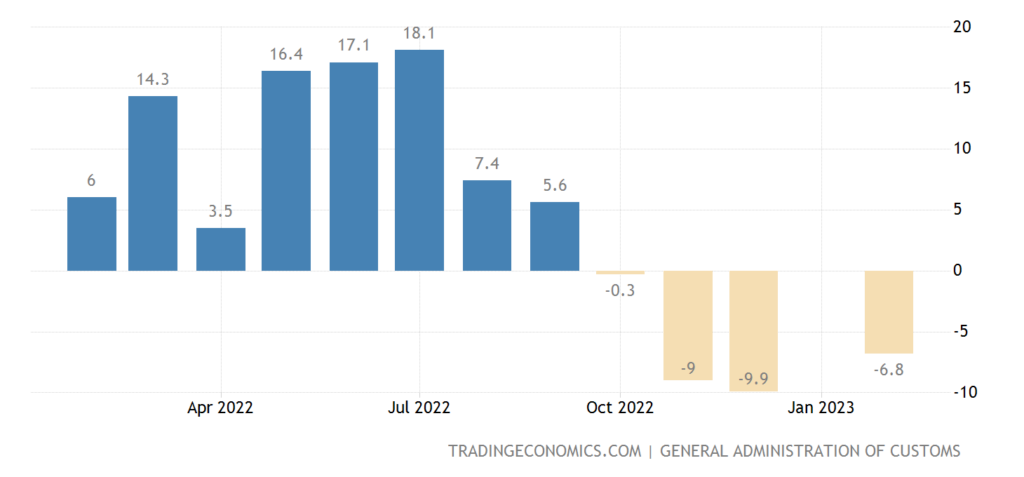
Pic. 15
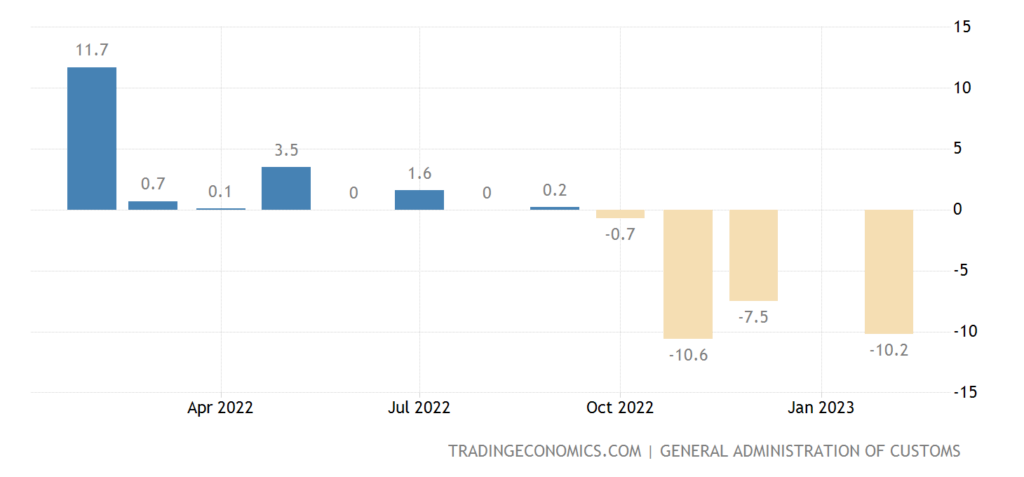
Pic. 16
Turkey has a record budget deficit:
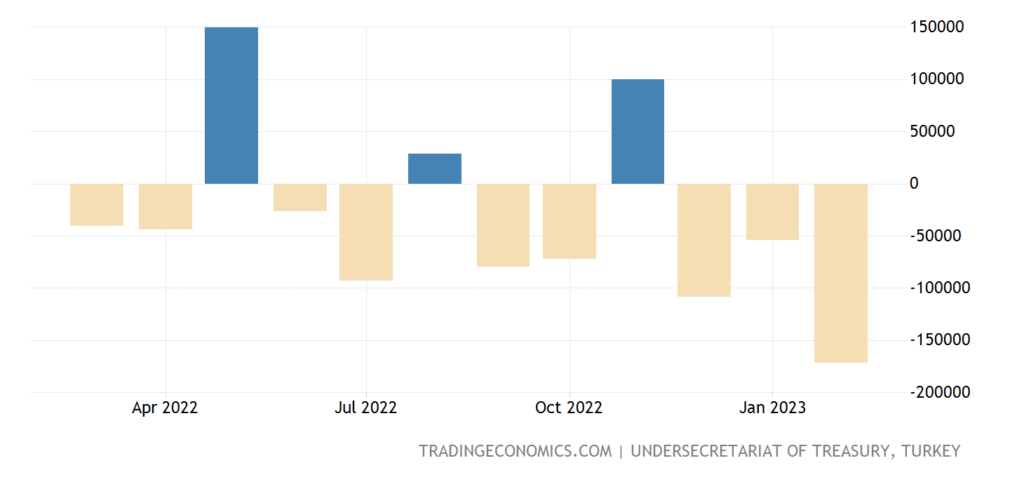
Pic. 17
And Japan has a record balance of payments deficit:
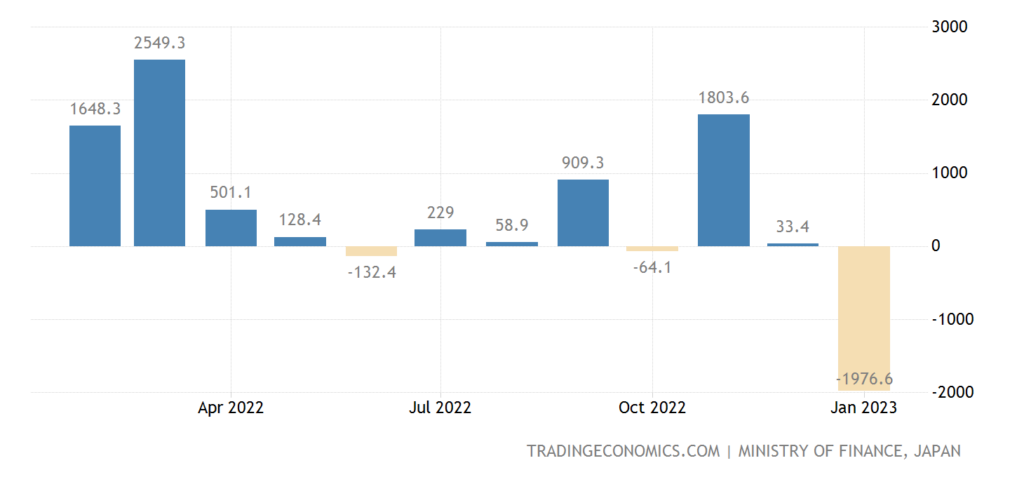
Pic. 18
Like South Korea:
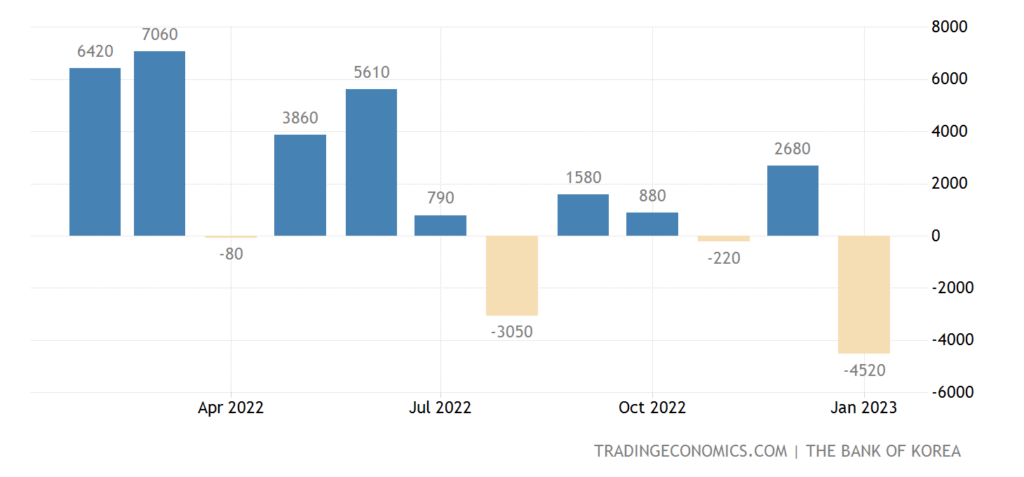
Pic. 19
On the way to the same achievement and South Africa:
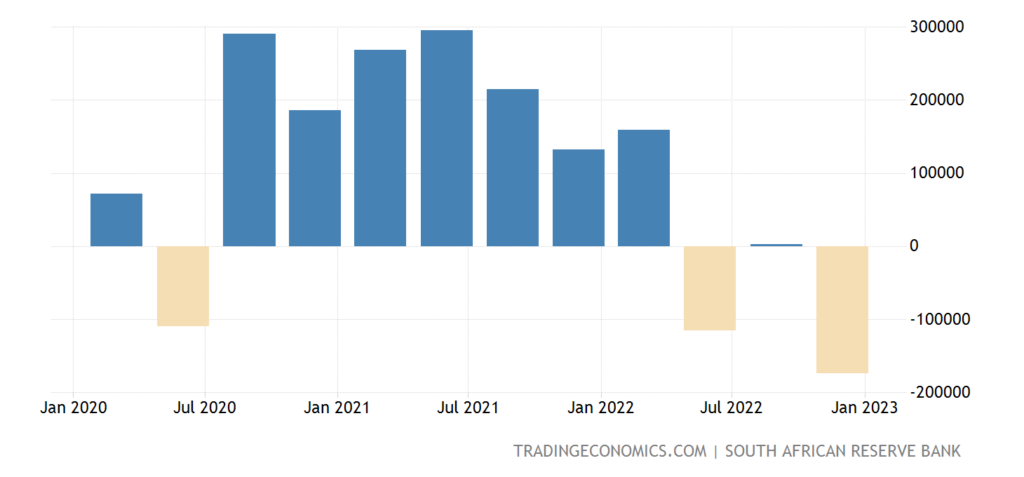
Pic. 20
I remind you that the first three countries are the recent leaders (along with Germany) of world exports. Apparently, their models will come to seriously change.
Building permits in Australia -27.6% per month – an anti-record for 40 years of observations:
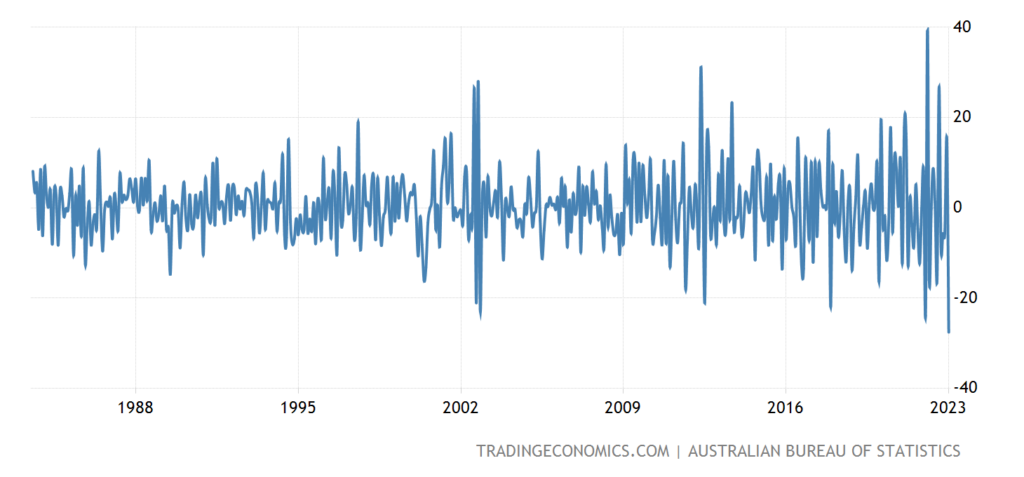
Pic. 21
Mortgage rates in Britain are the highest in 15 years (7.02%):
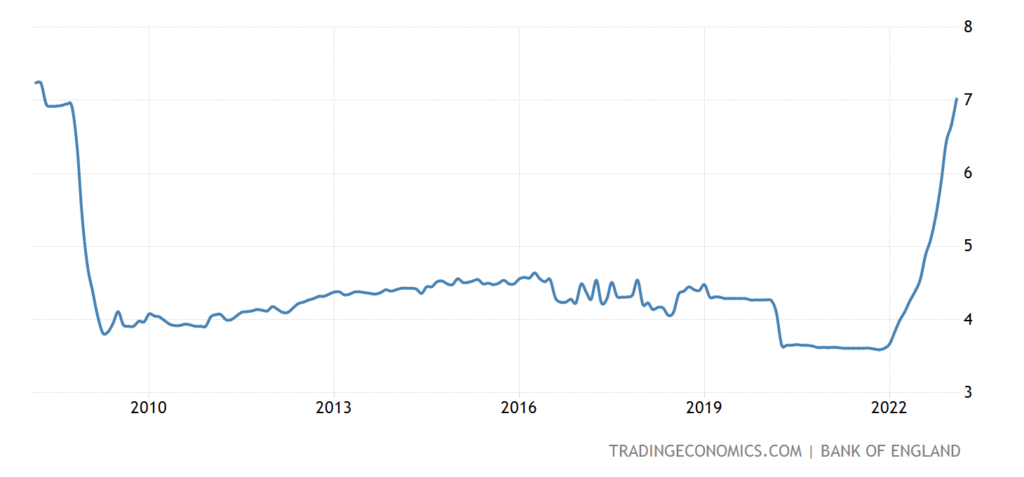
Pic. 22
Why the balance of housing prices in it (-48) is the worst in 14 years:
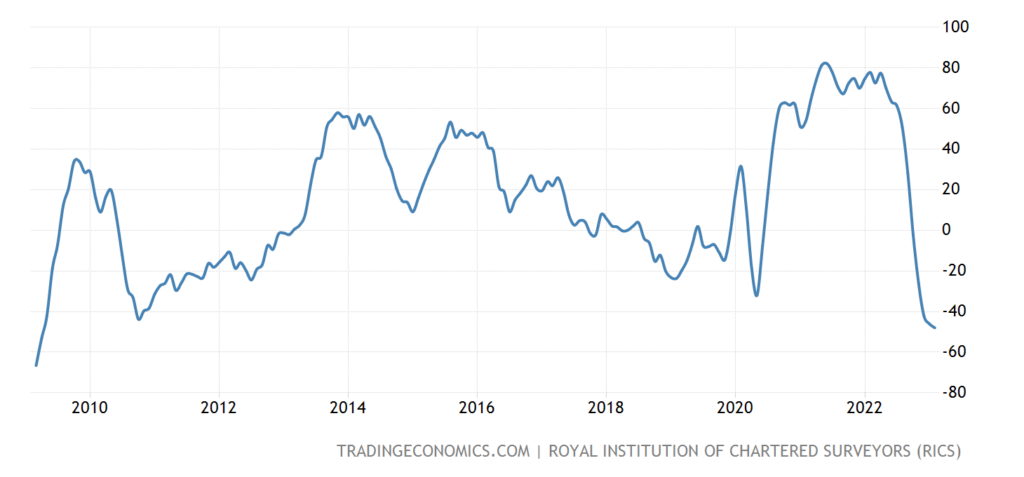
Pic. 23
A little explanation needs to be given here. The RICS UK home price balance survey measures the gap between the percentage of respondents seeing rising and falling house prices. It is this index that fell to -48 in February 2023 from -46 in January, the lowest since April 2009. The February figure also marked a fifth consecutive month of negative readings, although it came in slightly better than expected at -49.
House prices in Britain +2.1% per year (that is, significantly lower than even official inflation) – next to the 10-year lows set before covid:
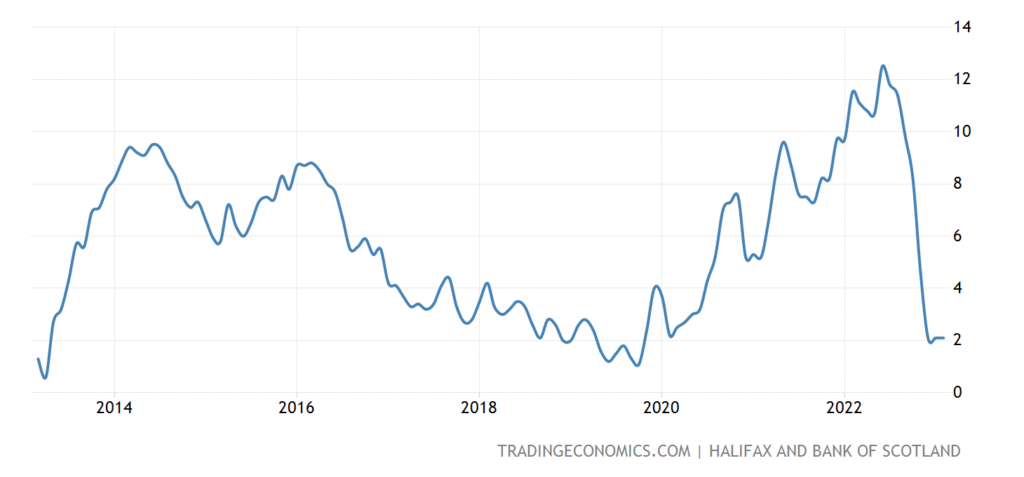
Pic. 24
CPI (Consumer Inflation Index) Switzerland +3.4% per year – only 0.1% from the 30-year peak last summer:
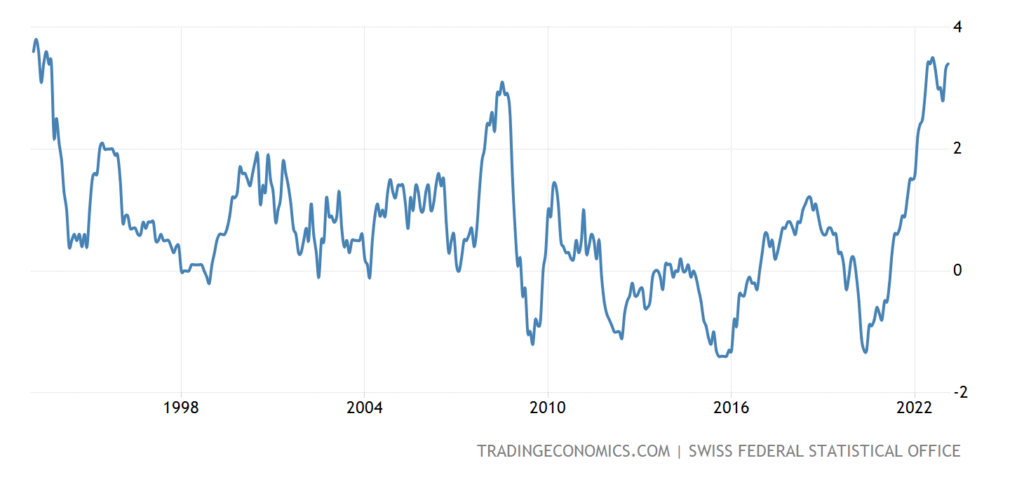
Pic. 25
And +0.7% per month – a repeat of the 13-year high:

Pic. 26
German CPI +8.7% per year, also only 0.1% from the 70-year October-November high:
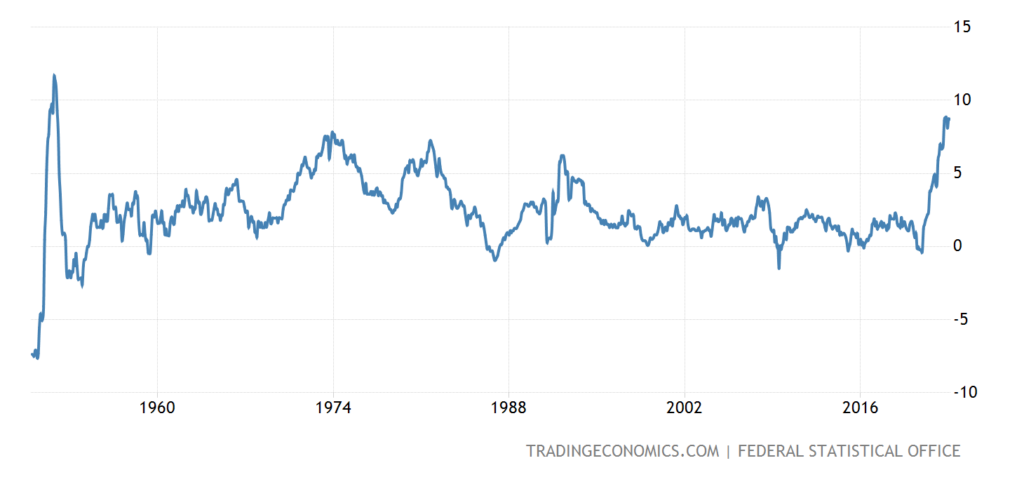
Pic. 27
China CPI +1.0% per year – yearly minimum:
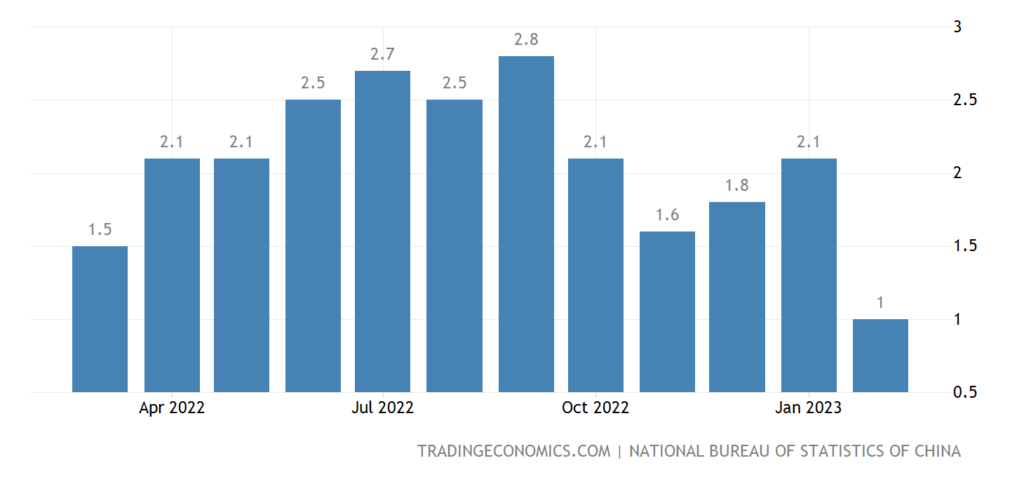
Pic. 28
PPI (industrial inflation index) China -1.4% per year – bottom in 27 months:
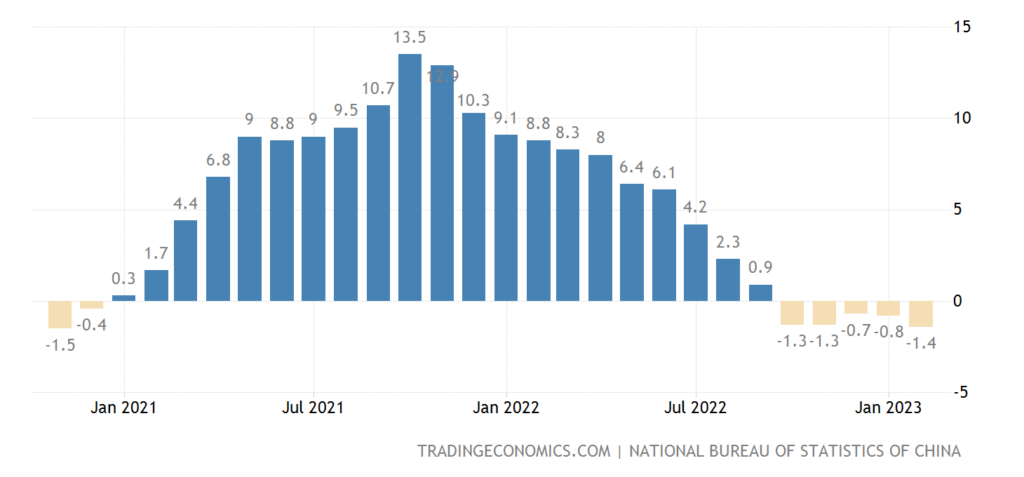
Pic. 29
And this is clearly a depressive symptom. And he shows that even support from the federal center, the provinces are no longer able to withstand the pace of economic growth. In Italy, apparently, a similar situation:
Italy’s PPI -7.5% per month is an anti-record for 32 years of statistics:
Pic. 30
In fact, high inflation inevitably causes a recession in the economy (see, among other things, the subsequent data on retail sales in the European Union), which can turn the structural crisis from an inflationary scenario into a deflationary one (according to the samples of 1930-32). It is quite possible that this scenario is being realized in China and Italy.
Eurozone retail sales -2.3% per year – 4th negative in a row and 7th in the last 8 months:
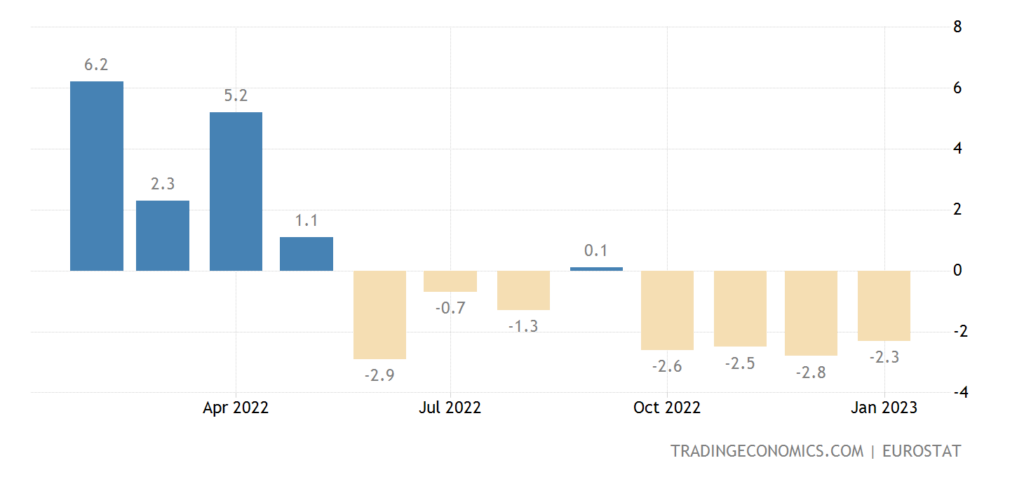
Pic. 31
In Germany -6.9% per year – the 9th negative in a row:
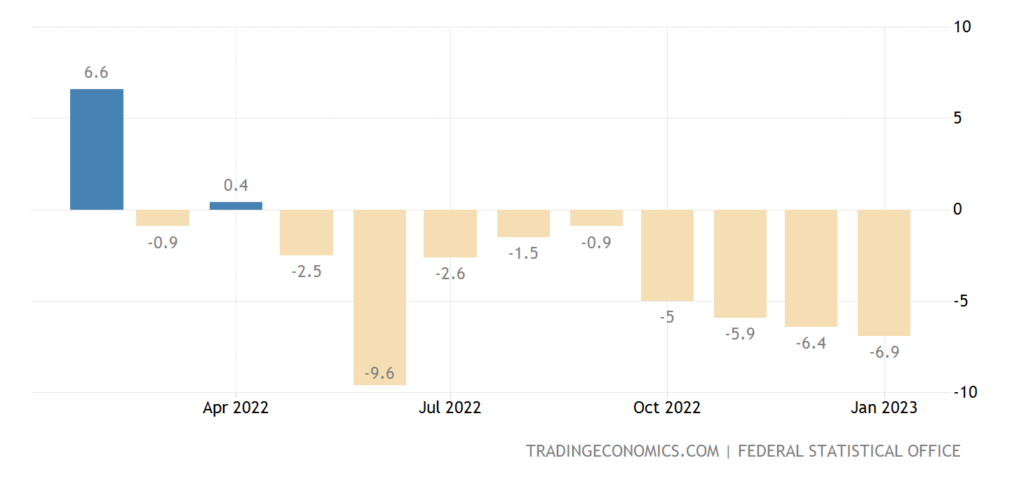
Pic. 32
In France, -2.9% per year is the bottom in 26 months; excluding the covid dip, this is a 24-year low:
Pic. 33
Household spending in Japan has been in the red for 3 consecutive months:
Pic. 34
Layoff announcements in the US in January-February are the peak for these months since 2009, + 427% per year to 181 thousand:
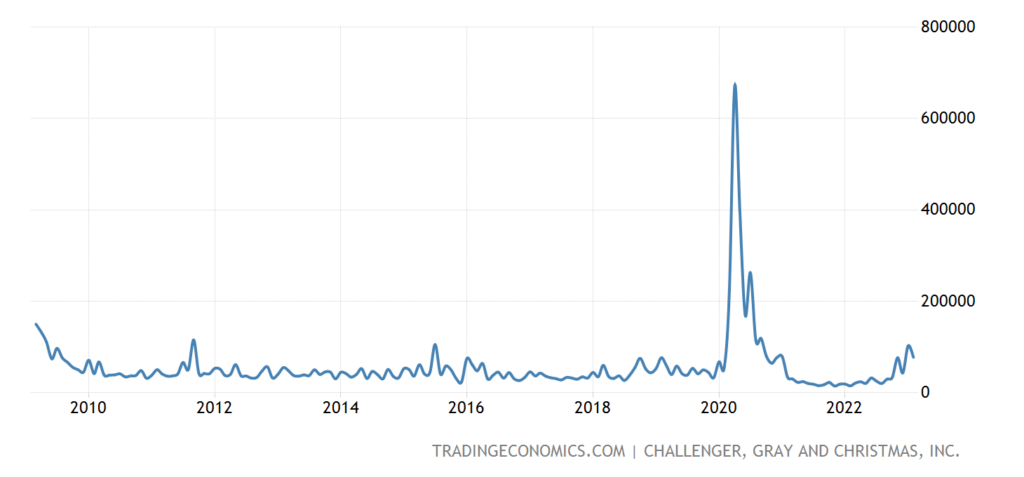
Pic. 35
The number of recipients of unemployment benefits in the United States in a maximum of 14 months:
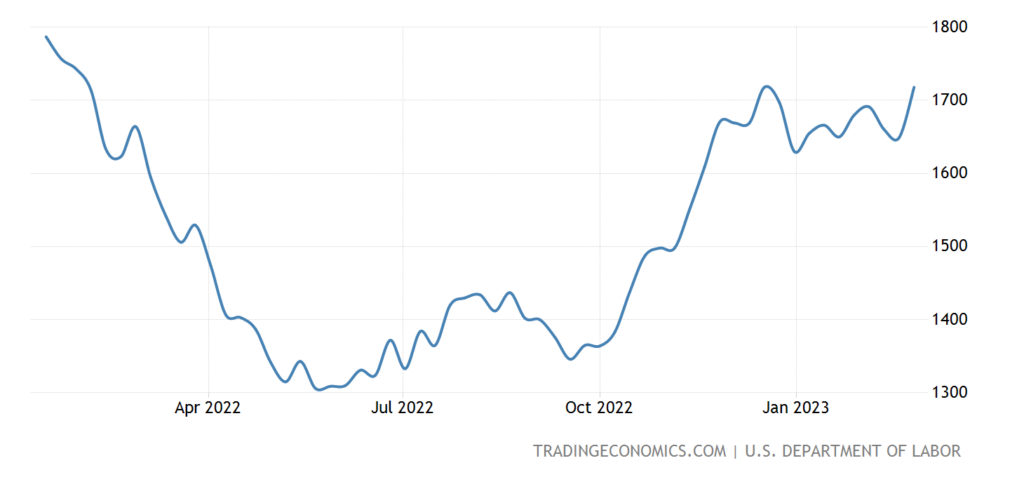
Pic. 36
However, as we have repeatedly noted, there is no faith in the data of US labor statistics. However, the duration of the working week fell slightly, from 34.6 the previous week to 34.5, which confirms the worsening situation on the labor market.
The Central Bank of Australia raised the rate by 0.25% to 3.60%, but the Central Bank of Canada did not further tighten the policy.
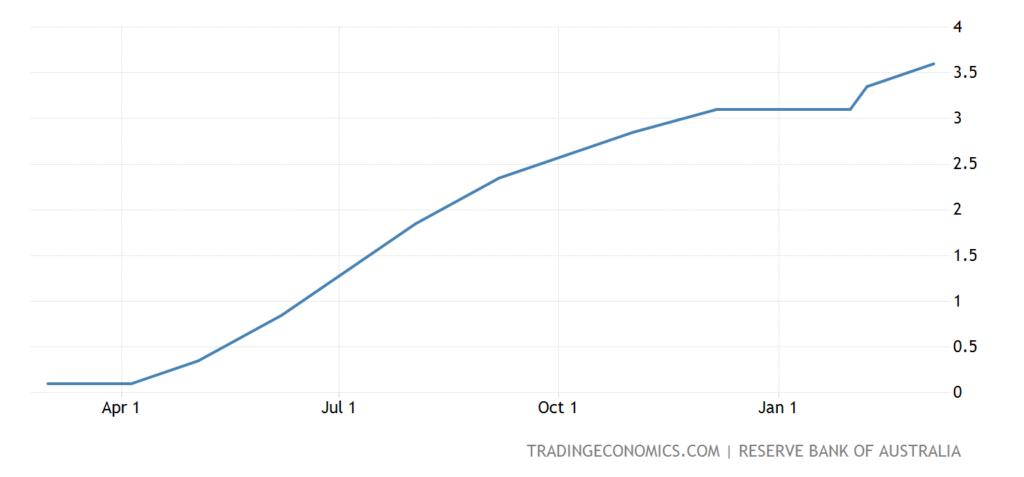
Pic. 37
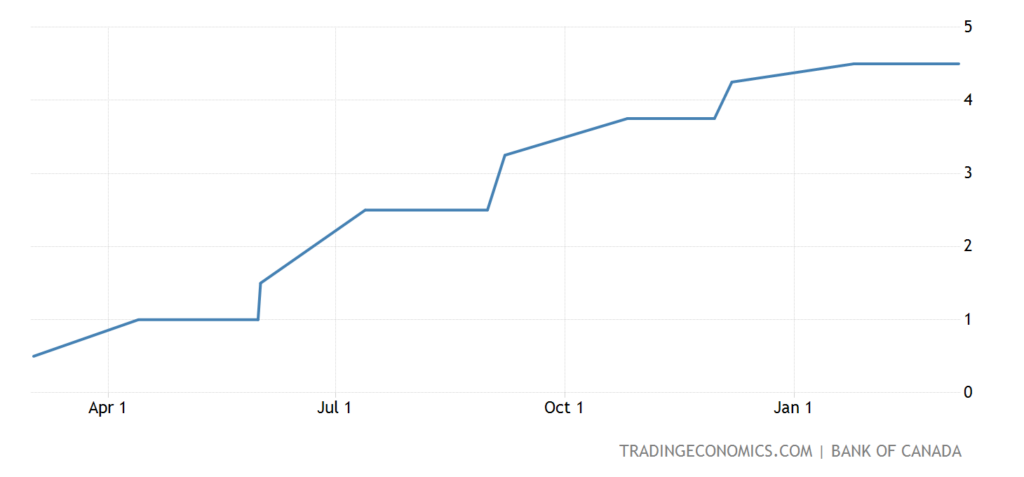
Pic. 37
Similarly, the Bank of Japan did not change anything, but at the next meeting it will have a new head.
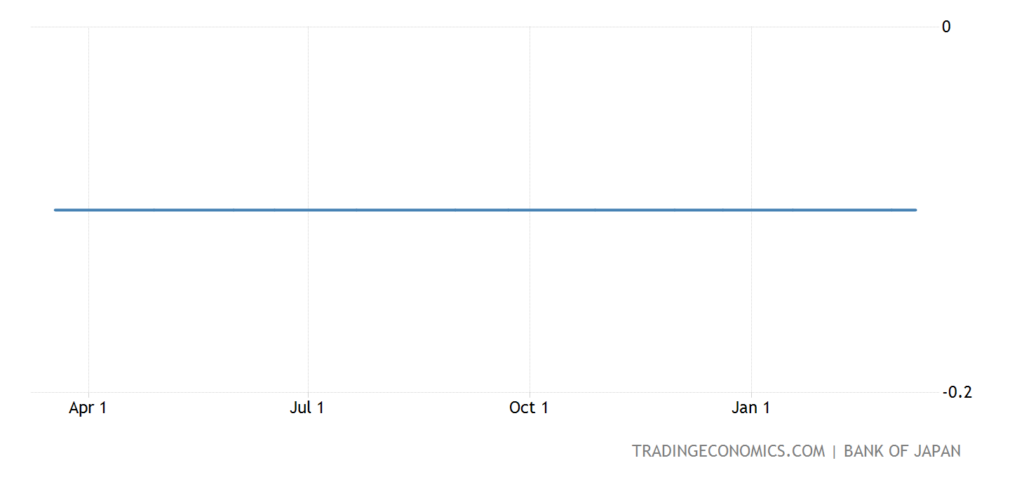
Pic. 38
Main conclusions. Let’s start, as promised, with the speeches of the head of the Fed, Powell. His main theses:
The Fed is ready to accelerate the rate hike if the data comes in strong;
peak rates are likely to be higher than many expect;
a further increase in the rate is appropriate;
premature mitigation is currently undesirable;
it is appropriate to keep the rate at an elevated level for a certain period of time;
the mismatch between supply and demand is still evident in the commodity sector as well as in the labor market;
The Fed needs to do a better job of stabilizing domestic inflation;
we have all the tools to lower inflation, the Fed’s goal is to reduce inflation to 2%;
core inflation is not declining as fast as we previously expected (We, in our reviews, explained in detail the reason for this phenomenon, note by the Khazin Foundation);
the time may come when a recession begins, the Fed hopes for a soft landing of the economy, with a small and short recession; commodity inflation has been declining for several months, we are studying the nature of inflationary pressures with tightening monetary policy;
Many factors influence inflation and we cannot know 100%. Wage growth is declining.
Following Powell’s comments, futures markets are pricing in a 0.5% Fed rate hike in March with a 48% chance. The swap markets raised their forecast for the Fed’s rate to peak to 5.61% in September, and set a 0.5% rate hike in March (against 0.25% earlier). reducing inflation in housing services.
In fact, Powell said nothing new, except that inflation is not behaving as expected by the Fed management. This is not surprising – the monetary theory that the US monetary authorities (and indeed the entire American economic science in general) adhere to does not recognize the structural nature of the crisis and, accordingly, does not see the structural component of inflation, which we have written about so much.
On the last day of the week, problems began for a number of American banks:
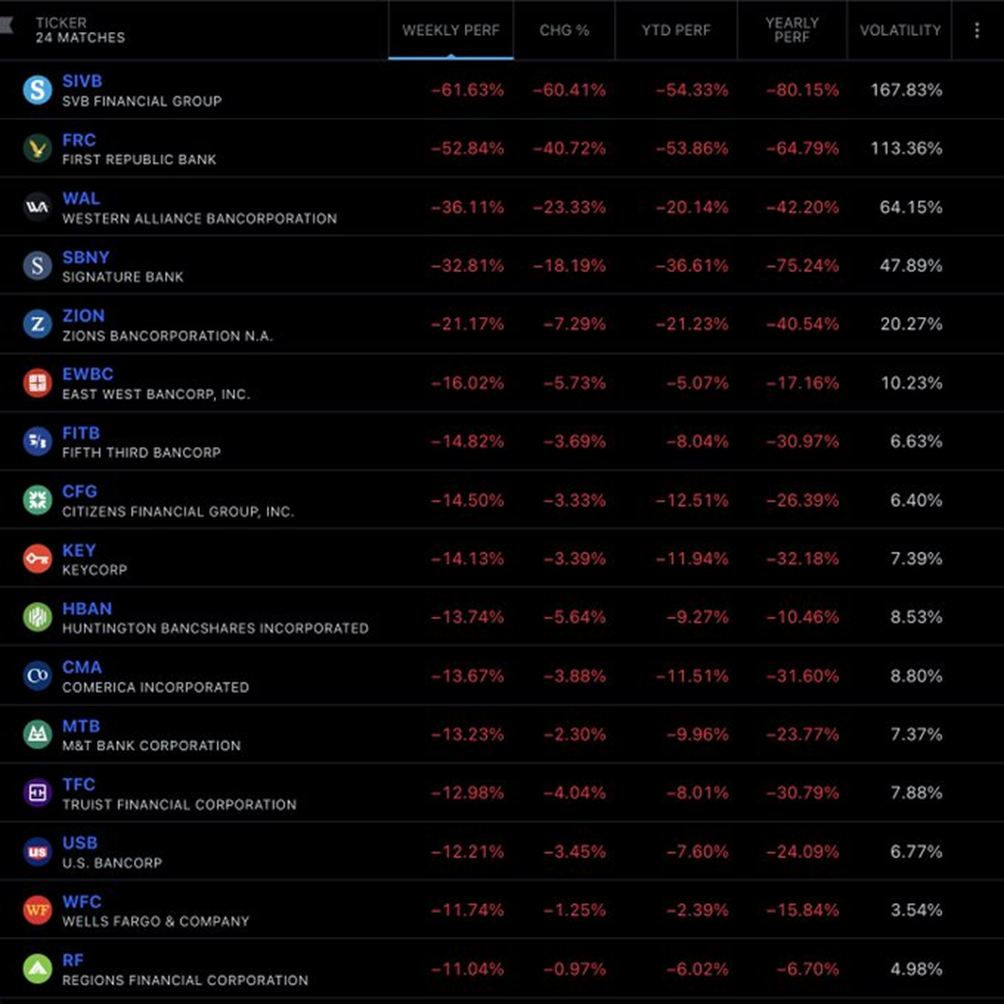
Some experts even warn of a possible collapse of the markets, comparable to 2008. We are not yet sure of this, since the transition to the “industrialization of AUKUS” model has not yet taken place, however, it is possible that they decided to use the collapse of the markets as a trigger mechanism for changing the basic economic paradigm in the United States. In any case, next week will be very interesting.
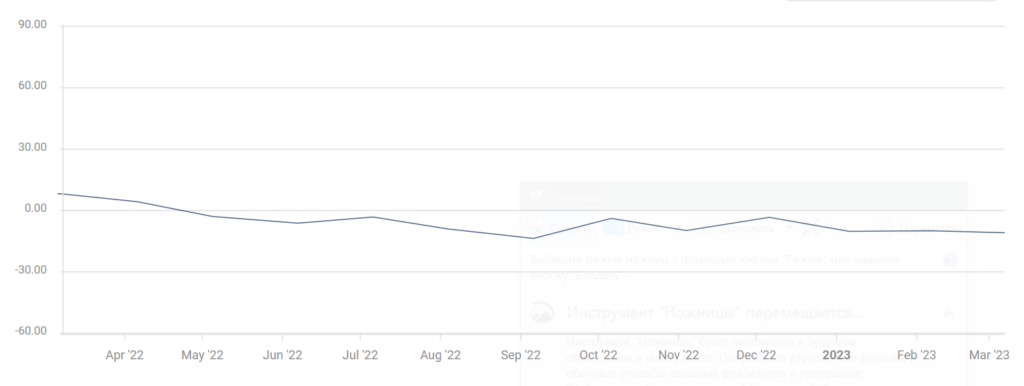
To confirm the situation in the economy of the main developed countries, here is the chart of the Baltic Dry Index, which describes the activity of maritime trade:
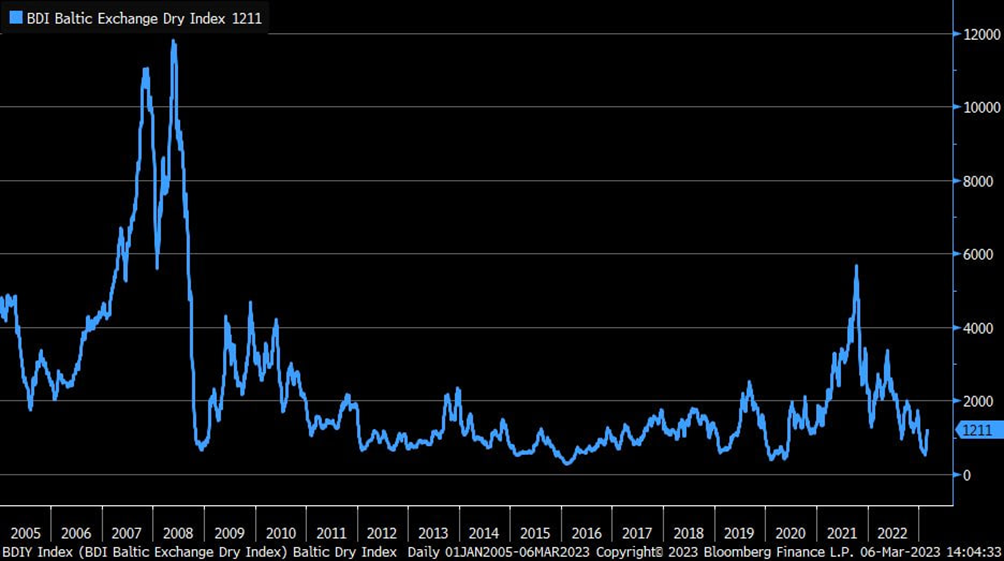
It clearly shows a general deterioration after the local recovery that followed the covid dip.
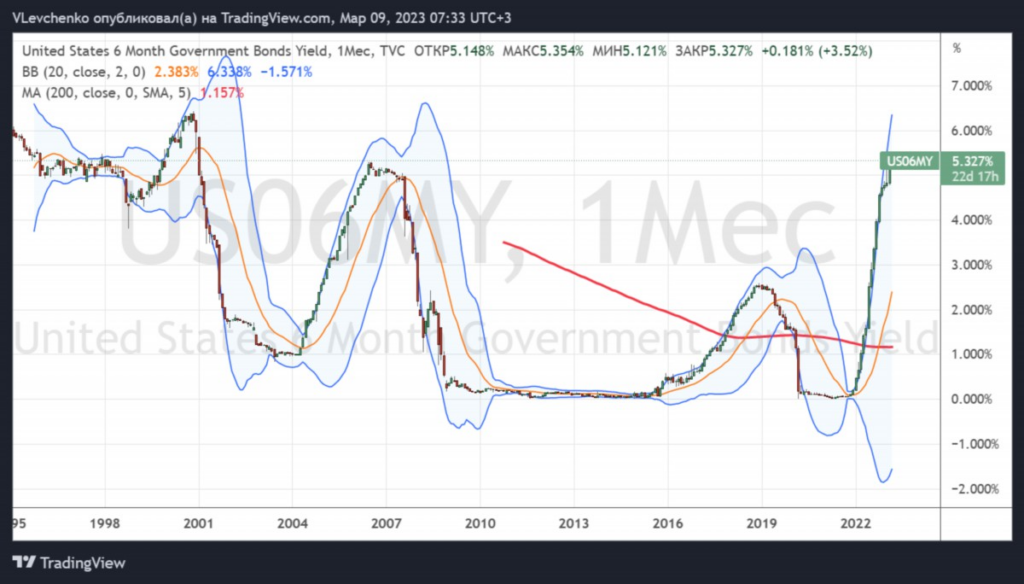
And finally, here is a picture from the telegram of Vladimir Levchenko, who draws attention to the record yields of 6-month bills of the US government:
In general, in conclusion, we can say that the hypothesis of the beginning of inflation growth after many months of tightening monetary policy is confirmed, but we will know for sure next week. But the structural crisis continues for sure, in all countries and on all continents. This is, of course, sad, but our readers are at least warned, so we wish them a wonderful weekend and an optimistic work week!