
Time period: 13-19 November 2021
Top news story. To be sure, the highlight of the week was a conversation between Biden and Xí Jìnpíng in which Biden admitted that China and Taiwan were one State. Of course, this news is not economic, so we will not interpret its meaning, and only note that the inflationary wave retains intensity. In support of this statement, we will give a graph of the M1 money stock in the United States:
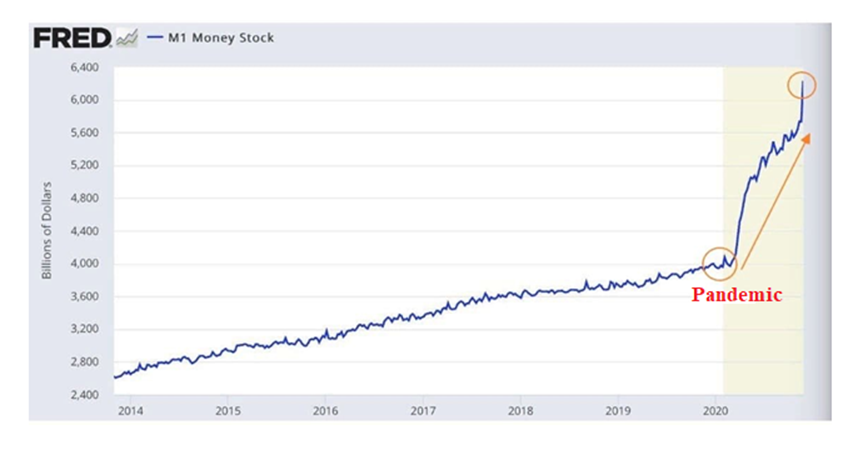
The picture illustrates what is happening and suggests that not only structural but also monetary inflation will continue in the US. It could have ended a few months after the cut-off, but the decision on structural reform meant that no one was going to stop issuing for the time being.
For that reason, it makes sense to reiterate a point that we have made many times before, but which remains of high importance. Since the statistical agencies of almost all countries underestimate inflation (see, for example, the Review of the previous week), they automatically inflate (to the positive) all indicators where gross output is an integral part because the latter is not counted in pieces, but in price terms. And for that reason, so many of the data listed in the surveys are in fact far more pessimistic than what official statistics give us.
Note that it is impossible to stop emissions for a long time: in this case the collapse of demand will inevitably cause a deflationary shock similar to the spring of 1930. We agree that this scenario is inevitable in any case, but it is certainly not the best policy to bring it closer. And for this reason, it is likely that China will not be heavily “punished” for annexation of Taiwan. And this annexation is necessary for Xi, and because he has already been awarded the honorary title at the CPC Central Committee Plenary, and because the US economic performance is below expectations.
Macroeconomics
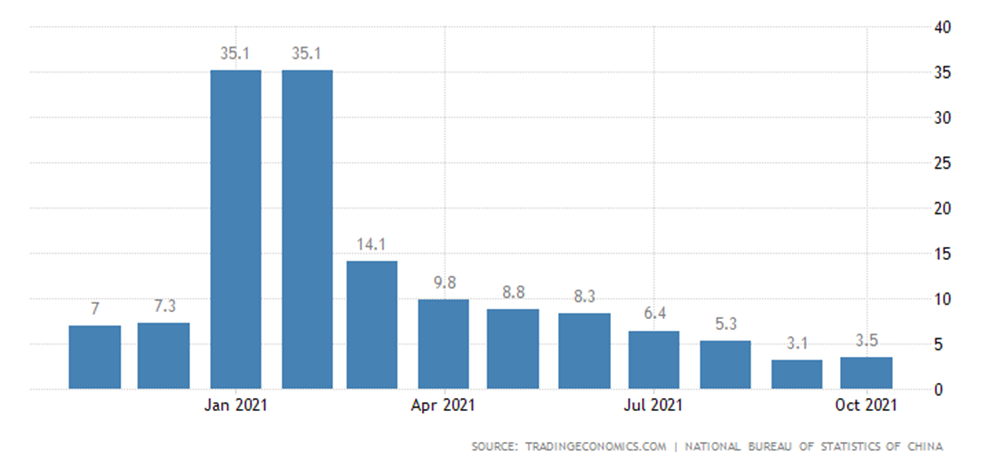
The nature of China’s November performance is mixed. Industrial production picked up a slight pace (+3.5% y/y after +3.1%), but only in comparison with the perennial trough of September:
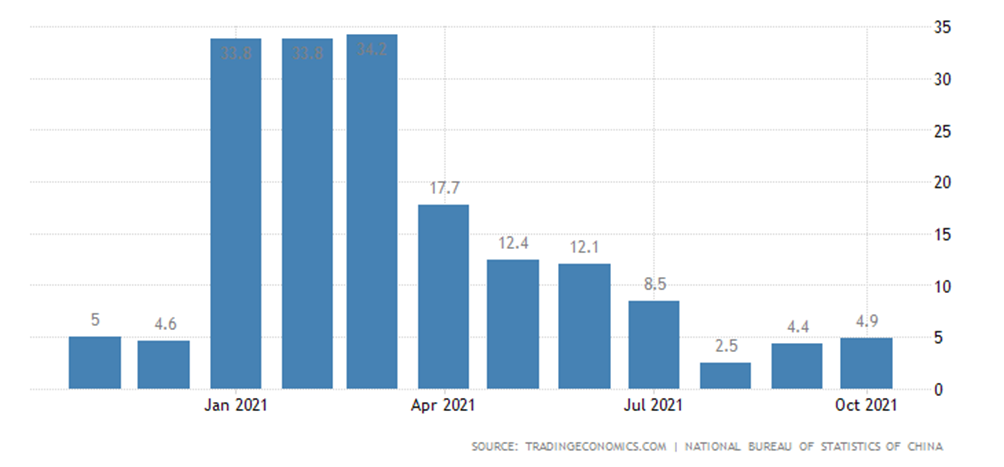
Similar situation in retail sales (+4.9% versus +4.4%):
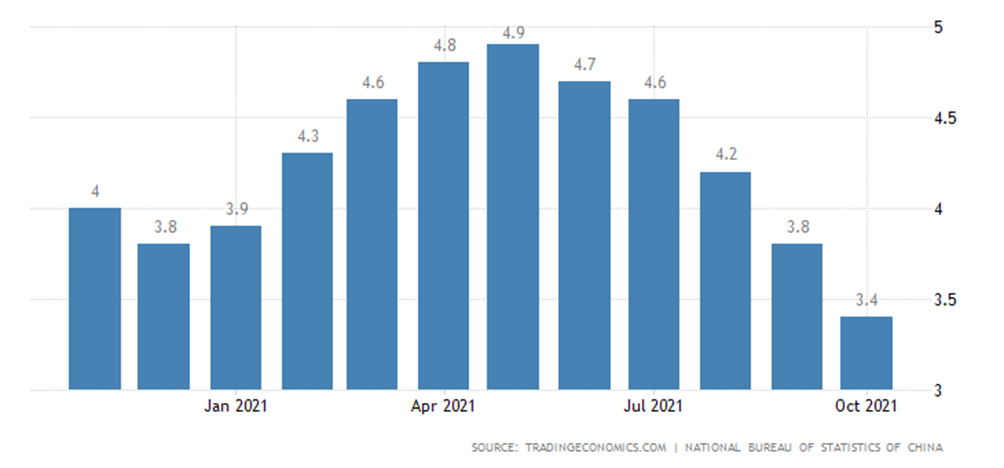
At the same time, investments in fixed assets continue to slow down:
The growth in prices for new buildings has the lowest rate in 6 years:
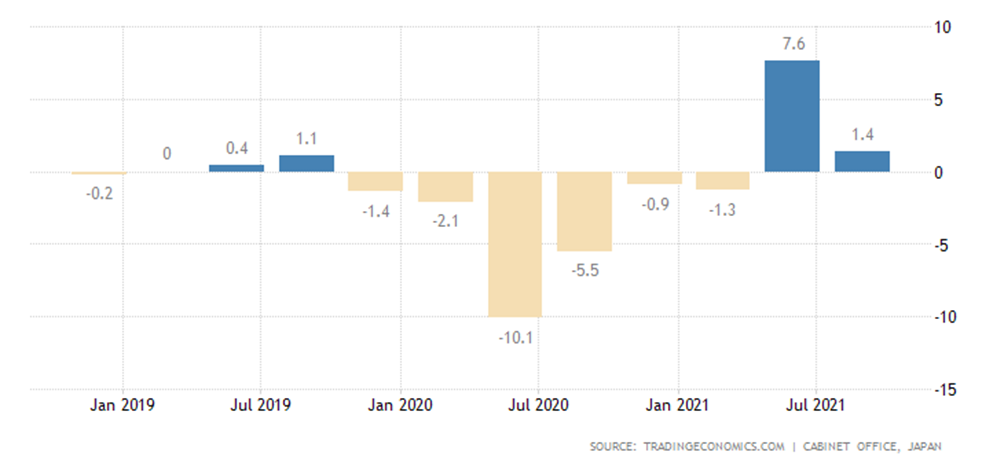
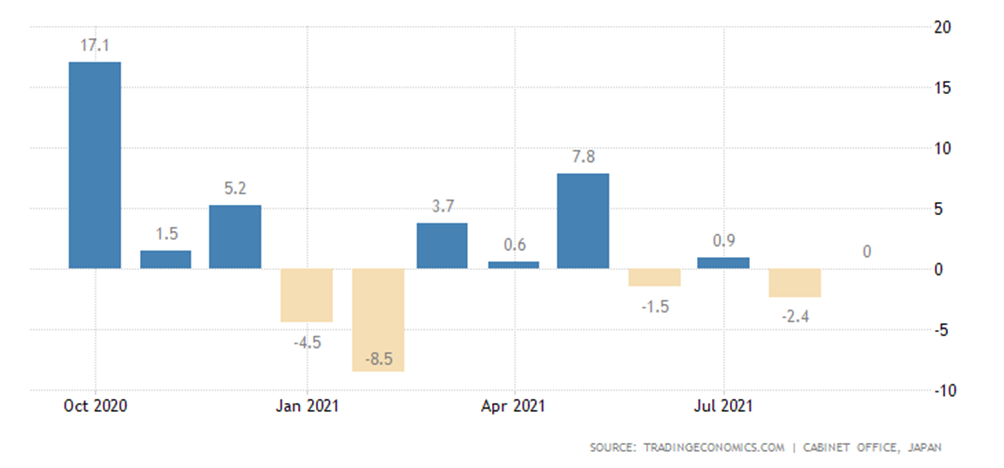
Japan’s GDP in Q3 -0.8% per quarter – four times lower than expected:
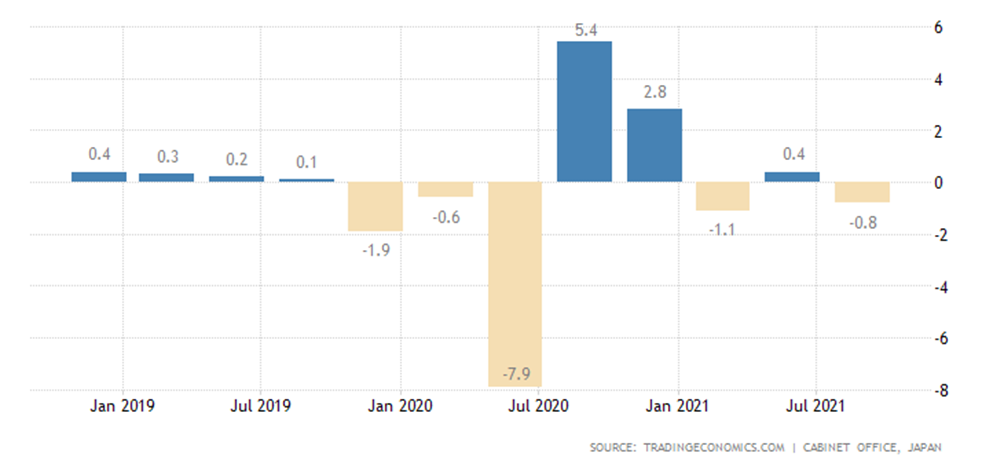
Annual growth shrunk by 5.5 times (+1.4% after +7.6%):
Industrial production in Japan is -5.4% per month, this is the third consecutive negative value, and the decline is increasing:
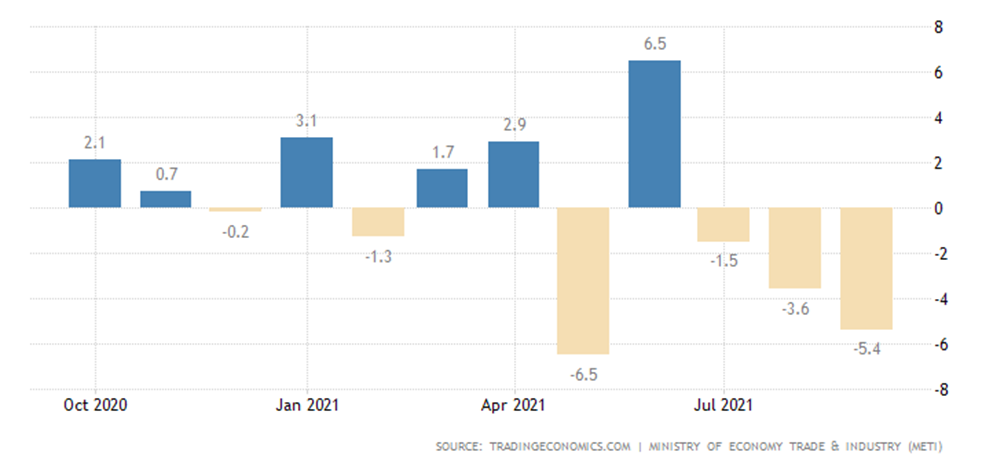
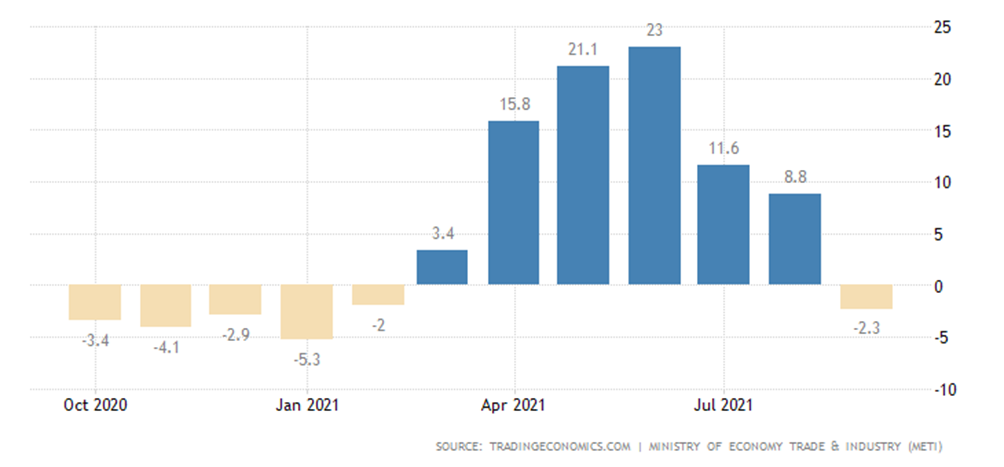
Because of what, annual performance has returned to negative levels (-2.3%):
The monthly increase in core machinery building orders in Japan in the last four months has occurred only once:
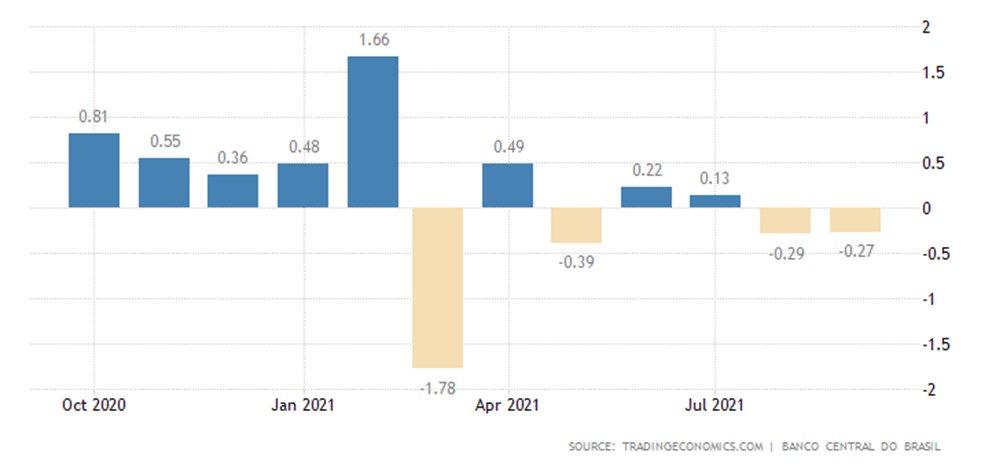
Economic activity in Brazil goes down for 2 months in a row:
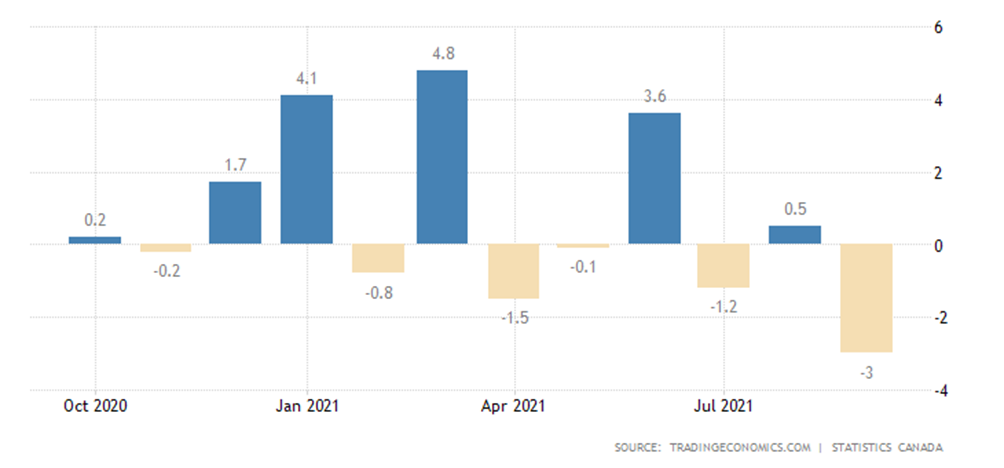
Manufacturing sales in Canada -3.0% m/m, lowest since April 2020:
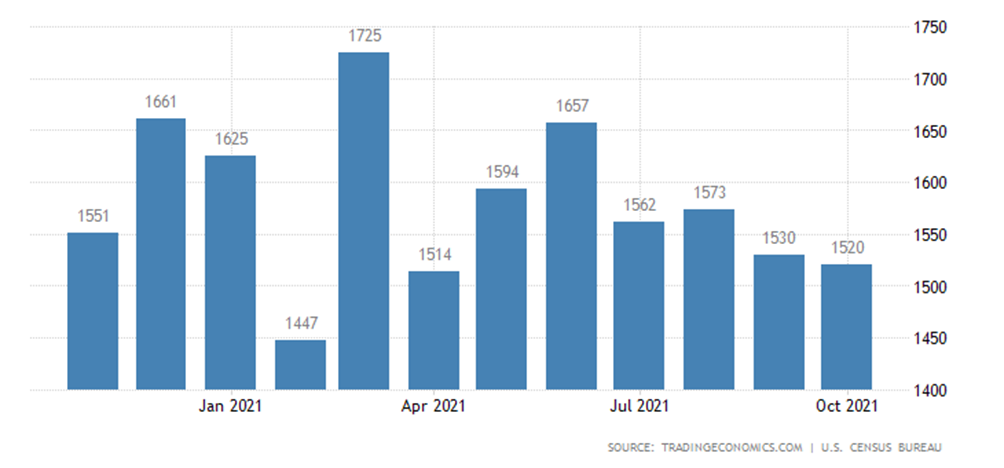
The number of new housing starts in the US is minimal in six months:
The capital and financial accounts of the US Balance of Payments went into red for the first time in 11 months, with low external demand for treasury bonds:
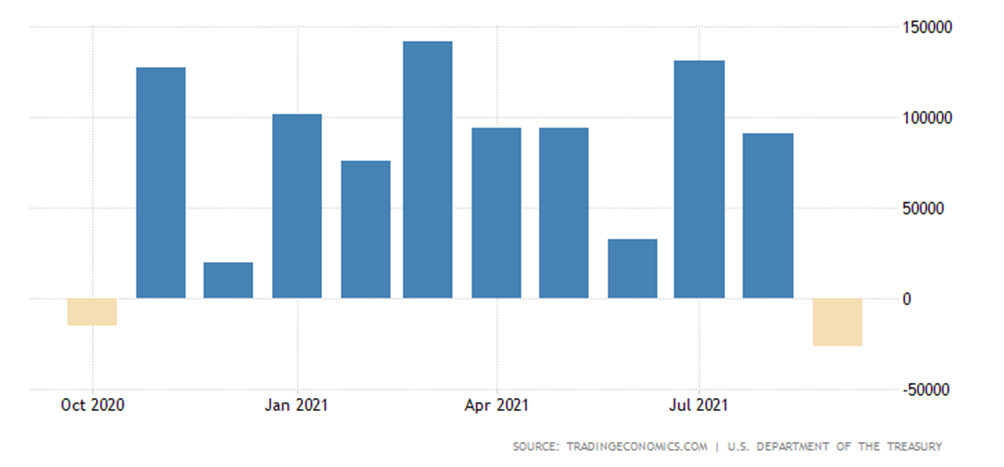
The latter graph suggests that if the trend does not change, the Fed will be forced to increase the issue to buy out the treasury bonds.
Even a minimal increase in mortgage rates (3.20% instead of 3.16%) caused a drop in demand for loans:
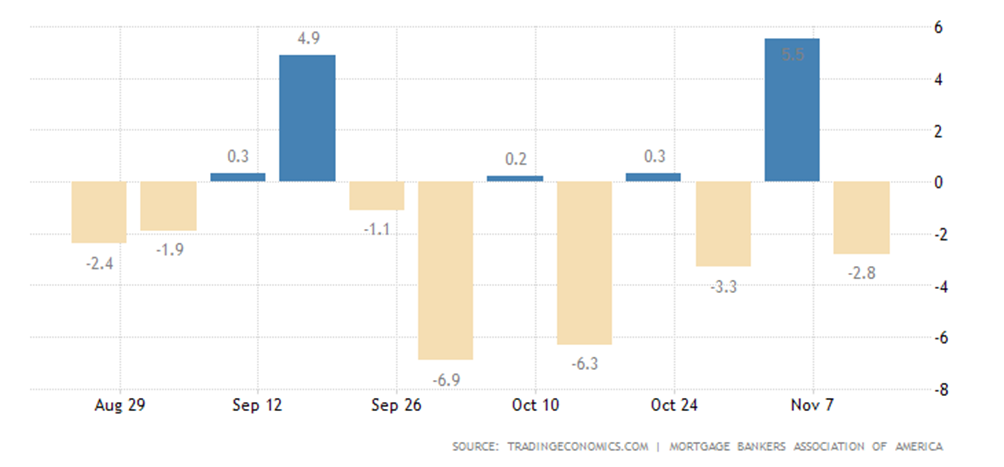
Which, in turn, means that the already extremely low activity of the US banking system is becoming even weaker.
This is followed by the traditionally depressing figures for inflation in different countries.
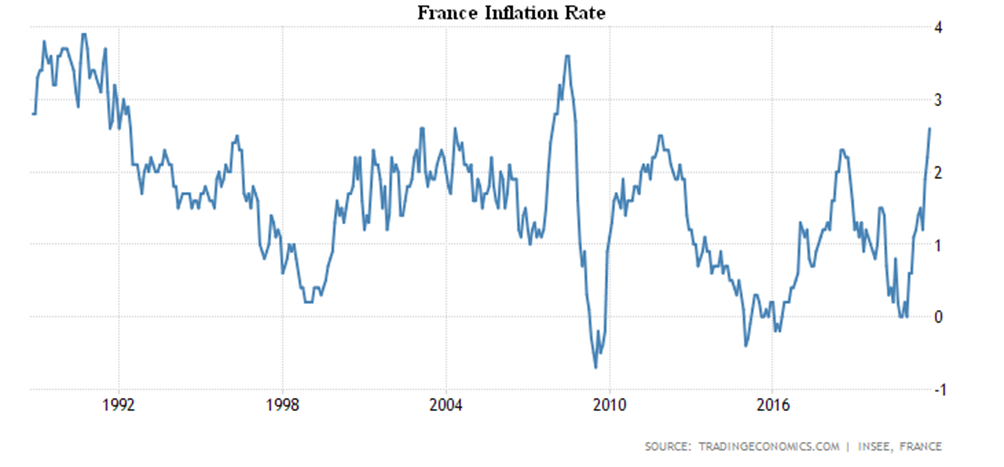
CPI (Consumer Price Index) of France +2.6% per year – the highest since 2008:
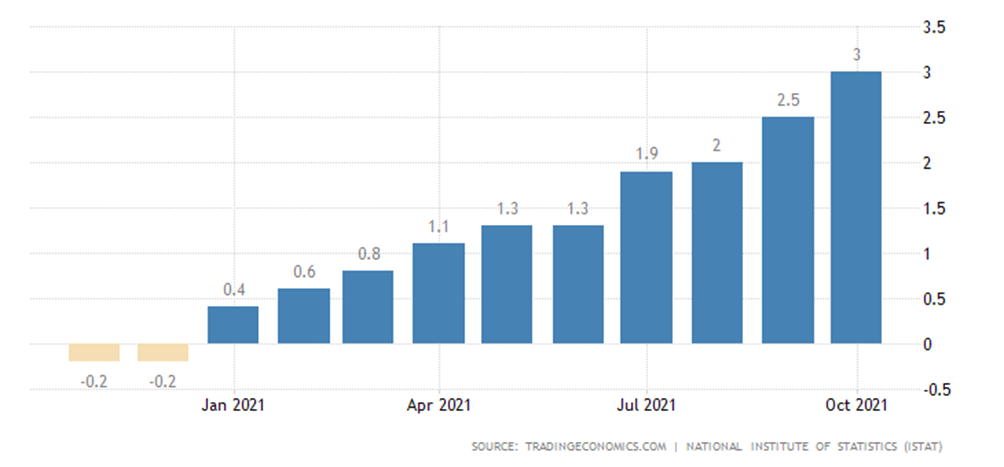
CPI Italy +3.0% per annum – peak since 2012:
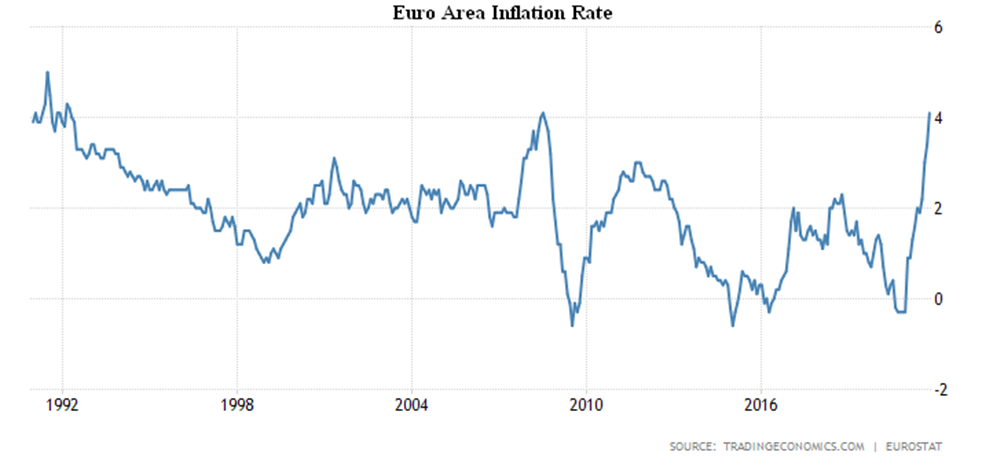
The Euro Area CPI +4.1% per annum, a record from 1992, previously set in 2008:
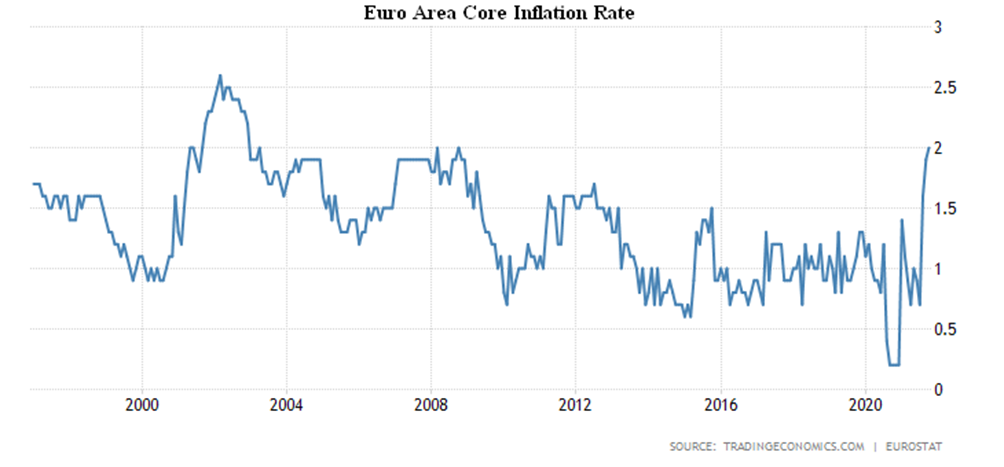
The Euro Area core inflation rate (without food, alcohol, tobacco and energy) is +2.0, which has peaked since 1991:
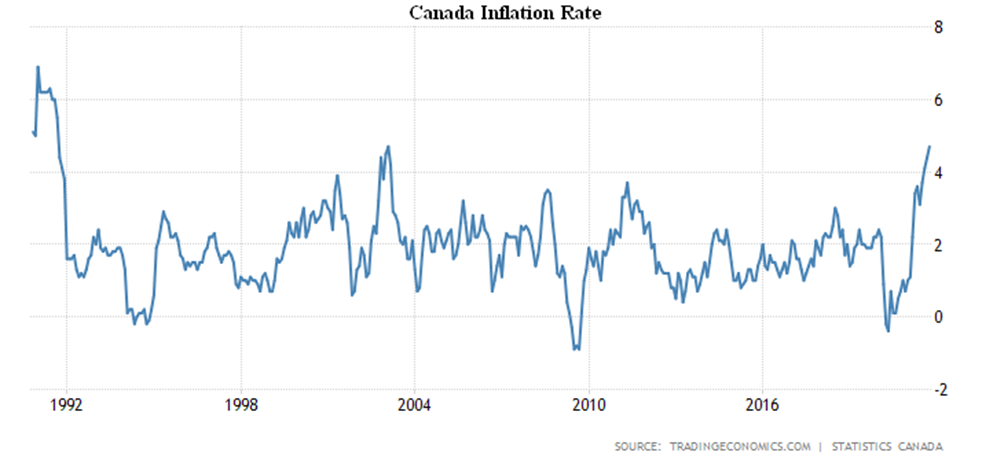
CPI Canada 4.7% per year – a repeat of the highest since 1991:
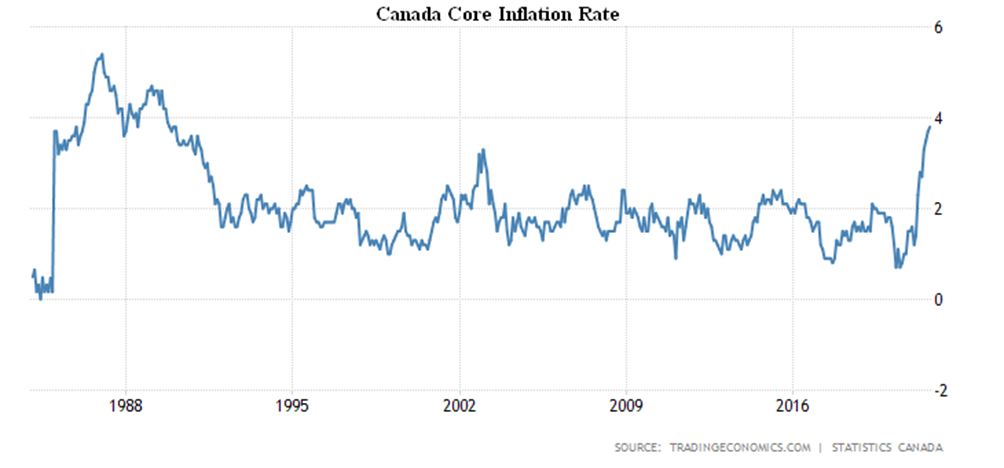
Canada core inflation rate (without food, alcohol, tobacco and energy) is +3.9 per annum, which is record high since 1989:
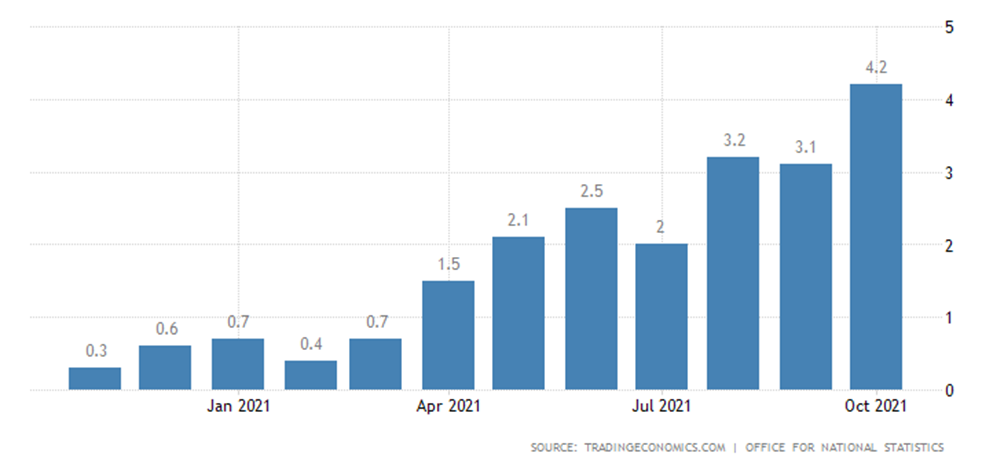
United Kingdom CPI +4.2 per annum, and is now at the top since 2011:
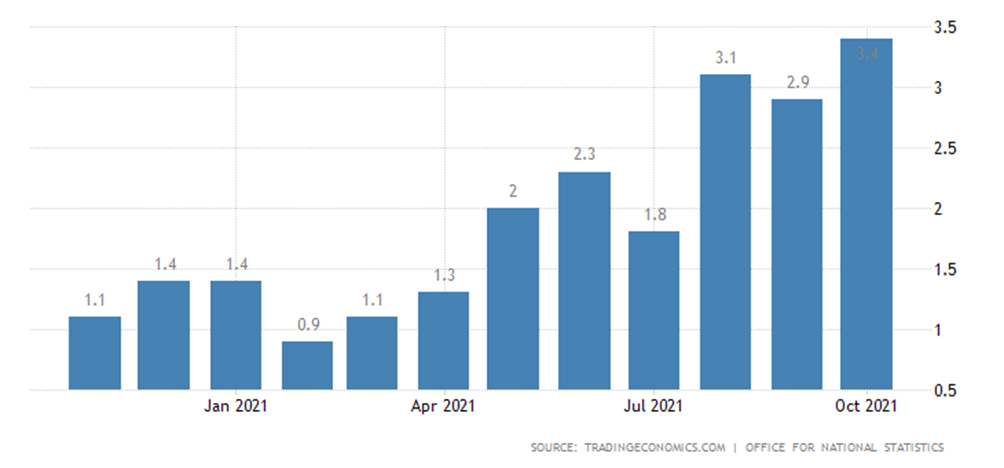
The same with net prices, without highly volatile components: food and energy (+3.4% per year):
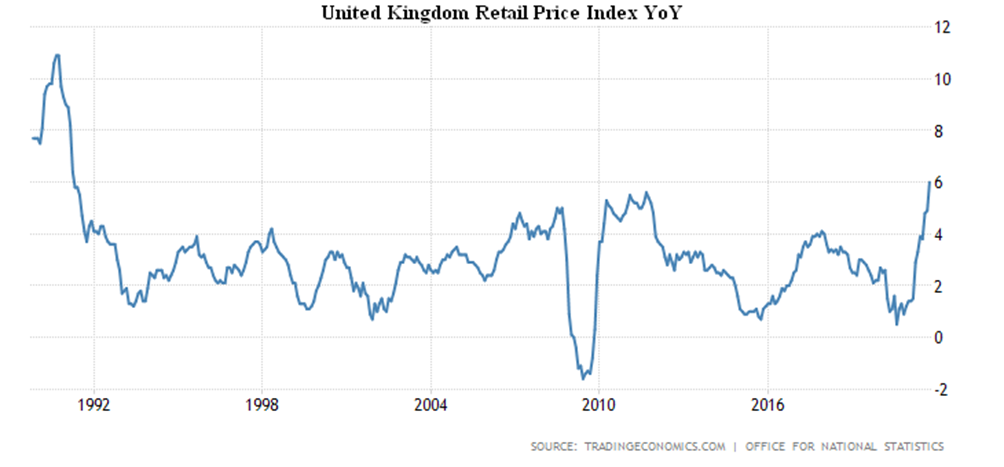
Finally, the Retail Price Index +6.0% per year is at its highest since 1991:
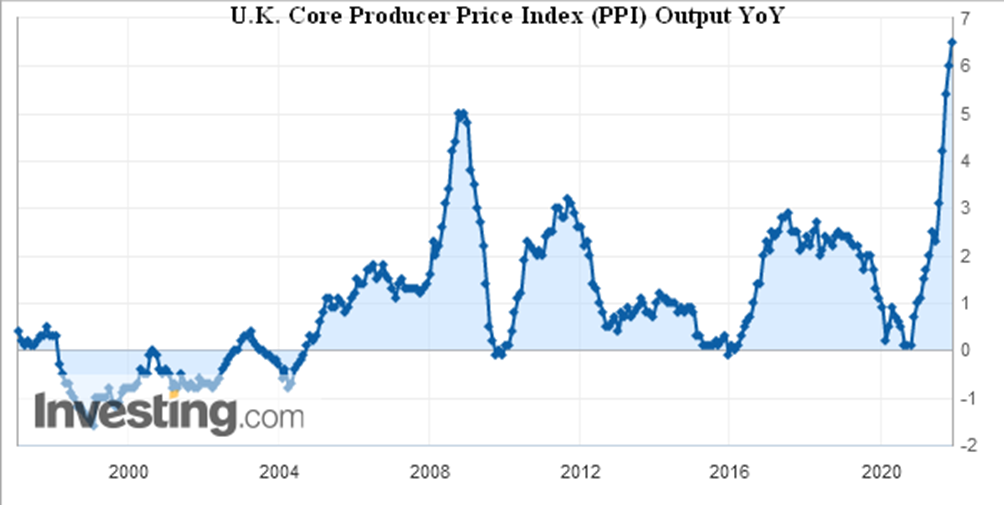
British PPI (Producer Price Index) +8.0% per year, it’s a peak since 2011:
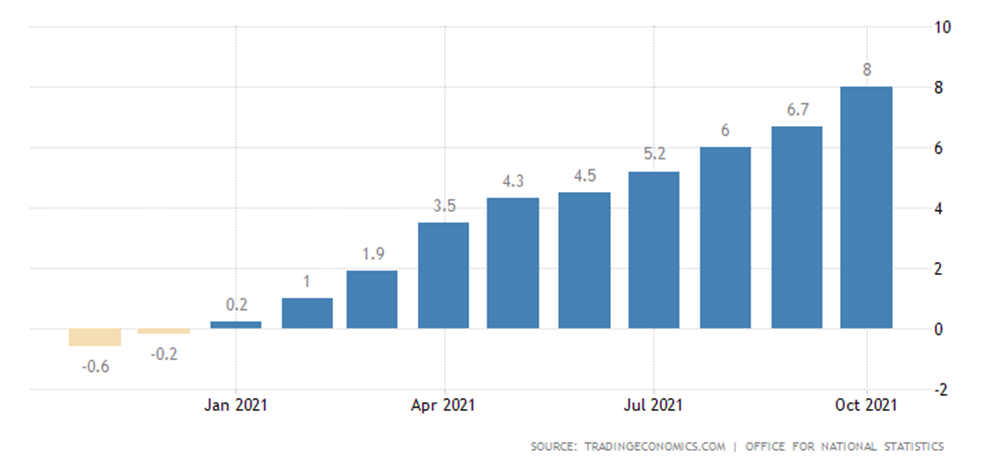
British PPI (Industrial Inflation Index) + 8.0% per year – maximum value since 2011:

Without food and energy, 6.5% per year – the record for 25 years of observation:
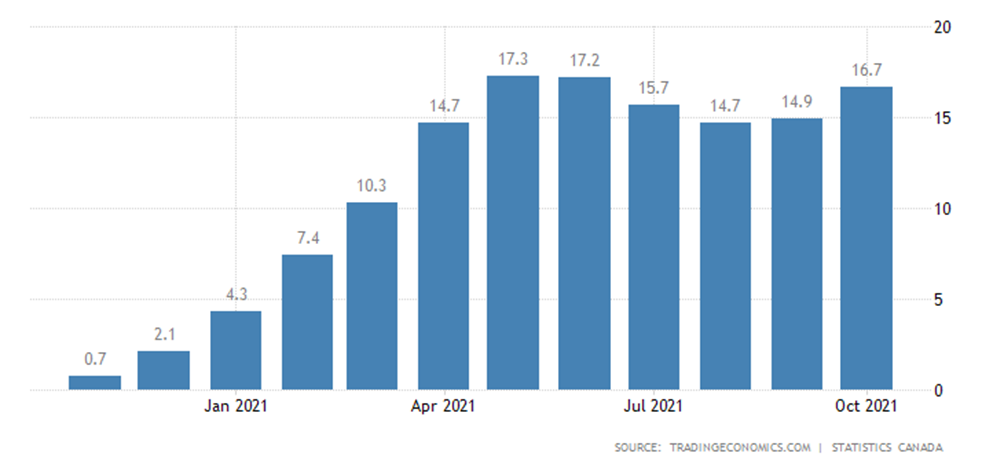
Canada’s PPI is accelerating again (+16.7% y/y), with only 0.6% missing to its May peak in almost half a century:
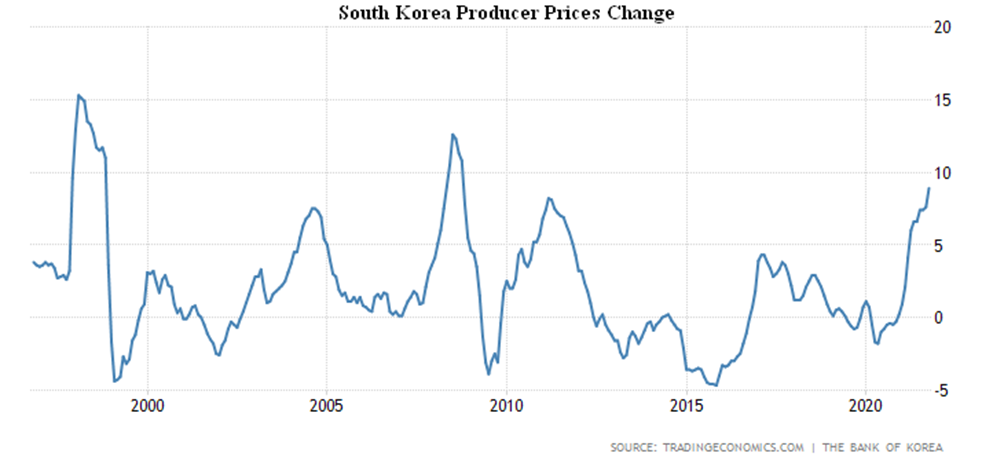
South Korean PPI +8.9% p.a., the highest level since 2008:
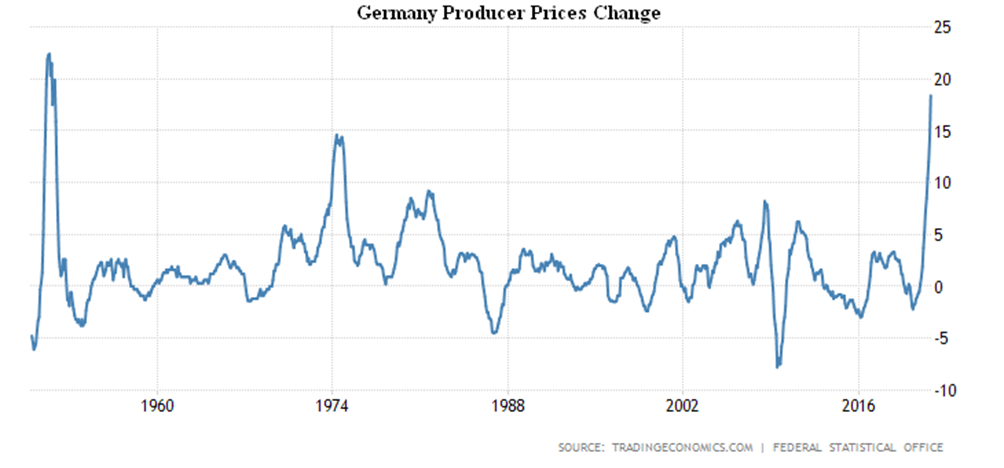
PPI Germany +18.4% per year – unprecedented rate in the last 70 years:
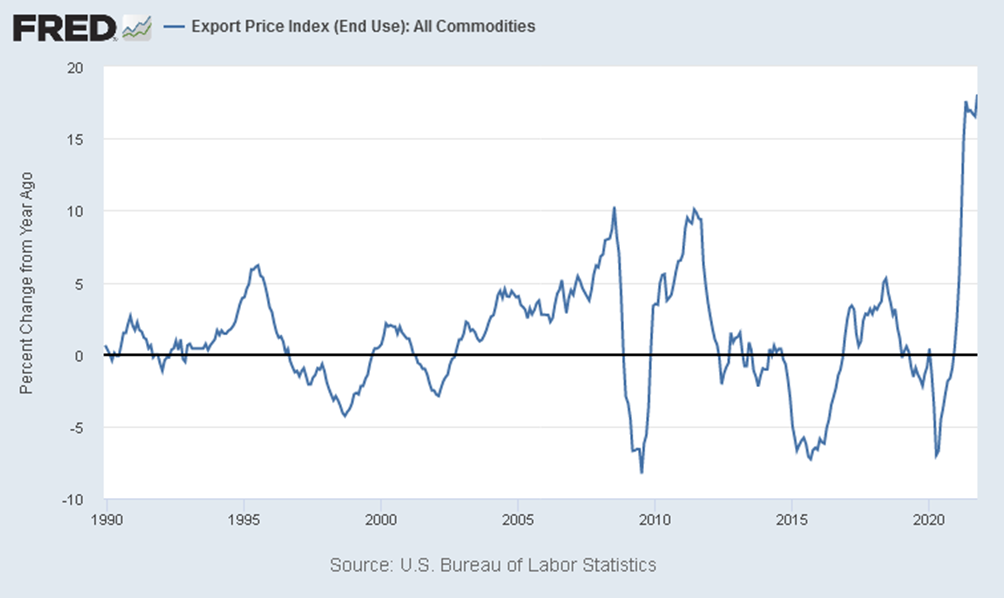
Export prices to the USA +18.0% per year – a record for 32 years of observation:
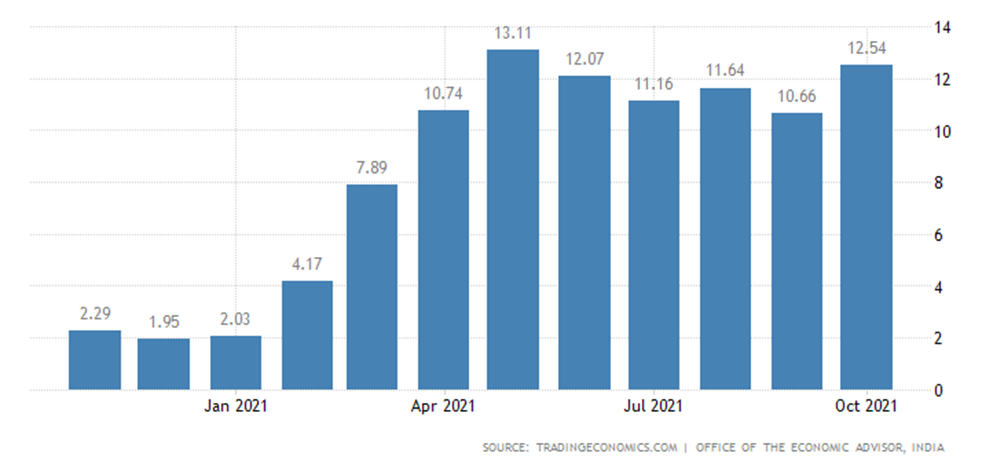
Wholesale prices in India rushed to +12.5% y/y – a 23-year May record (+13.1%) is around the corner:
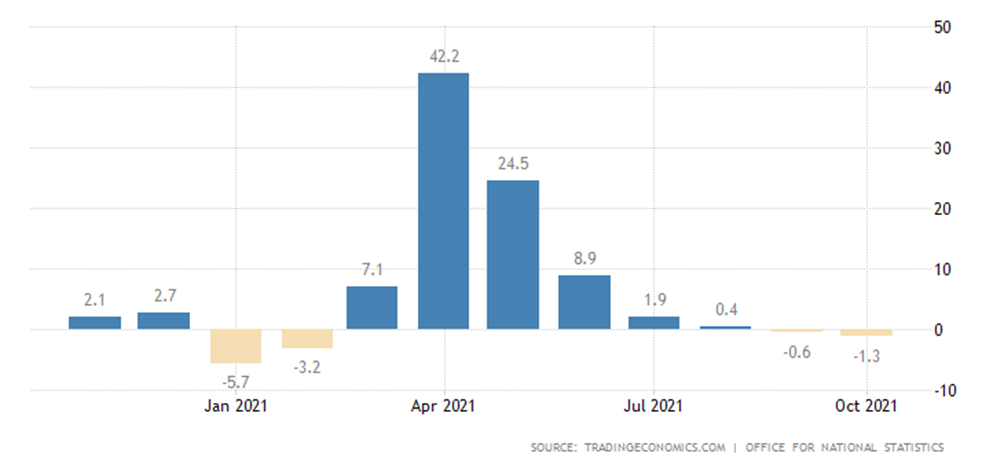
UK retail sales are firmly in the red:
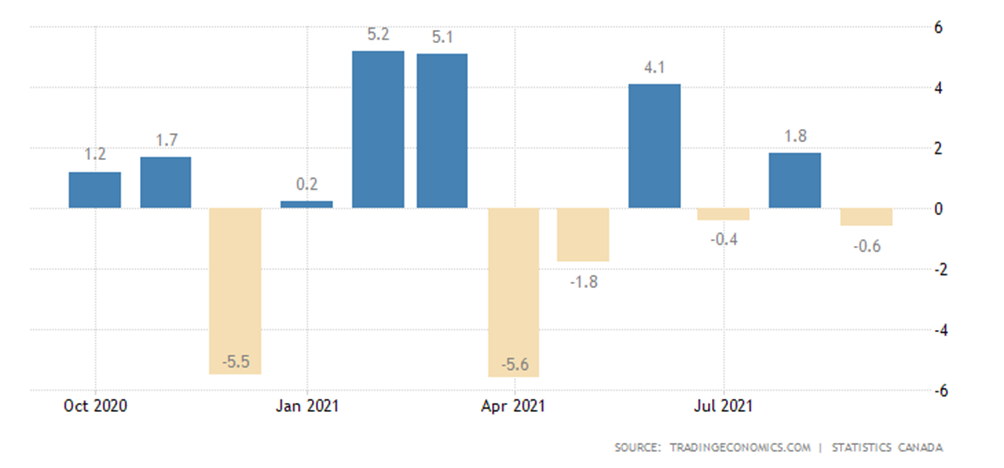
And in Canada so far only for a month (but the 4th in the last 6 months):
The Central Bank of Indonesia has left the monetary policy unchanged. The South African Central Bank hiked the rate by 0.25% to 3.75%.
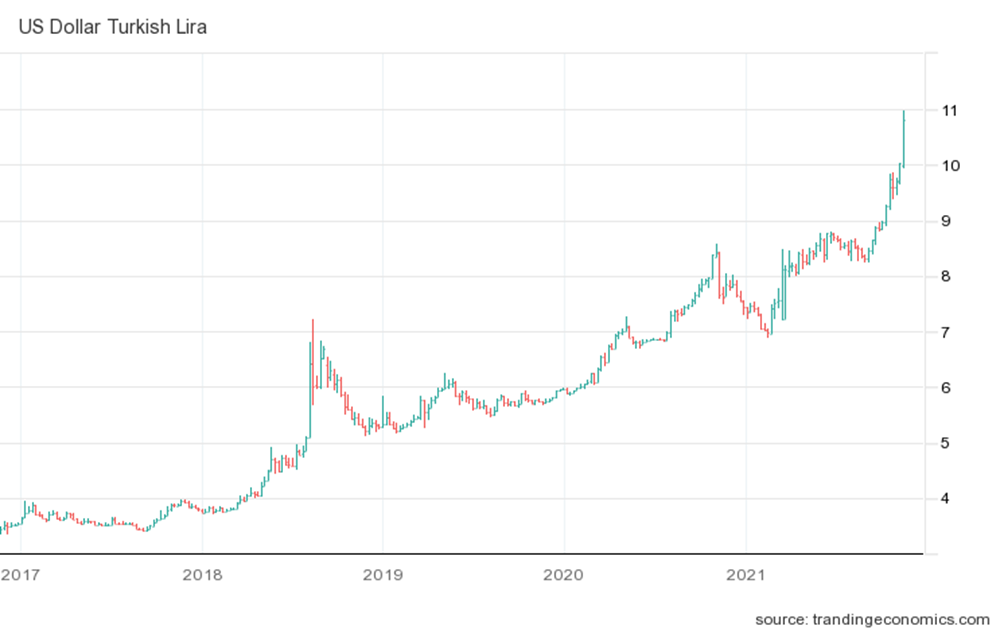
The Central Bank of Turkey reduced the rate again, by 1% to 15%, whereupon Lira began a free fall to new lows:
It cannot be excluded that precisely in order to distract the public from this circumstance, Turkey made a false report about Gulen’s death. In any case, the situation is clearly not conducive to stability.
Summary. The data of recent weeks clearly show that the structural crisis has reached a relatively steady pace. Towards the end of the year, we will discuss in detail its possible scale through the lens of falling GDP. In the meantime, let us recall that, given the capabilities of the state, the scope of structural decline should be about 7-8% of GDP per year.
Today it is no longer even possible to imagine how and in what ways this recession could be stopped. High inflation lowers demand, which reduces GDP. Demand-side emissions drive up the price of investment assets, which in turn leads to higher prices in industry. And since real household incomes are much lower than their demand (due to budgetary and credit incentives), this process can only stop once structural imbalances will be offset during the downturn.
A detailed description of this process is given in the book by Mikhail Khazin “Crisis of capital effectiveness: An idea is useless if it can’t be used to solve a task”, here is also the same detailed description of the extent of the economic downturn.
We wish all readers a good working week, and may the crisis pass for them!