
December 30, 2023 – January 5, 2024
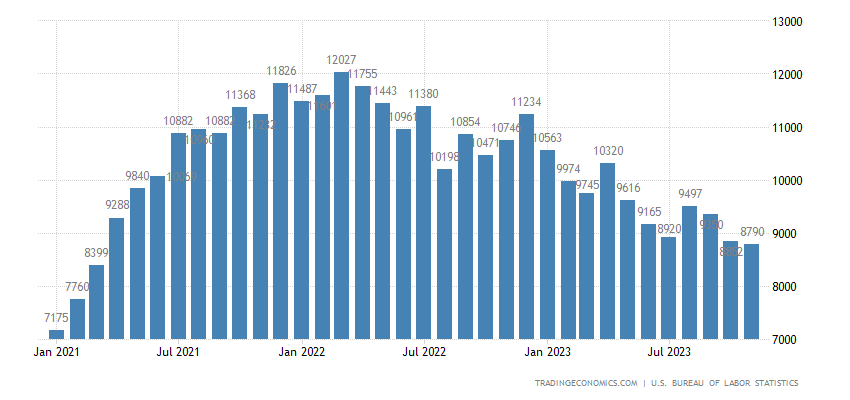
Big news. The Christmas and New Year holidays offer little chance for bright economic news. And, as can be seen from the next section, things are going absolutely in accordance with the theory of structural crises. It can be noted that the attempt to increase the length of the working week failed; it again fell to a 13-year low (excluding 2020):
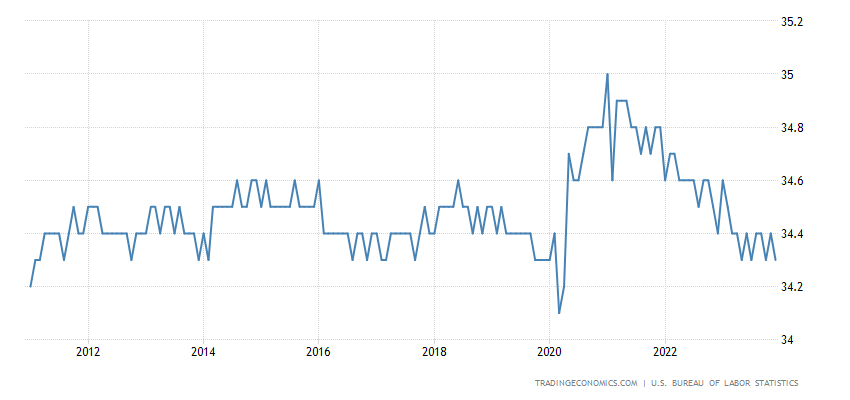
Pic. 1
As can be seen from the graph, this is not the first time this minimum has been reached (and with some acceleration towards the end of the year), so it is quite possible that next year this level will finally be broken down. And taking into account the fact that this indicator is very conservative, it can be stated that it clearly demonstrates the poor state of the real sector of the economy.
It is important to take into account that budget support for demand has little effect on employment: American citizens prefer to buy Chinese goods. Actually, this is the main problem of the US economy, which we have written about several times. So there is only one question: when will the US run out of free money to support demand? At this point, you will have to stop tight monetary policy and start issuing.
According to a number of experts (including Pavel Ryabov), this will happen in March-April. We will proceed from the fact that, most likely, by mid-spring the leadership of the US Federal Reserve System will have to significantly change monetary policy. But it is quite possible that political reasons will force the Fed to do this earlier.
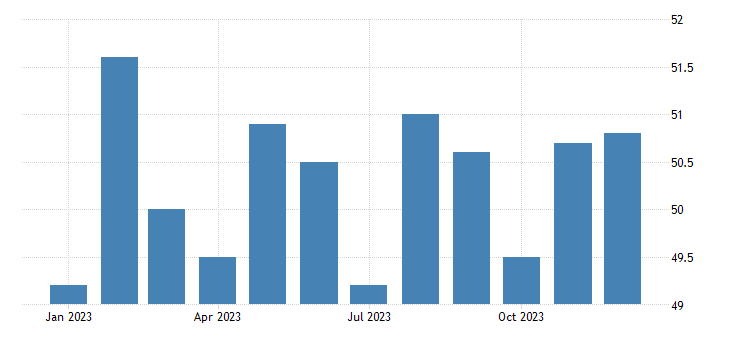
Macroeconomics. Official PMI (expert industry health index; its value below 50 means stagnation and decline) of the Chinese industry in the recession zone (49.0) and at the bottom for 7 months:
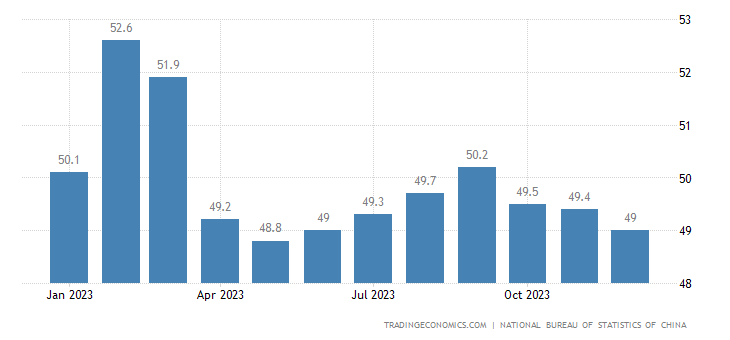
Pic. 2
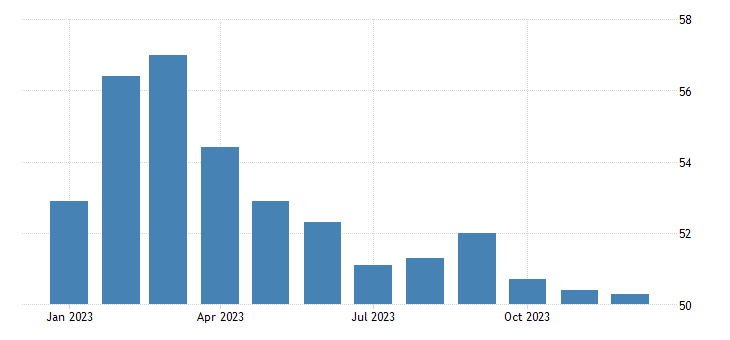
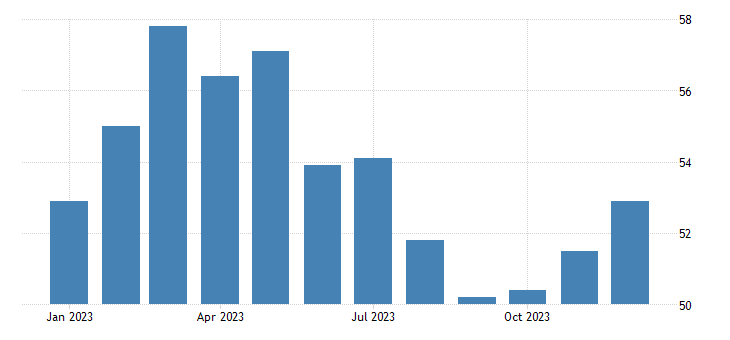
In other sectors there is stagnation (54.0):
Pic. 3
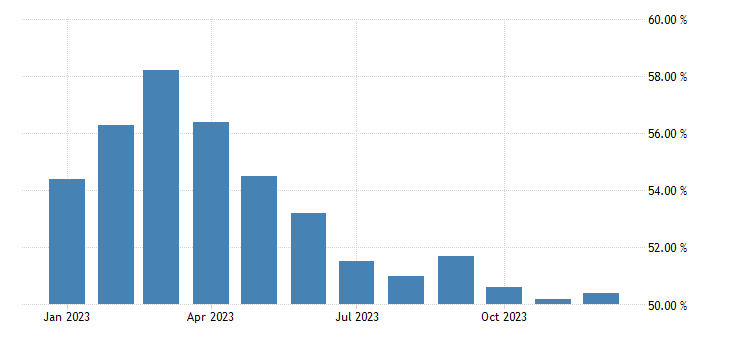
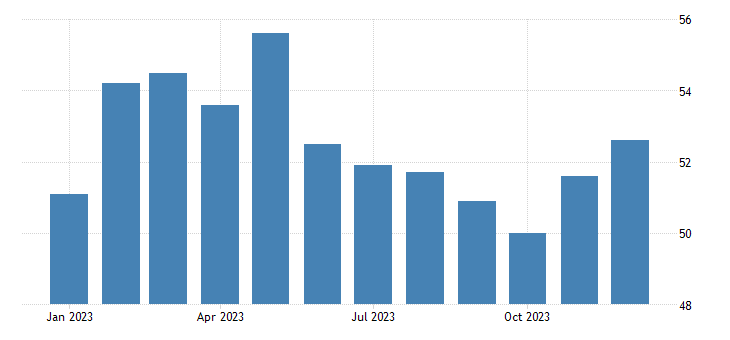
In the economy as a whole, the annual minimum is:
Pic. 4
Independent studies are less pessimistic – in the manufacturing sector 50.8:
Pic. 5
In the service sector, the 5-month maximum is 52.9:
Pic. 6
And the composite index is at its peak even in 7 months (52.6):
Pic. 7
We do not think that this is a way out of the crisis; rather, it is an injection of money into the economic system. In general, Chinese statistics are extremely complex and do not always adequately reflect reality. In any case, just like last spring, we are beginning to closely monitor the Chinese economy.
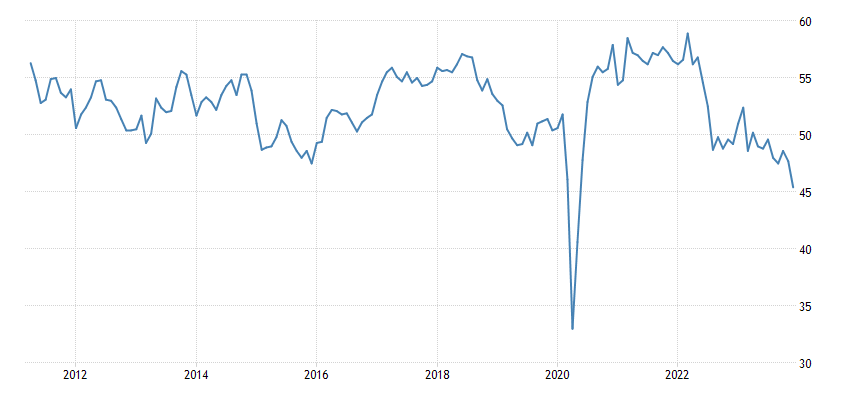
In France, the industrial PMI is the worst in history, except for 2020 (42.1):
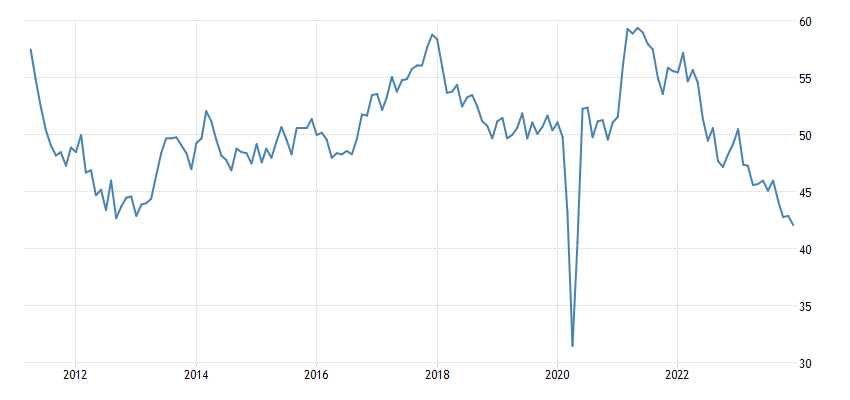
Pic. 8
The same picture is in Canada (45.4):
Pic. 9
Mortgage applications in the US -10.7% per week – the bottom for 10 months, despite the decline in loan rates:
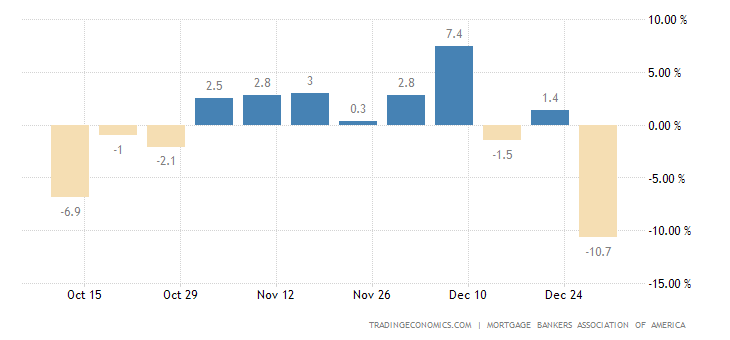
Pic. 10
Loans to households in the eurozone +0.5% per year – minimum since May 2015:
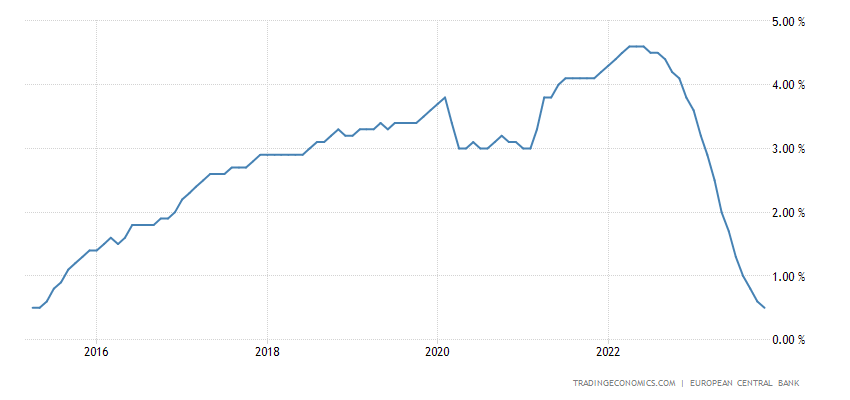
Pic. 11
The number of unemployed in Germany has increased for 11 months in a row:
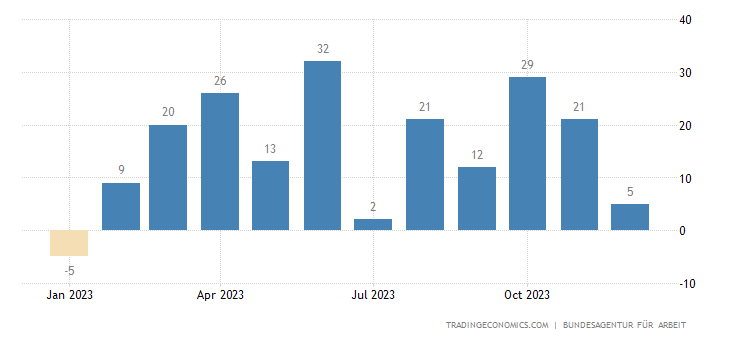
Pic. 12
And it reached an 8-year peak (not counting the rise of 2020):
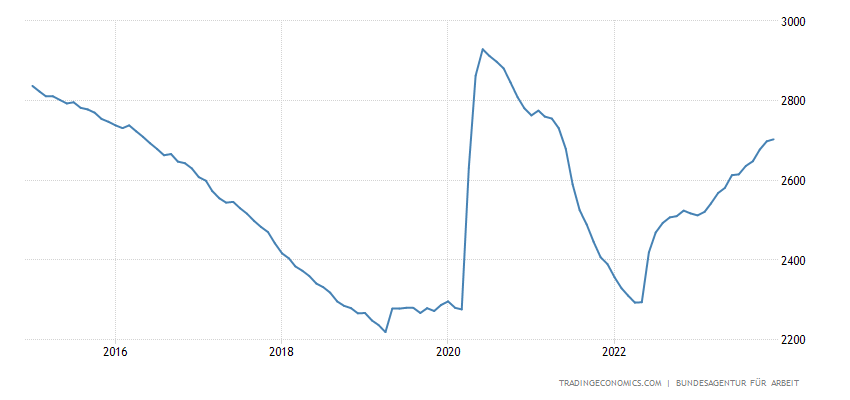
Pic. 13
As is the unemployment rate:
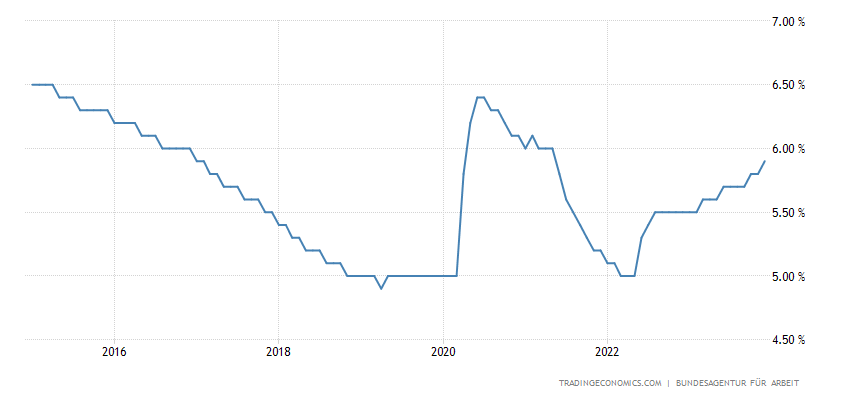
Pic. 14
Retail sales in Germany -2.5% per month – 19-month low:
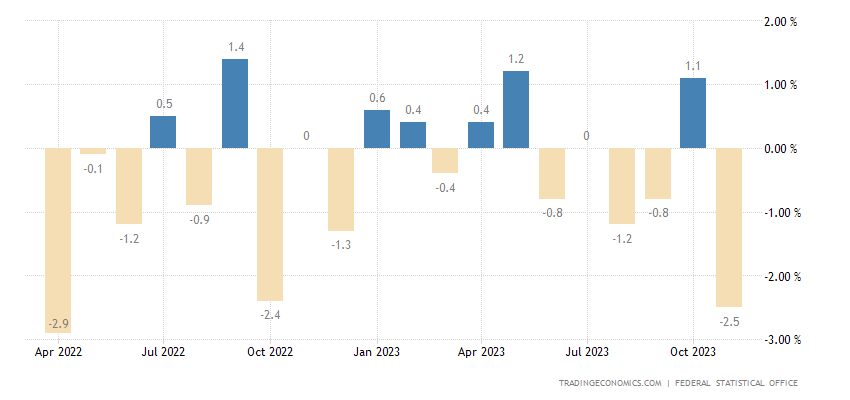
Pic. 15
And -2.4% per year – the 19th minus in a row:
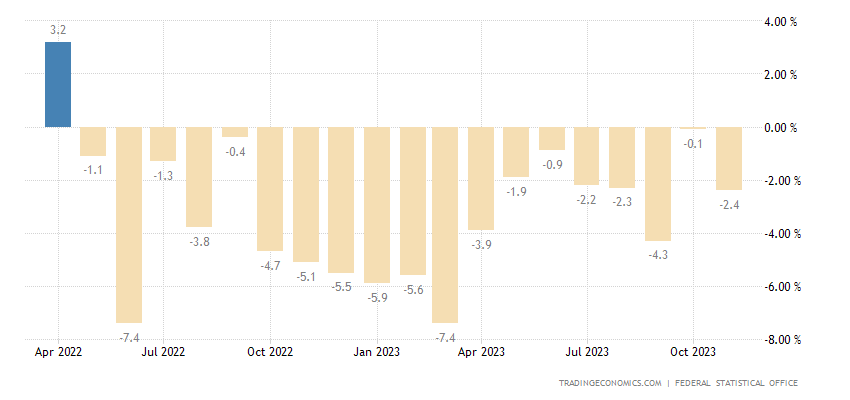
Pic. 16
Let us note that by the end of the year the situation seems to be improving. But in reality, given the rise in unemployment, this means an increase in government support for demand, which does not at all mean an improvement in the situation in the economy.
Job openings in the US are at their lowest in almost 3 years (but still above pre-pandemic levels):
Pic. 17
Main conclusions. As was already written in the first section of the Review, the structural crisis continues, slowly and inexorably. And, in connection with the beginning of the new year, it is necessary to say a few words about the results of the past year and forecasts for the new one. Based on the results, the following can be noted.
The Fed’s tough credit policy has reduced consumer inflation in the US to (almost) acceptable levels, but that’s official. In reality, taking into account statistical methods that actively reduce it, most likely, the real indicators are significantly, 5-7% higher than the official ones. Things are even worse in the industrial sector, where persistent deflation has established itself, a sign of industrial decline. Which, on a scale of approximately 2% per year, was also recognized by official US structures.
In reality, most likely (and in accordance with theory), the US is experiencing a decline in GDP, approximately 6-7% per year. It is compensated by a sharp increase in the value of financial assets, which, one way or another, are taken into account in GDP. It is impossible to explain otherwise the sharp growth (about 5%) of GDP against the backdrop of an industrial decline. Let us note that demand support does not have much effect on the US domestic economy, since demand is mainly satisfied by imported (Chinese) goods, and the service sector is quite conservative.
Let’s also say that the growth of PPI against the backdrop of deflation in the total volume of industrial output indicates that the share of imports in final demand is increasing.
The situation is similar in other developed countries. The EU recognized the scale of the industrial decline at 6%, that is, 0.5% per month! In reality, most likely, things are even worse. The decline in the EU is, of course, greater than in the US, but not so much, by 2 percent. That is, if in the US the decline is 6-7%, then in the EU it is 8-9%.
Note that the demand/money supply management model in the United States today is approximately the same as it was in Russia in 1996-98. (before the default). Demand is stimulated through the budget, but inside the economy there is a purely restrictive policy, withdrawal of money. Therefore, the key question is: when will the demand support system collapse and we will have to move to emission (the US will not declare a sovereign default).
Now let’s move on to a brief forecast. The key trend for 2024 is a continuation of the decline at the same pace. However, most likely, it is in the beginning of the year that the US monetary authorities will be forced to abandon strict monetary policy and switch to emission. At the same time, during the election campaign, a collapse of financial markets may occur.
We do not deal with political issues, but all experts unanimously say that it is very likely that neither Biden nor Trump will reach the final of the election race. As soon as the first of them comes down, it will inevitably cause powerful socio-political, and therefore financial, upheavals. Therefore, without saying anything about the timing, we argue that with a high probability, in the spring and summer of 2024, there will be a sharp drop in financial markets with a rise in the dollar exchange rate relative to other currencies and a change in the Fed’s monetary policy towards strong easing (emission).
At the same time, there will most likely not be a sharp decline in the real sector! The structural crisis may accelerate slightly (in the USA from 6-7 to 8-10%), but all processes will continue. But the structure of demand will begin to change more intensively in favor of the “middle” class moving into poverty. In any case, the corresponding processes will take several more years, so that everyone who is ready for such upheavals will be able to quickly adapt to them.
In conclusion, we congratulate all our readers on the upcoming New Year and wish them success and prosperity, including through our reviews!