
December 9-15, 2023
Big news. The US Federal Reserve left the base rate in the range of 5.25-5.50%; The rate forecast has been reduced – by the end of 2024, 3 cuts are now expected instead of the previous one. The head of the American Central Bank made it clear that he is not even going to wait for inflation to reach the target of 2% to begin easing policy.
This is quite natural, taking into account the data on industrial dynamics. In particular, data on prices for the full volume of industrial goods showed the continuation of deflation, the trend towards its reduction has ceased:
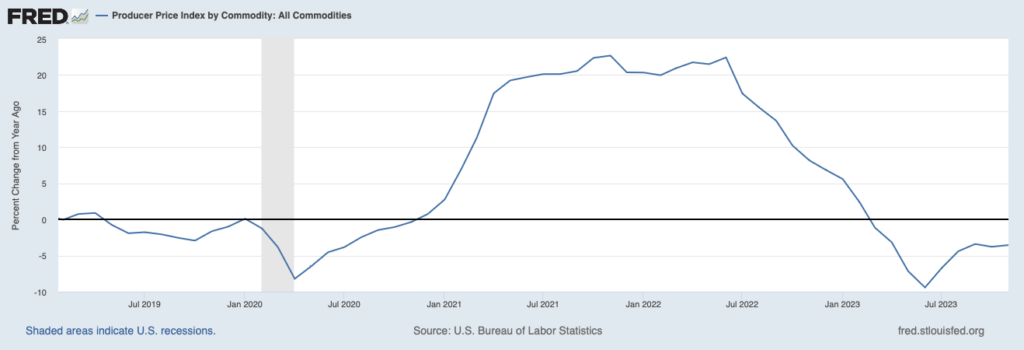
This suggests that industrial stagnation continues (see next sections) and continuation of high rates would cost a lot to the US economy. Especially in a situation where it is necessary to pursue an active (or even aggressive) policy in Southeast Asia in a situation of acute confrontation with China.
In general, it can be noted that the basic problem of the US economy – the impossibility of transferring investments into the real sector at the expense of the domestic market resource (who will buy products made at new industrial enterprises) – has not yet been solved. This creates big problems, since the industry is not even stagnating, but simply declining. Especially if you take into account real data, and not official indicators heavily embellished with various statistical tricks (such as hedonic indices).
Macroeconomics. Chinese data for November is mixed.
Investments in fixed assets +2.9% per year, not counting the failure of 2020, this is an anti-record for 29 years of observation:
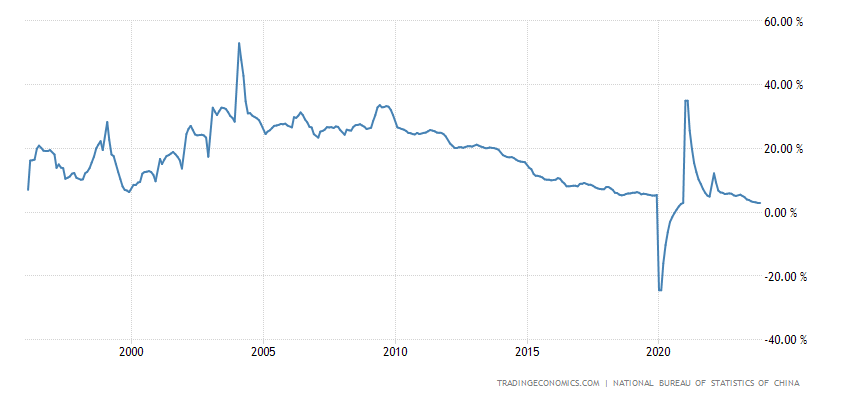
Рис. 2
Industrial production +6.6% per year, maximum for 21 months:
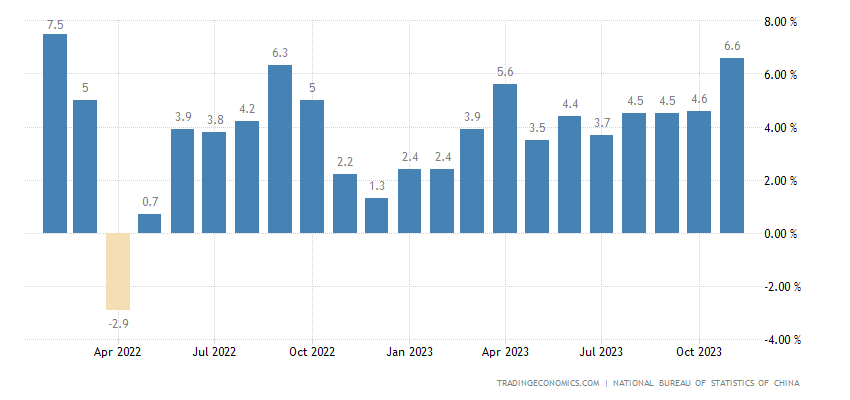
Рис. 3
Retail sales rose to a 6-month peak of +10.1% y/y, but only from a low base a year ago:
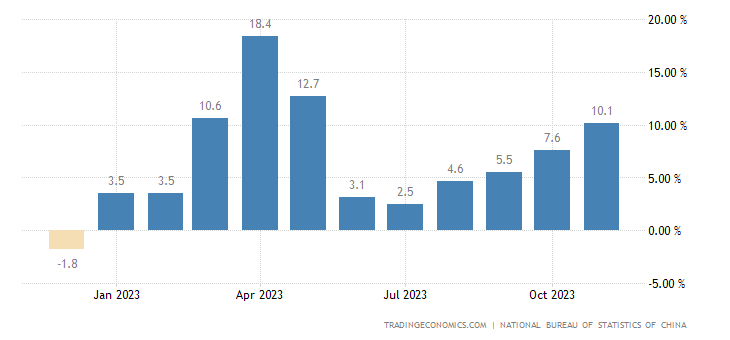
Рис. 4
To stimulate the slowing economy, the Central Bank of China made record net injections through a system of medium-term loans (800 billion yuan per month):
Рис. 5
In general, a colossal bubble is inflating in the Chinese economy. And if you also take into account the fall in exports, everything becomes even more complicated:
New Zealand GDP -0.3% per quarter, 3rd minus over the last 4 quarters:
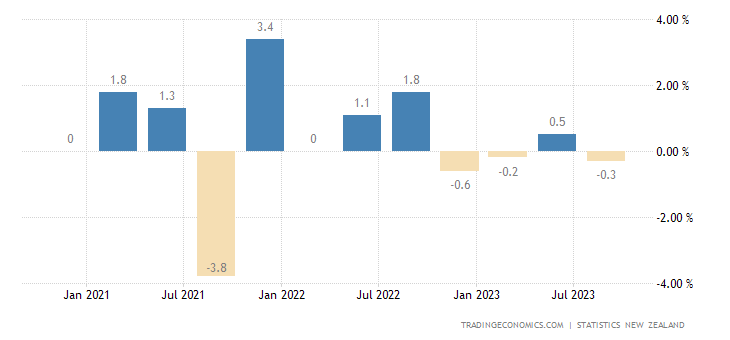
Рис. 7
And -0.6% per year, without taking into account the Covid crisis, this is the worst dynamics since 2009:
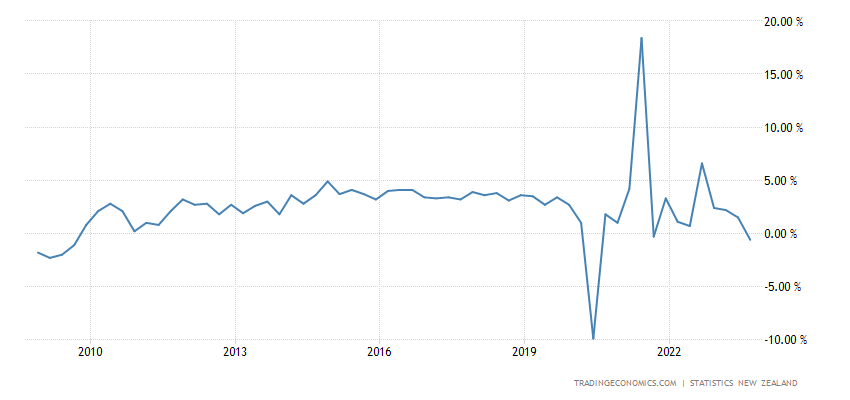
Рис. 8
Industrial production in Saudi Arabia -12.3% per year. Not counting Covid, this is the bottom for 38 years:
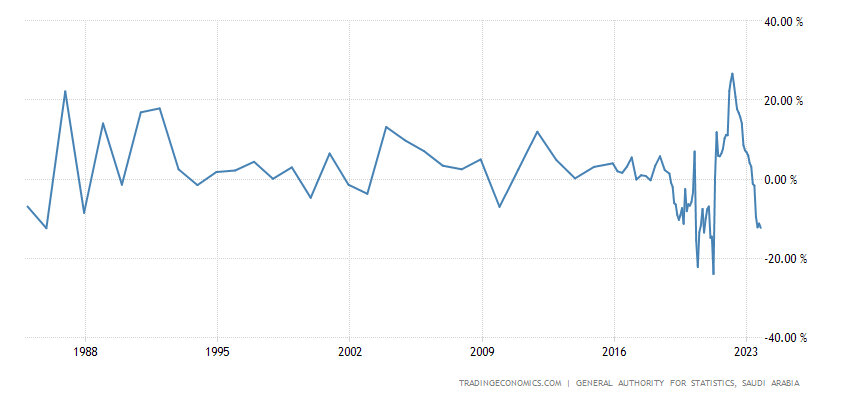
Рис. 9
In the eurozone -6.6% per year – the 8th minus in a row:
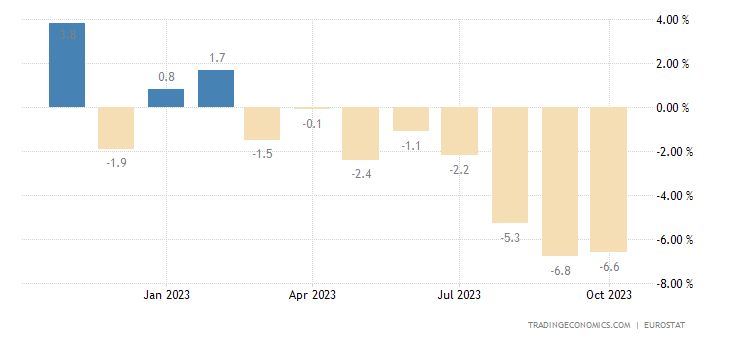
Рис. 10
In monthly terms, this means a drop of 0.5% every month! The trend of deindustrialization, which we talked about in the last review, has manifested itself in full.
In the USA -0.4% per year, 4th minus in a row:
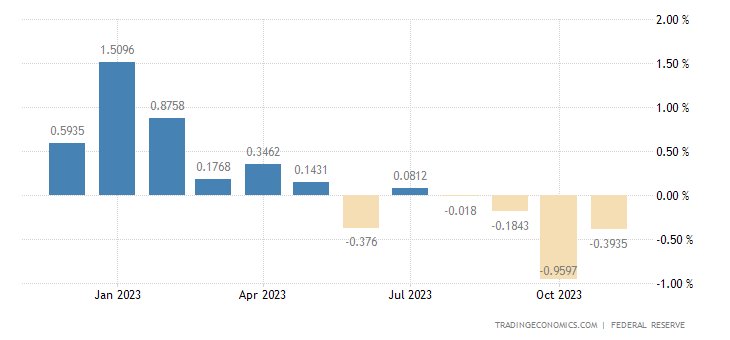
Рис. 11
Including for manufacturing industries -0.8% per year, the 9th minus in a row:
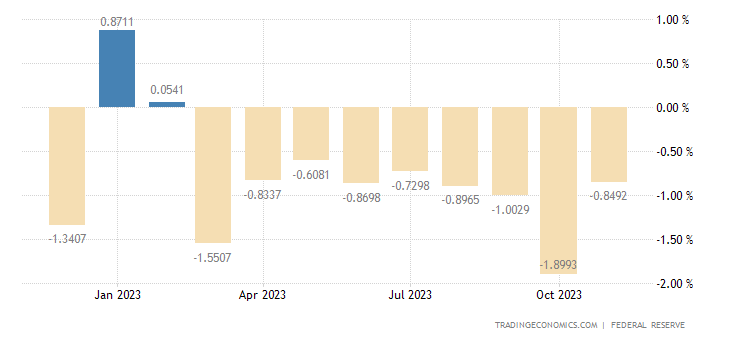
Рис. 12
This is also deindustrialization, especially if you take into account the statistical features. The graph given in the first section of the Review confirms this. It seems that monthly data is better, but more on that in the last section of the Review.
Engineering orders in Japan -2.2% per year, 8th minus in a row:
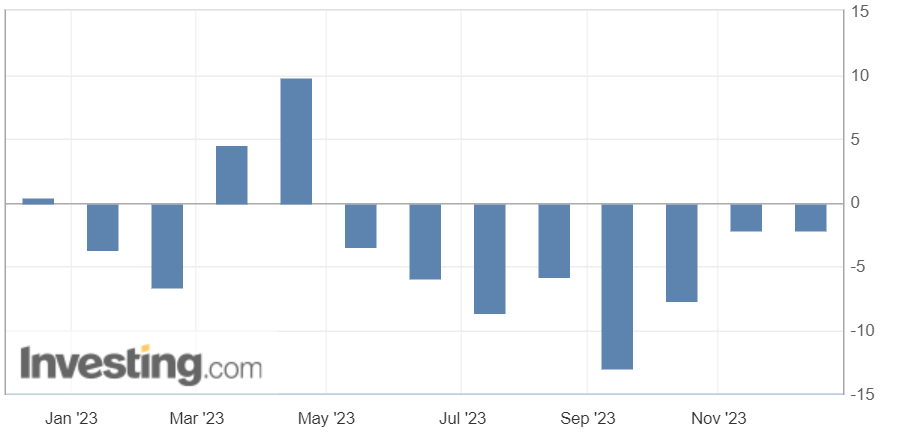
Рис. 13
PMI (expert index of industry condition; its value below 50 means stagnation and decline) of Japanese industry (47.7) is the worst in 3 years, and without taking into account covid – in 11 years:
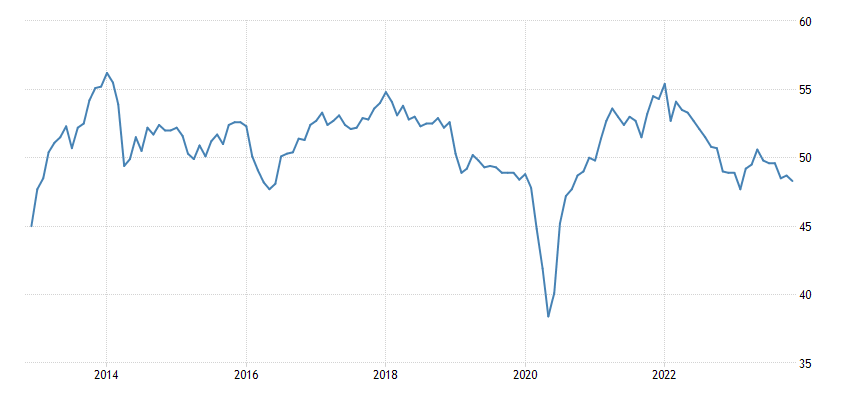
Рис. 14
In France (42.0), the bottom has lasted 3.5 years, and excluding the failure of 2020, it’s a record for 13 years of data collection:
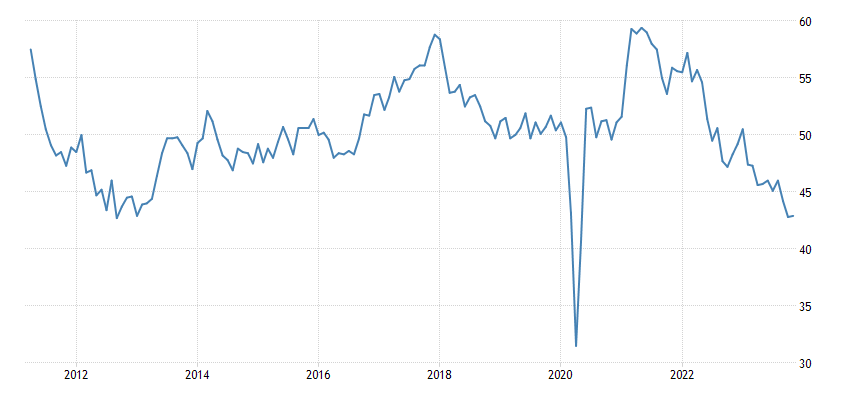
Рис. 15
Business confidence in Australia, excluding the Covid period, is the worst since 2009:
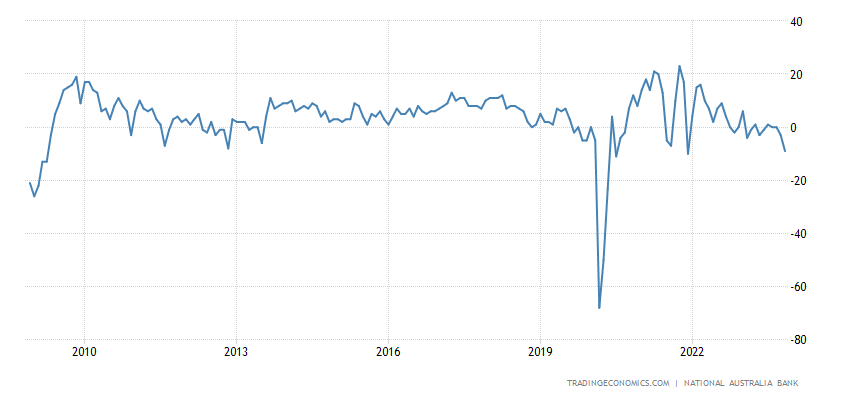
Рис. 16
CPI (China Consumer Inflation Index) of China -0.5% per month, minimum since November 2020. And minus Covid – since March 2018:
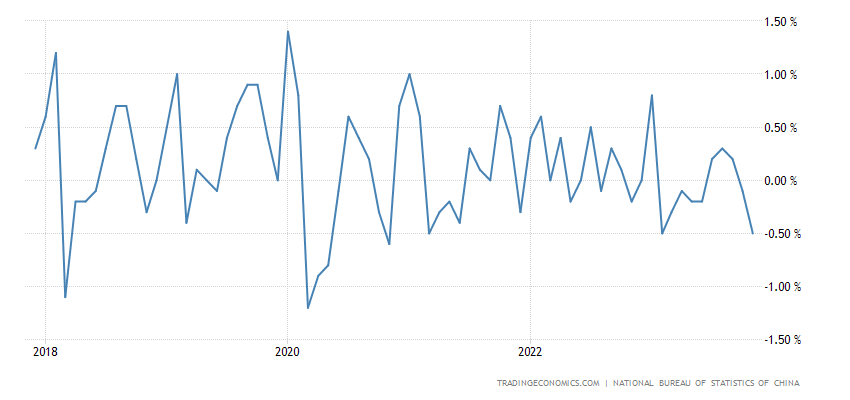
Рис. 17
And -0.5% per year – the weakest dynamics since 2009:
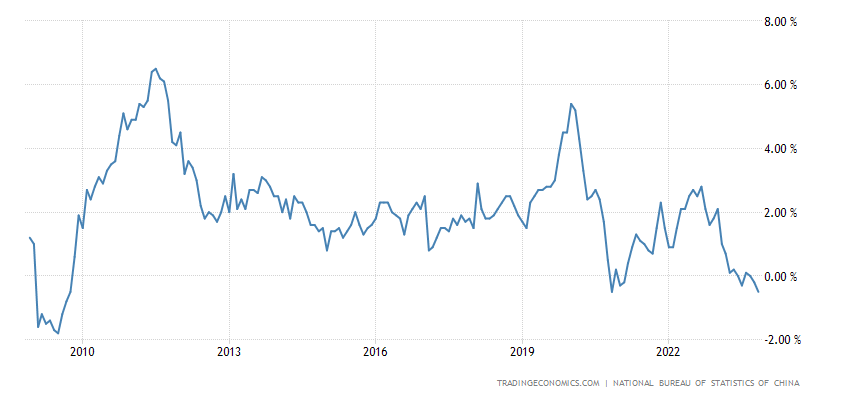
Рис. 18
PPI (industrial inflation index) of China -3.0% per year – 14th minus in a row:
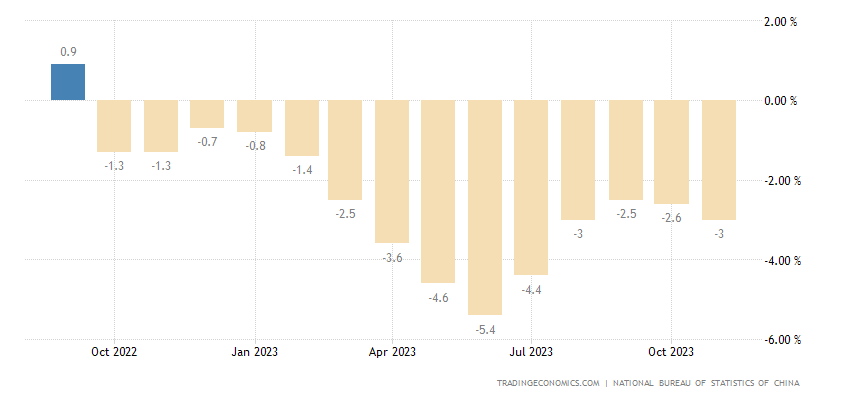
Рис. 19
There is general deflation, a sign of real economic decline.
Annual loan growth in China (+10.8%) is the lowest in almost 22 years:
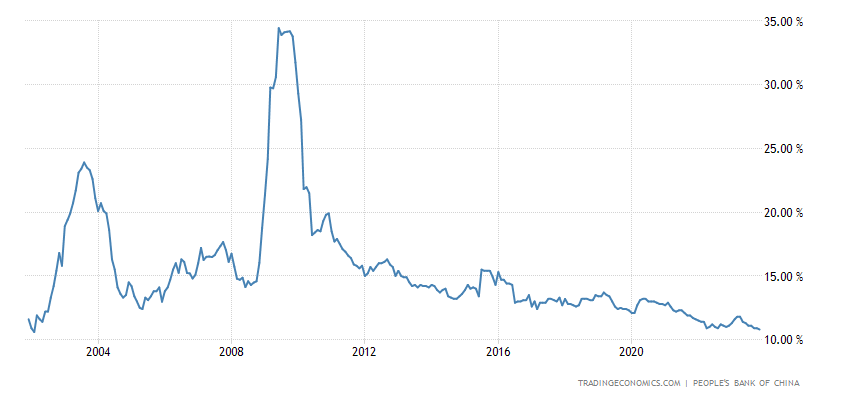
Рис. 20
But in India it (+20.8%) is a record for all 12 years of statistics:
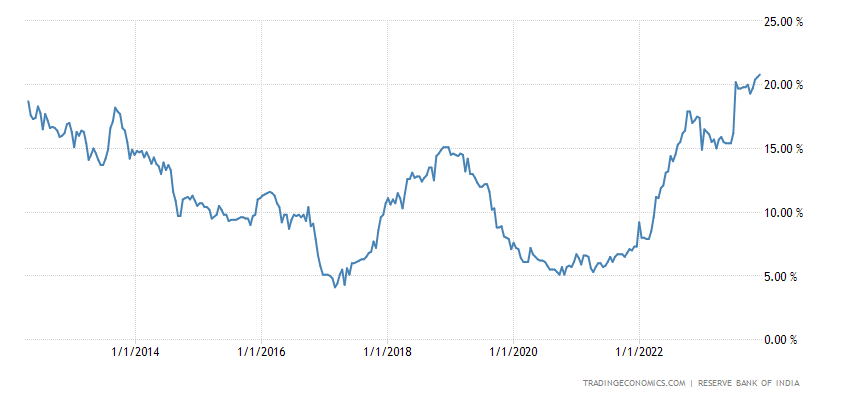
Рис. 21
That is, in China the potential of the domestic market is completely exhausted, but in India it is absolutely not.
Argentina CPI +12.8% per month, a record for 10 years of data collection:
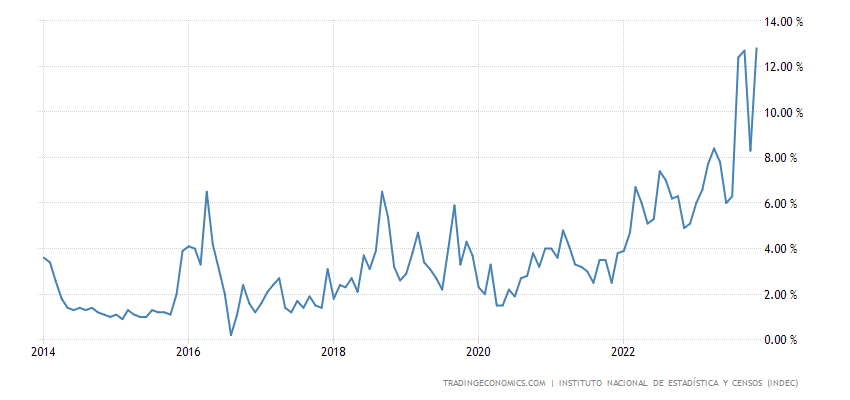
Рис. 22
And +160.9% per year – 33-year high:
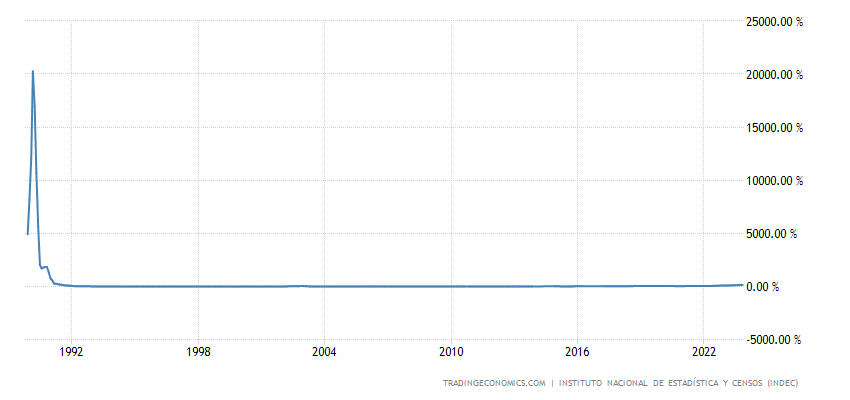
Рис. 23
However, the Central Bank of Argentina left the rate the same and equal to 133%, despite the fresh 2-fold devaluation of the peso, which will add another 20-40% to the CPI:
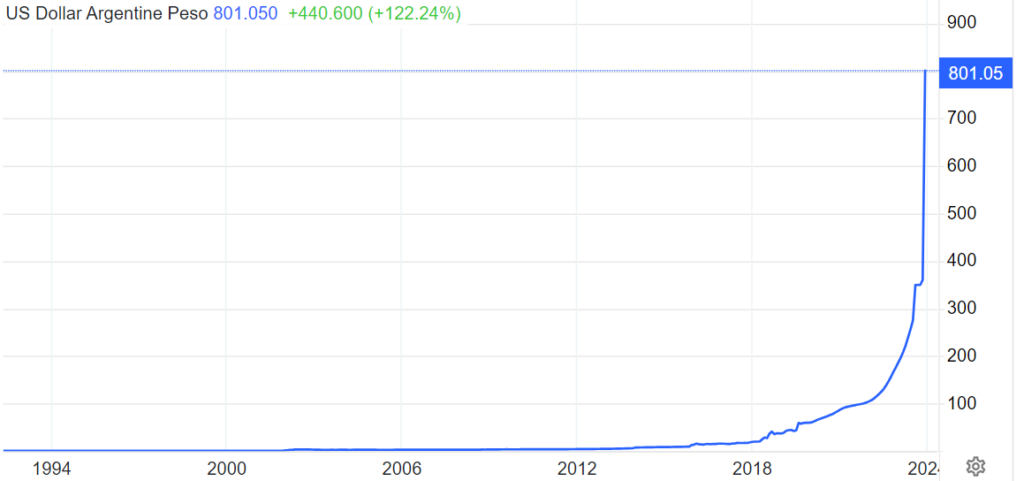
Рис. 24
The ECB also did not change anything, except for the imminent completion of the bond purchase program. The Bank of England is doing the same, as is the Central Bank of Switzerland and the Central Bank of Mexico.
The Norwegian Central Bank raised the rate by 0.25% to 4.50%, but made it clear that it was ending the tightening cycle. And the Central Bank of Brazil cut the rate by 0.50% to 11.75%.
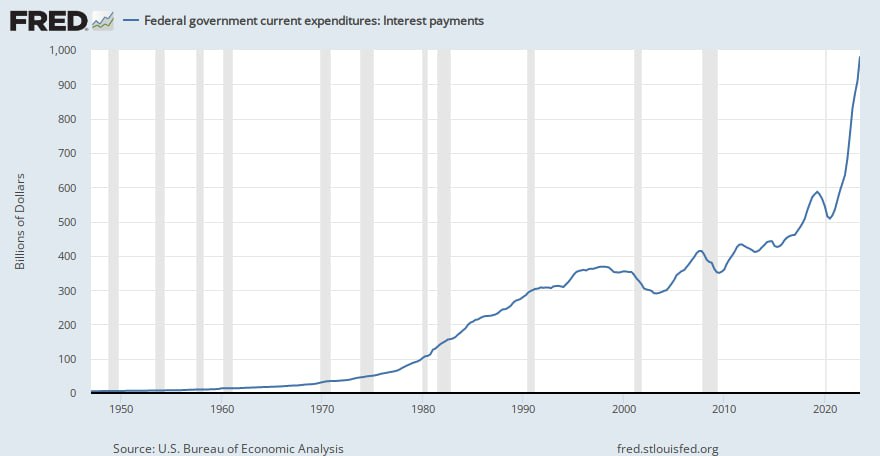
Main conclusions. The US federal budget debt continues to grow rapidly:
At the same time, monthly data on industry (+0.24% m/m), in contrast to the annual data that we presented in the previous section, looks more optimistic. But taking into account that the data for October was revised downward by 0.3%, the final result was negative.
Several weeks ago we already presented Pavel Ryabov’s data on American industry. We will not repeat it, let us only recall that the level of industrial production in November 2023 is at the same level as in December 2007 (pre-crisis maximum) and approximately 1-2% lower than the local maximums formed in December 2014, December 2018 and September 2022 .
In fact, industrial activity has hit the ceiling for the fifth time without any results. At the same time, growth was noted only in knowledge-intensive segments, including those related to the military-industrial complex, for example, “Aerospace and transportation equipment” – plus 14.8%, but if we compare Jan.-Nov.23 with Jan.-Nov.19 it turns out that production is now at 2.7 % below. No significant activity has been identified in the military-industrial complex, but in general, these segments are better than others.
At the same time, data on the IT sector is most distorted by hedonic indices and active stock speculation, so the real picture can be much worse.
We will not cite the speech of Fed Chairman Powell, since he did not give anything new compared to previous discussions (except for hints on a rate cut). In general, one gets the feeling that everyone has frozen until the onset of some critical events, perhaps not even related to the economy (for example, the resignation of the US President). Of course, it will have a serious impact on the economy, but we will not analyze such options here.
And in conclusion, we wish our readers a fun and almost pre-holiday weekend and hope that the work week will not spoil these upcoming holidays!