
May 28 – June 2, 2023
Big news. No doubts — top news is a decision to raise the public debt limit (formally, to cancel it for two years). But it is not interesting in itself, here, as we wrote earlier, there was no problem at all. Interest in the topic is due to the fact that it was used to solve a fundamental problem – to force the White House, the Biden administration, to make two key decisions for the United States. One economic and one geopolitical.
Let’s start with the second, especially since it also has fundamental economic consequences. The US must decide whether to leave Europe as its key region of control (as a whole, as part of the world) or switch to Southeast Asia. The first option practically guarantees that China will quickly capture Southeast Asia, after which it will become almost impossible to stop it with US forces.
This scenario practically guarantees that the United States will leave not only from the position of the world leader, but also, in the interval of 15-20 years, even from the position of one of the 4-5 equal world leaders. In addition, it closes the possibilities of AUKUS industrialization, which is actually the only scenario for the US strategic development today (after the collapse of the liberal model of globalization). But on the other hand, it allows you to save NATO and, possibly, even close any opportunities for Russia to interact with Western Europe.
In addition, this option is much more understandable and pleasant for the old liberal elites, who grew up hating the USSR/Russia, and for the new liberal elites, who are accustomed to interaction (often corrupt) with China.
The second option involves closing costly scenarios in Europe (building a “barrier” between Russia and Western Europe, from Finland to Turkey; supporting NATO; supporting the euro through loans to the Eurocentral Bank, etc.) and starting work to limit China’s ability to enter world markets. To do this, it is necessary to destroy the statehood of Burma and Laos as much as possible and create a “security arc” from the Philippines to Japan, which will limit the exit of Chinese goods to the Pacific Ocean. At the same time, it is still desirable to limit the exit of Chinese ships to the Pacific Ocean through the Sea of Okhotsk, which is controlled by Russia.
At the same time, there is no need to fear a critical strengthening of Russia. Yes, Ukraine in this case will definitely come under the control of Russia, as well as, very likely, the Baltic states and Moldova. But, taking into account the need to industrialize Russia and “digest” these territories, where Russophobic ideology has been actively developing for several decades, even Russia’s hands will reach the countries of Eastern Europe only in 20 years. If the United States manages to industrialize AUKUS during this time, they will return to Europe if not, this question will lose its relevance.
From the point of view of indirect signs, there are two signals that the decision has been made, at least at the informal, elite level. This is the US refusal to support the opposition to Erdogan in the second round of elections in Turkey (Erdogan will not close any “barrier” against Russia) and the statement of the hero of the day Henry Kissinger that confrontation between China and the United States in Southeast Asia will sharply intensify in the near future. If so, by the end of the summer this decision will be legalized in the public sphere, with the corresponding consequences.
Now back to the first question, whether there will be a tightening or easing of monetary policy in the US. As we wrote a lot, the last public speeches of the head of the Fed Powell were close to hysteria. Because any decision that the Fed can make takes on an overtly political connotation. And there are no good ways out of the situation.
The format that can be assumed in the framework of the agreements on the state debt limit gives reason to assume what the policy of the US monetary authorities will be. Since $50 billion in spending cuts while being allowed to borrow $4 trillion in two years looks wild enough, we can suggest the following. Until the end of the year alone, the Treasury should borrow at least 1.5 trillion. And this is a colossal burden on the US monetary system, and in the mode of tightening monetary policy.
Yes, the budget will return this money to the economy, but to selected industries, enterprises and households. In other words, for most of the economy, access to money will become more difficult (tightening monetary policy, fighting inflation), but for the most needy part, on the contrary, support will be provided. The question is whether this will be enough to reduce inflation, but if not enough, then the rate can be raised. But less than it could be.
Of course, this scenario will only work if the Treasury takes money from the market. But, as far as we understand, this option is not yet envisaged.
Thus, there is reason to believe that the answers to both fundamental questions have been found (albeit not yet announced) and in this sense it makes no sense to keep the threat of a technical default. What we saw.
Macroeconomics. Labor productivity in the United States in the format has been declining for 5 quarters in a row year by year – this has never happened before
once in all 75 years of keeping statistics:
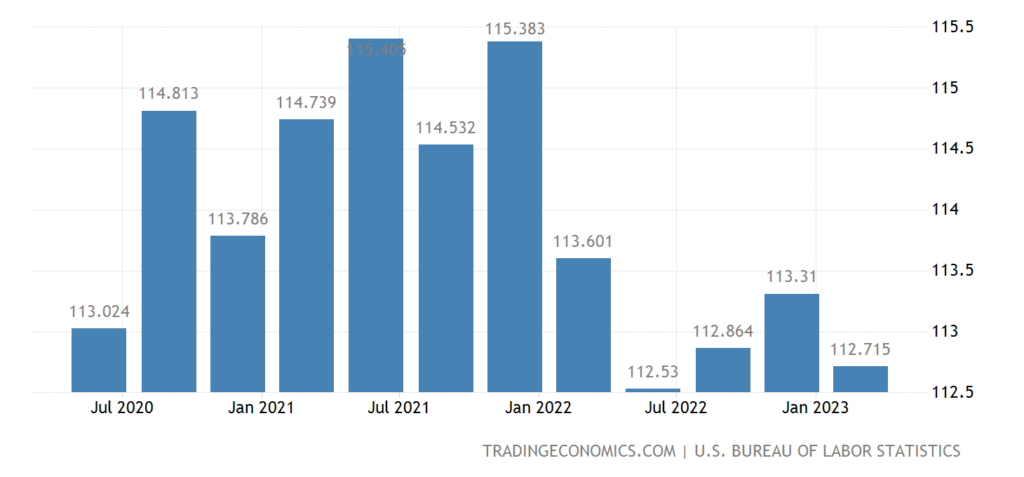
Pic. 1
The symptom is complex, but, most likely, it correlates with the general degradation of the economy. In any case, if the re-industrialization in the US began, most likely, productivity would increase.
Industrial production in South Korea -8.9% per year – the 7th negative in a row:
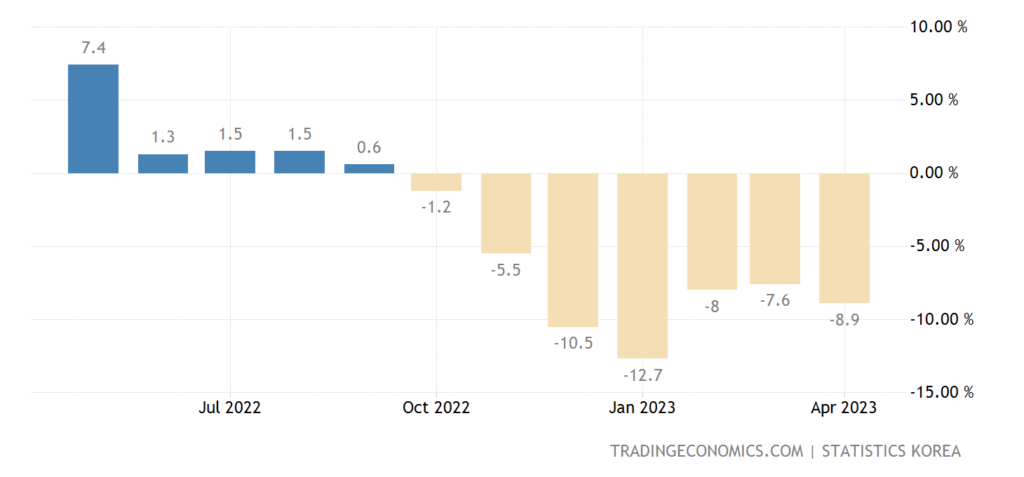
Pic. 2
In Japan -0.3% per year – the 6th negative in a row:
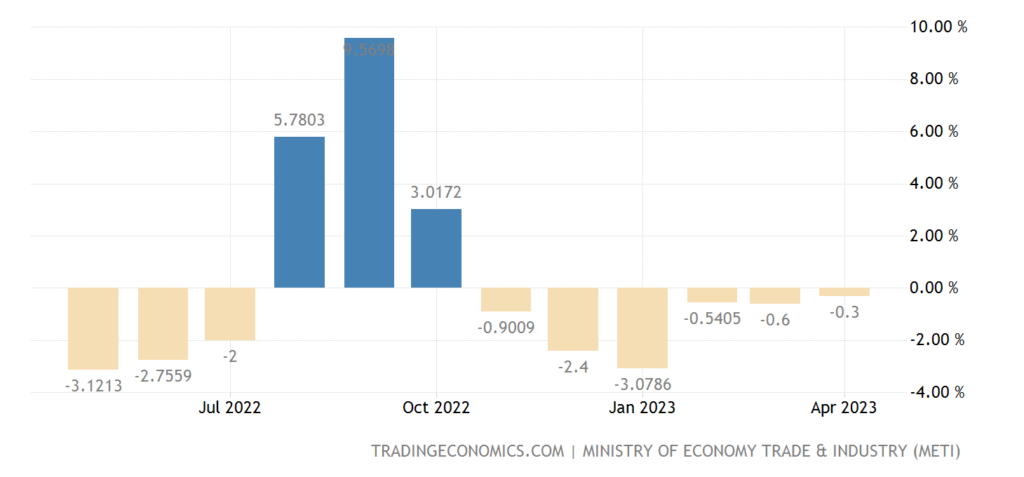
Pic. 3
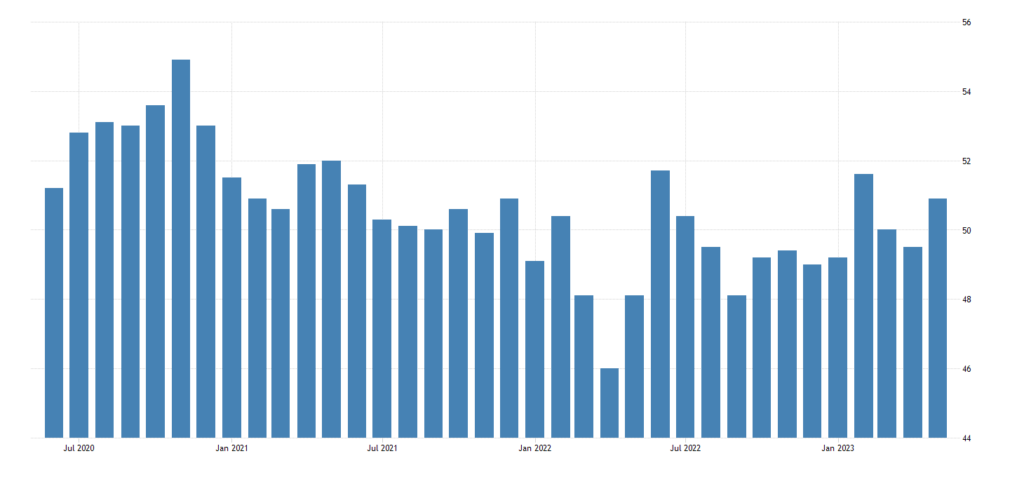
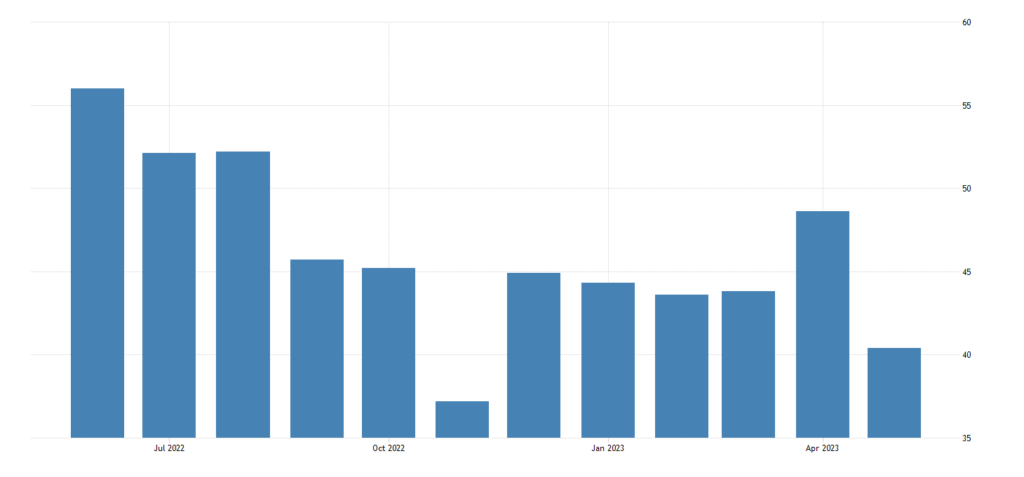
We continue to understand the Chinese economy. The official PMI (an expert index of the state of the industry; its value below 50 means stagnation and recession) of China’s industry has deepened into a recession zone (48.8), the worst in 5 months:
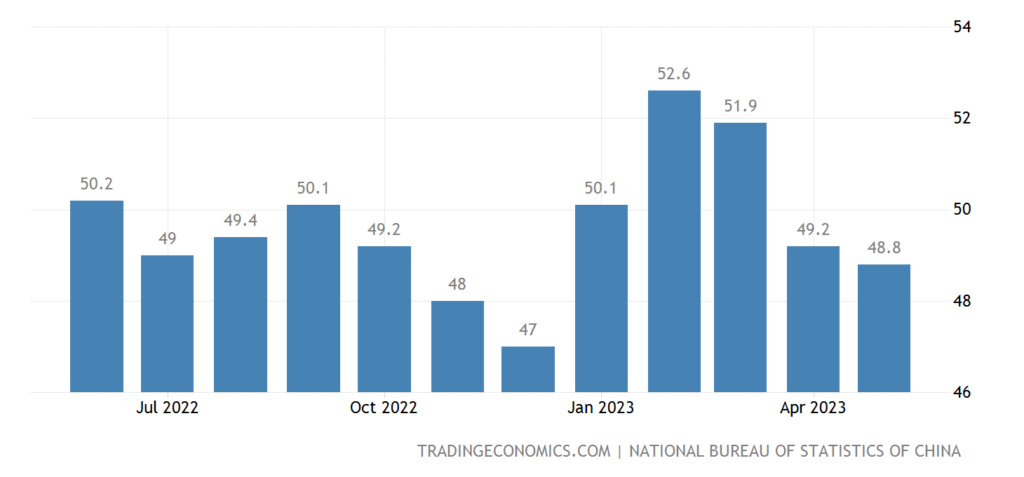
Pic. 4
Independent estimates are much better (50.9), but contradictory, new orders are the highest in 2 years, but the decline in employment is the strongest in 3 years:
Pic. 5
Eurozone industrial PMI 44.8 – excluding the failure of 2020, this is the bottom since 2012:
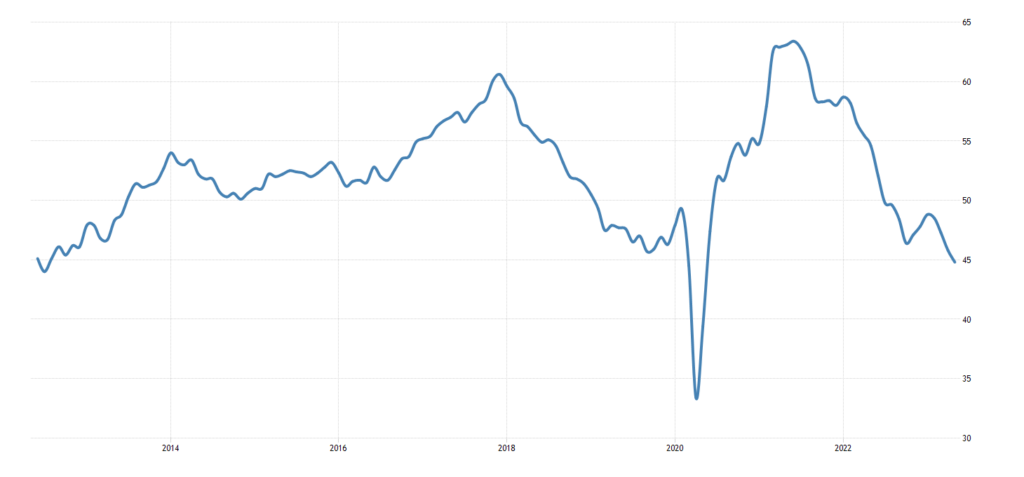
Pic. 6
In Sweden, 40.6 is the minimum since 2009:
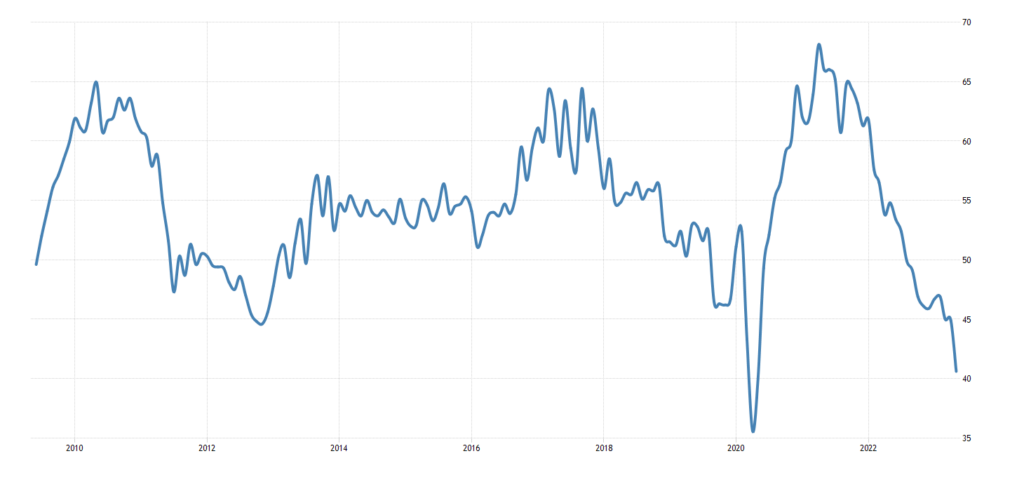
Pic. 7
The same in Switzerland (42.3):
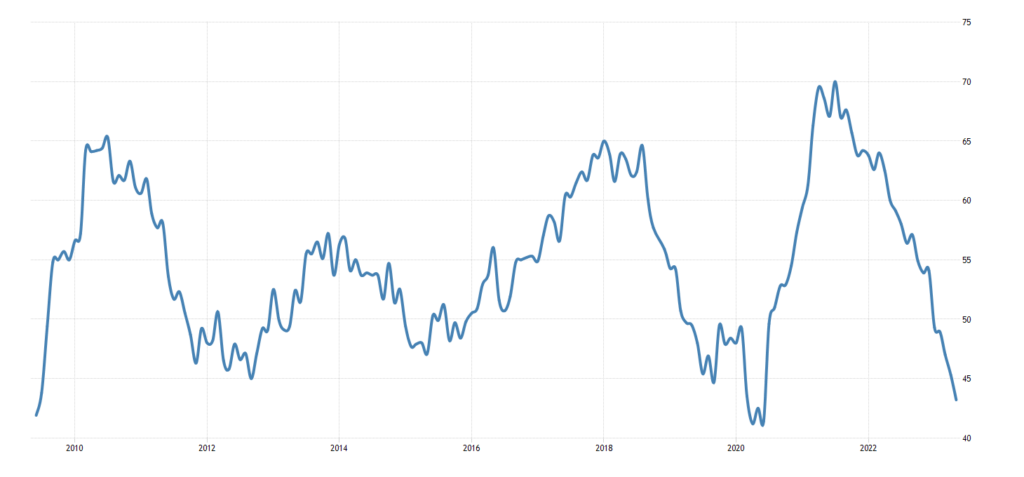
Pic. 8
Swiss leading indicators are at the bottom for half a year and 10% below long-term averages:
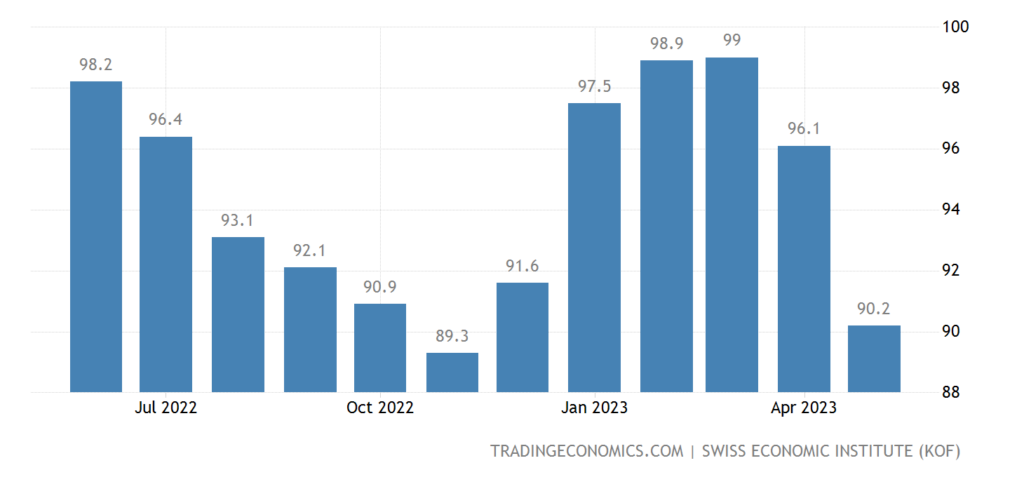
Pic. 9
Economic sentiment in the eurozone is the worst in six months:
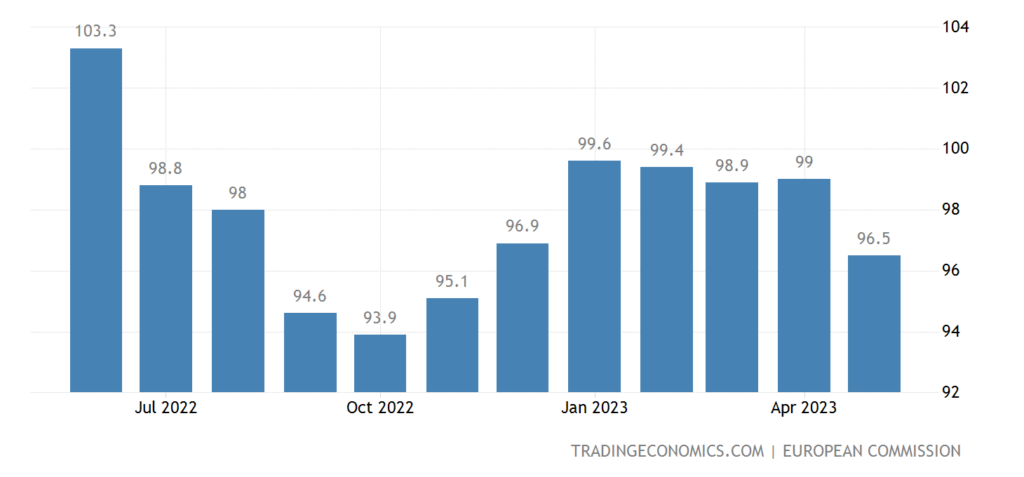
Pic. 10
The same is true for services:
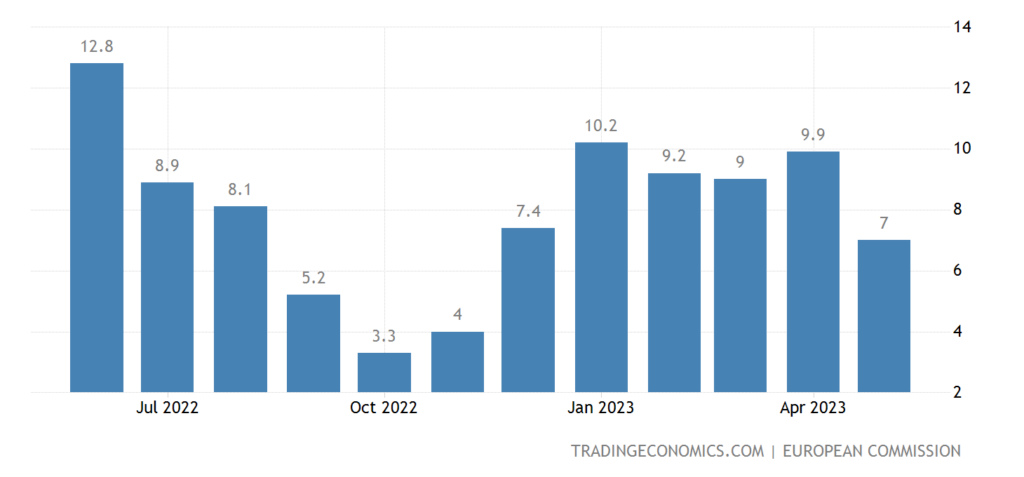
Pic. 11
And in the industry for at least 2.5 years:
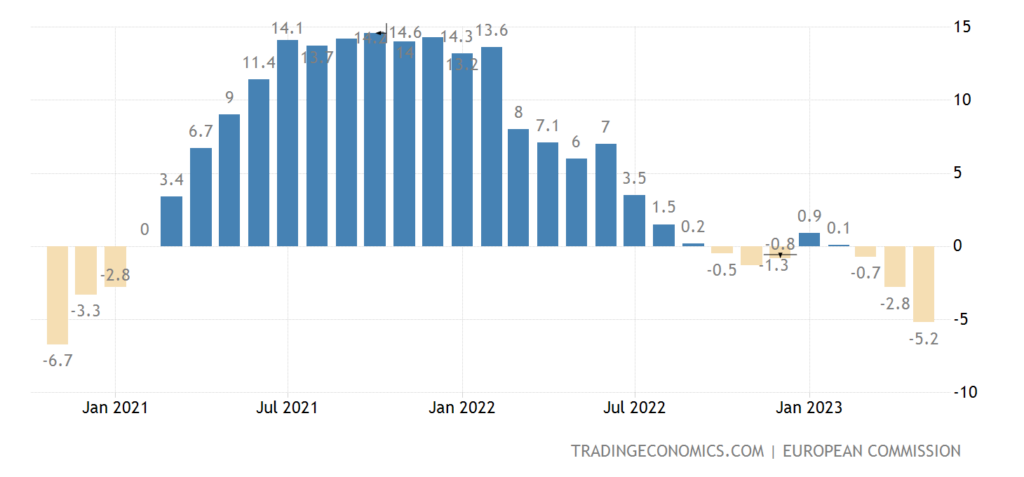
Pic. 12
Chicago PMI is the weakest in 5 months (40.4), in the decline zone for 9 months in a row:
Pic. 13
The index of industrial activity in the Texas Fed zone has updated the 3-year bottom, before such numbers were only at the beginning of 2016:
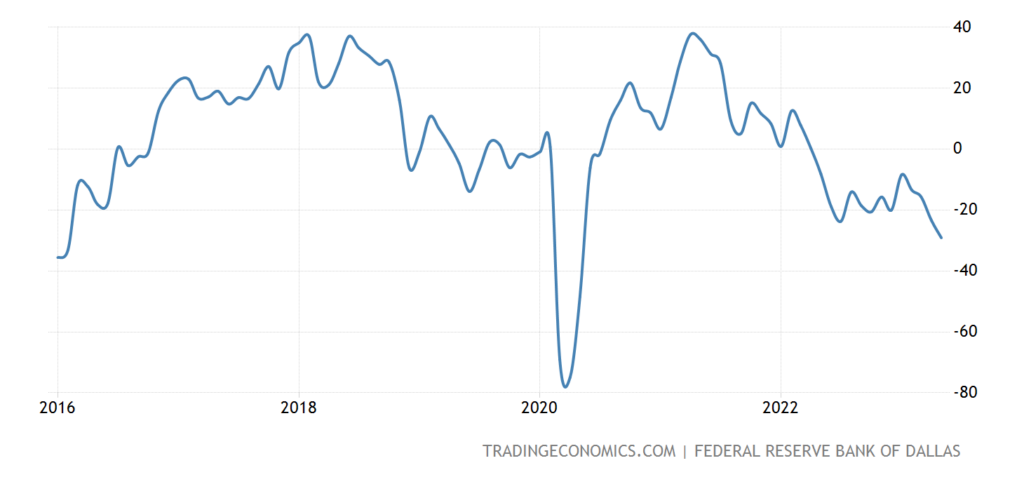
Pic. 14
The service sector of the same region has been in the negative zone for 12 months in a row:
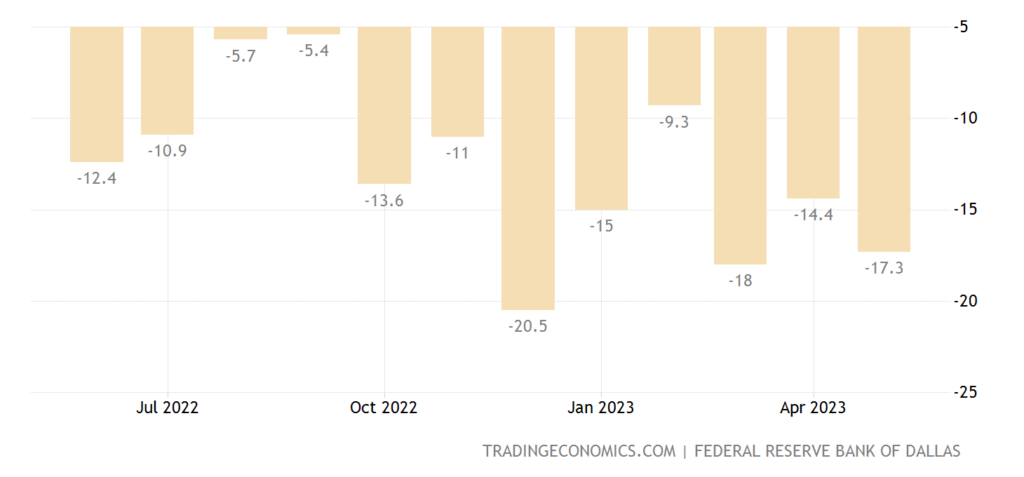
Pic. 15
Please note that the situation is similar in the areas of responsibility of all regional reserve banks. So the picture reflects the situation across the US.
The number of new buildings in Japan -11.9% per year – the 3rd negative in a row and the weakest figure in 3 years:
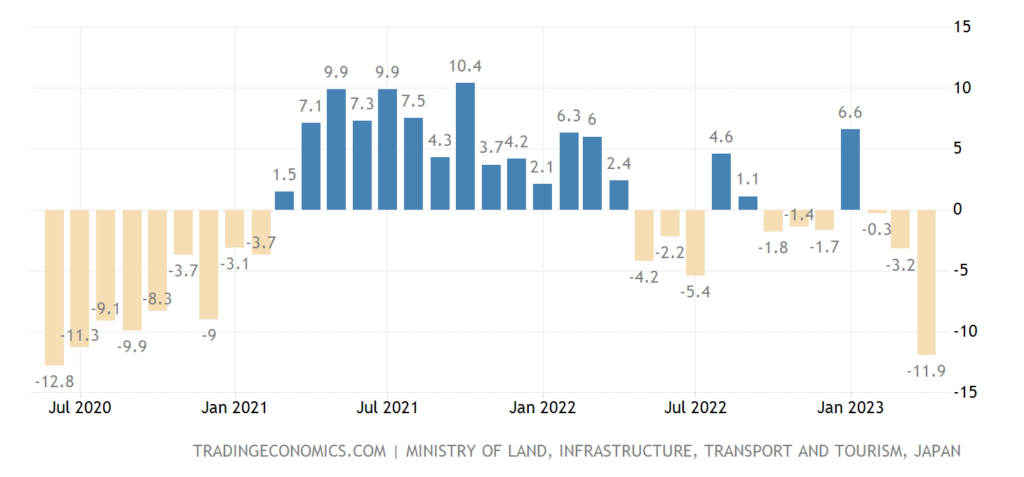
Pic. 16
Building permits in Australia another -8.1% per month:
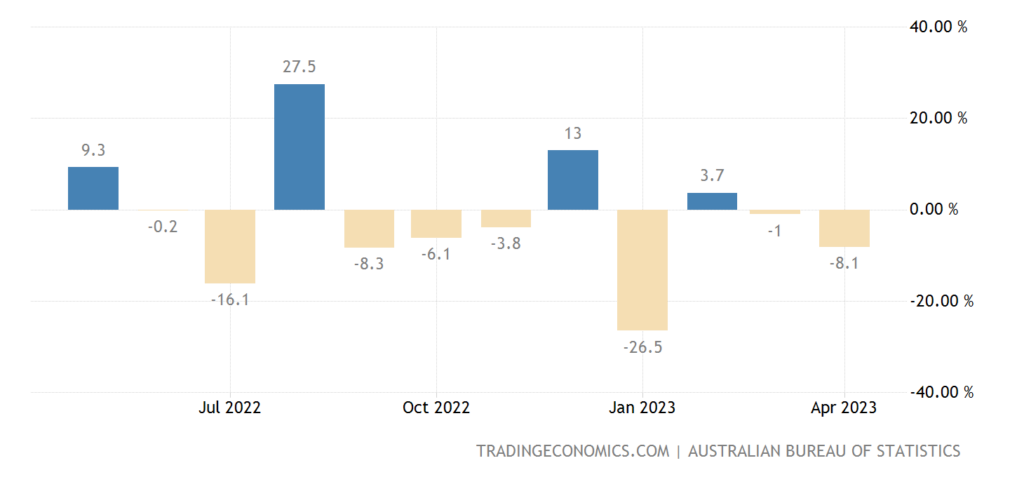
Pic. 17
And -24.1% per year — the 19th negative in a row:
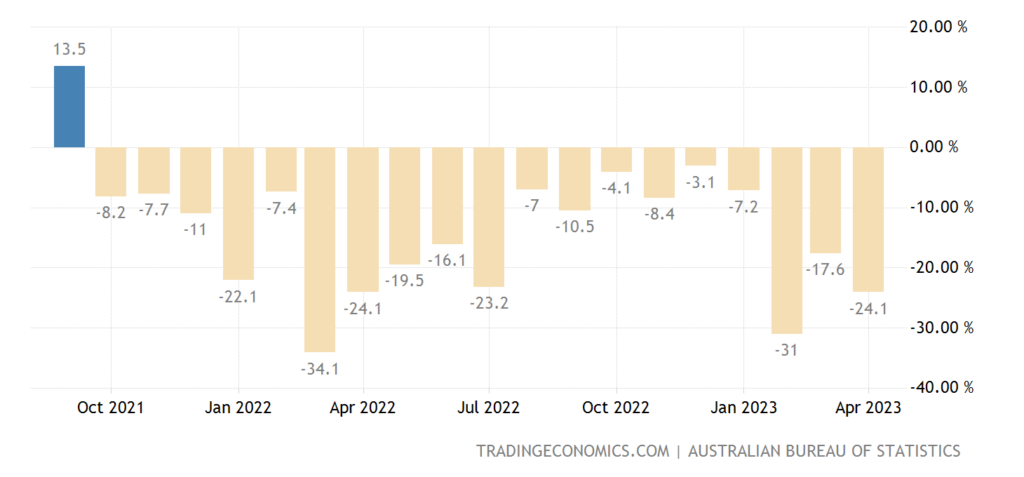
Pic. 18
to the lows of 2011/12 – the lows of 2009 are not far away either:
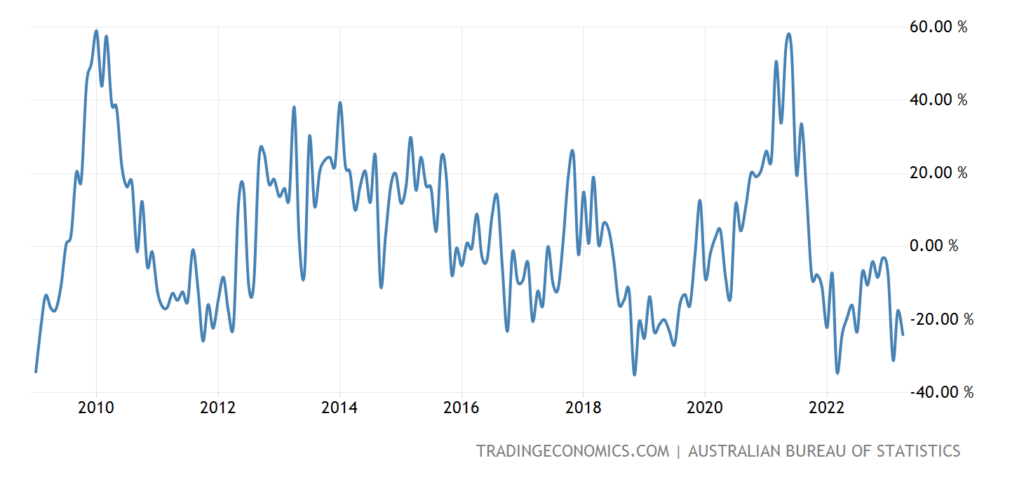
Pic. 19
Mortgage applications in the US have been falling for 3 weeks in a row:
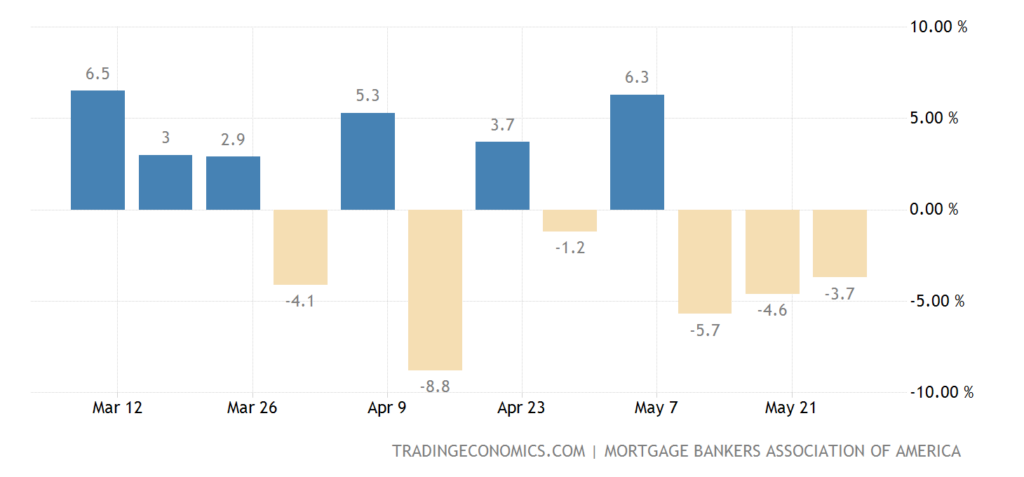
Pic. 20
Because lending rates are back at 22-year highs last fall (6.91%):
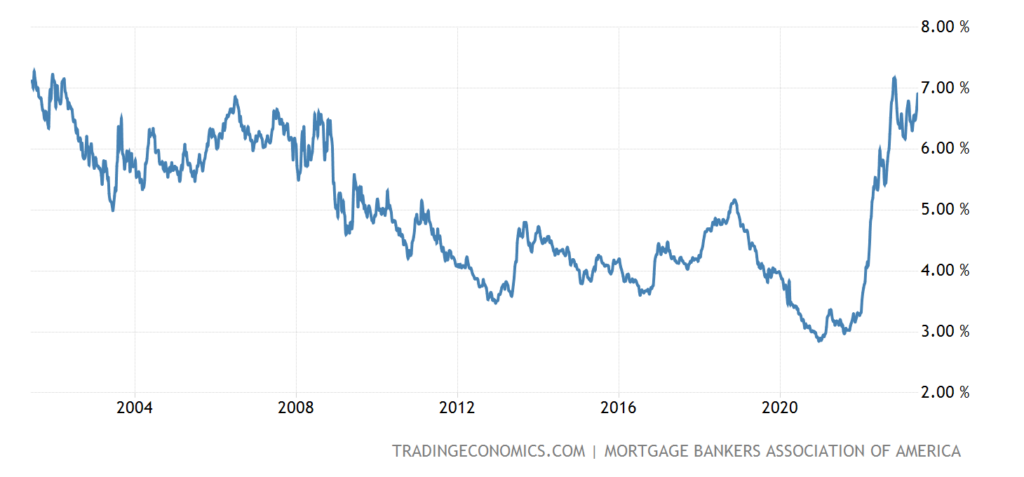
Pic. 21
US house prices (S&P/Case-Shiller survey) -1.1% per year – the weakest figure in 11 years:
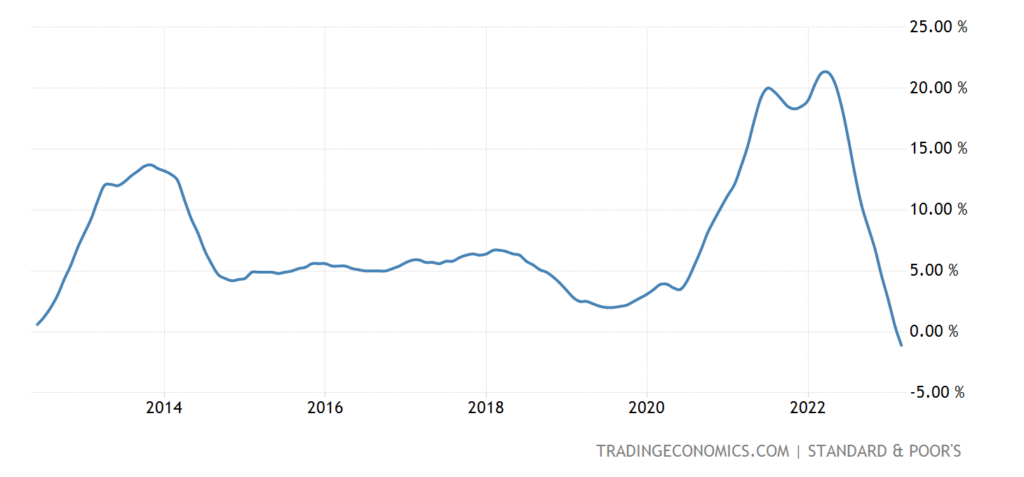
Pic. 22
According to official data, it is still positive (+3.6% per year), but also at least since 2012 –
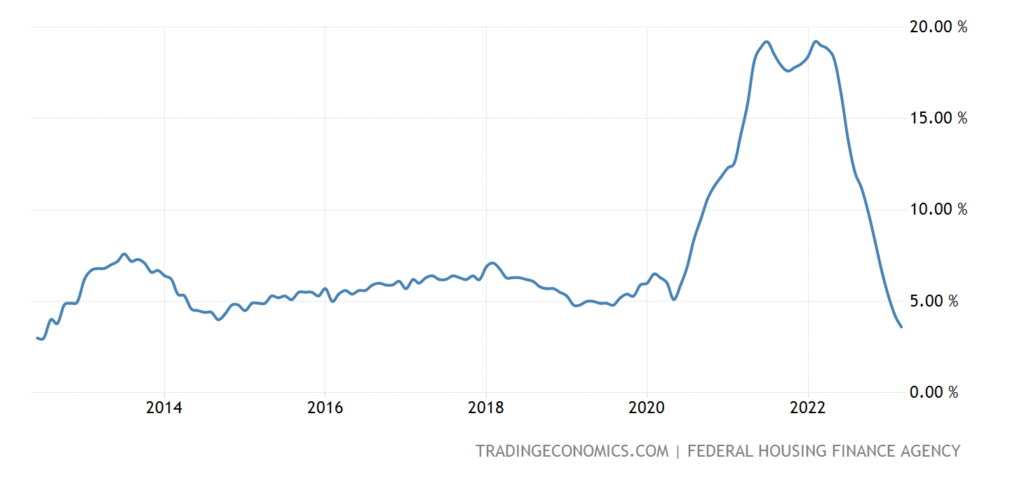
Pic. 23
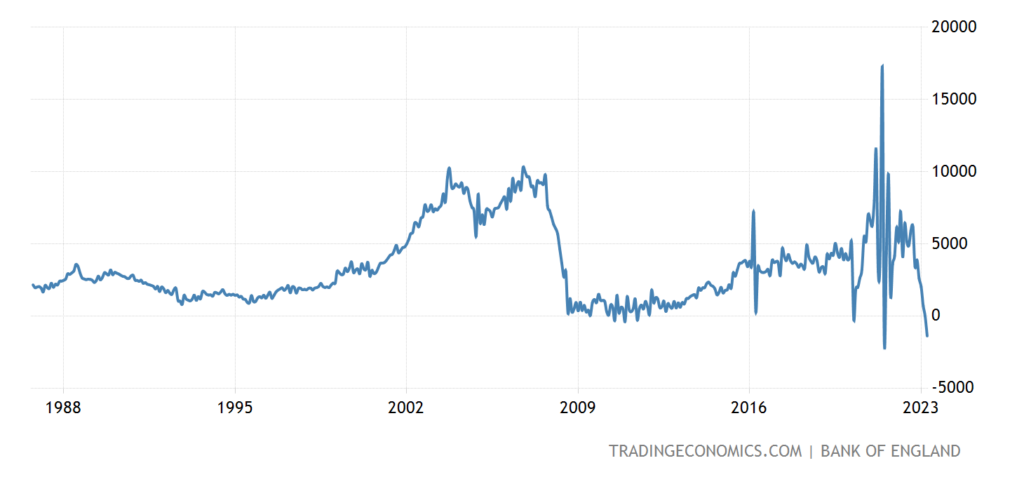
House prices in Britain -3.4% per year – the worst dynamics in 14 years:
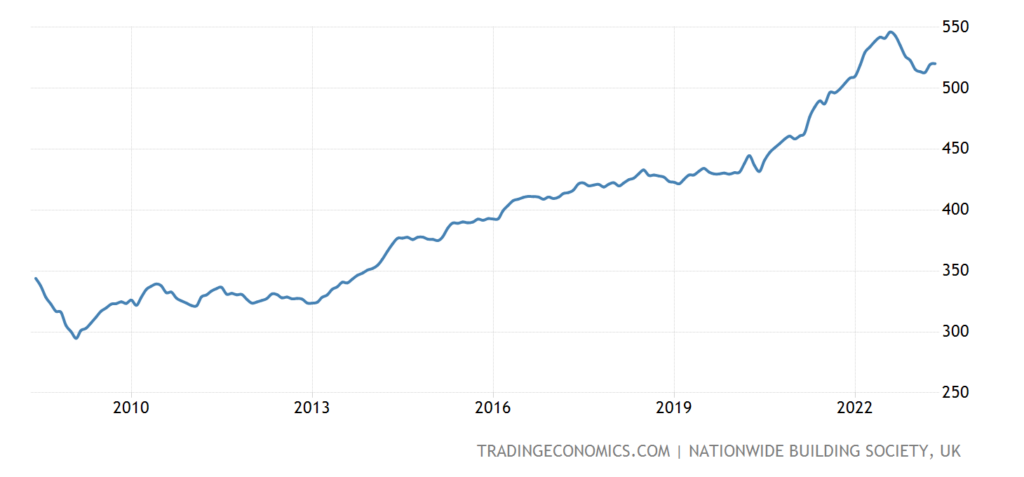
Pic. 24
Net mortgage credit in Britain in a record minus (excluding a one-time collapse in 2021):
Pic. 25
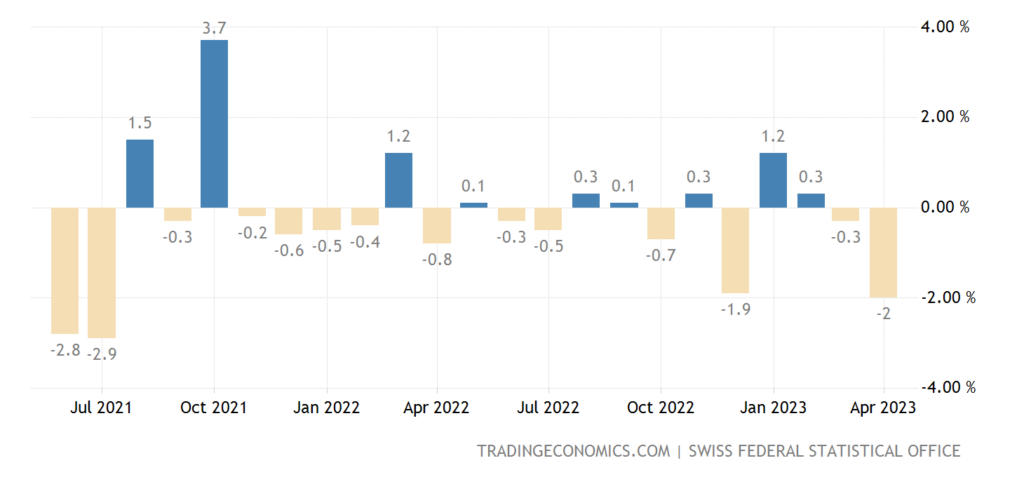
Household loans in Sweden +1.9% per annum – 27-year low:
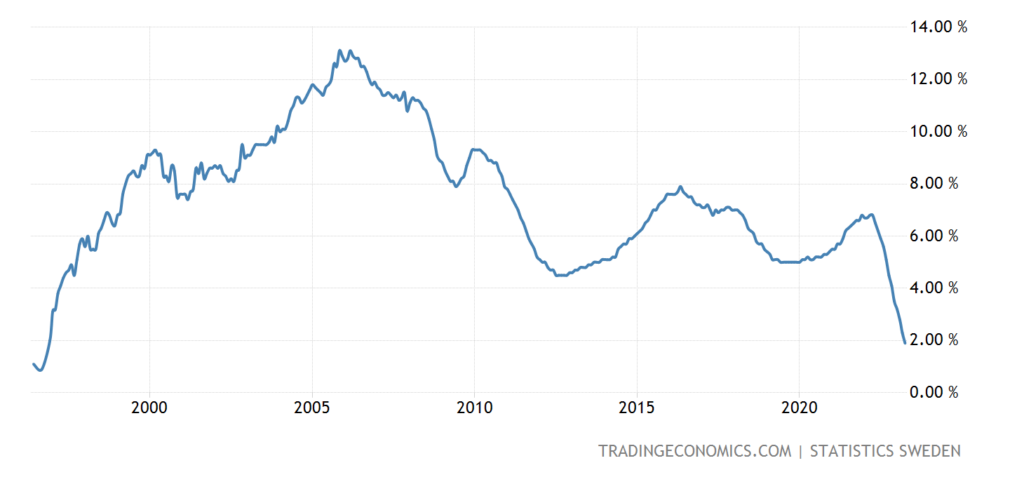
Pic. 26
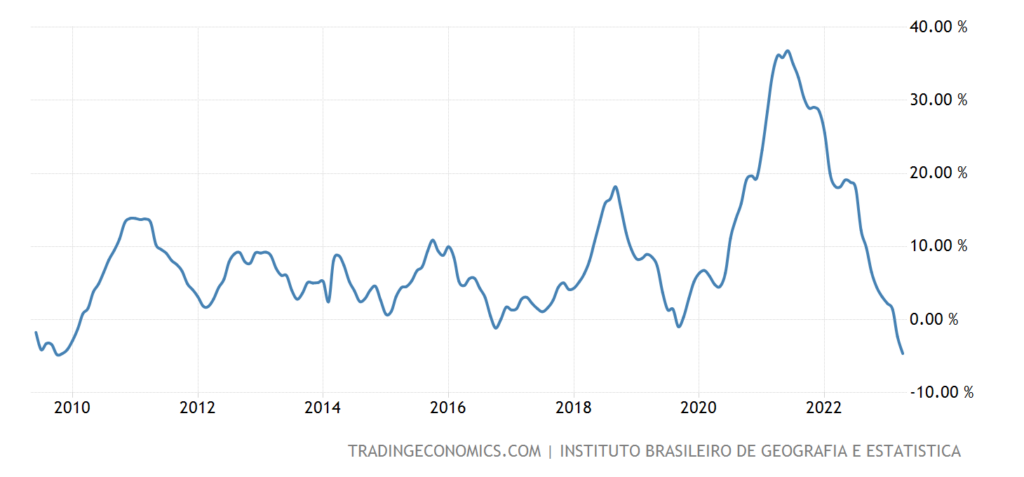
PPI (industrial inflation index) of Brazil -4.6% per year – 14-year low and only 0.1% from the 2009 anti-record:
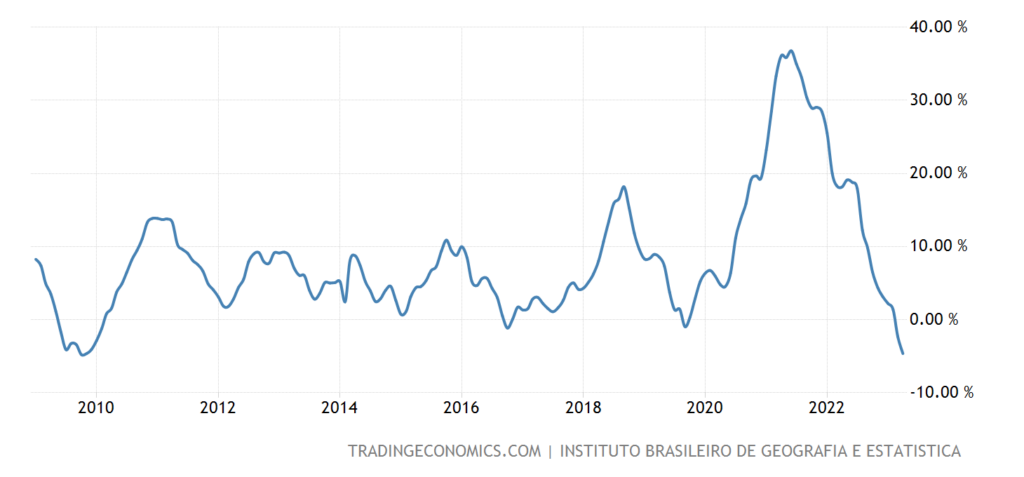
Pic. 27
PPI France -5.1% per month – an anti-record for 28 years of observation:
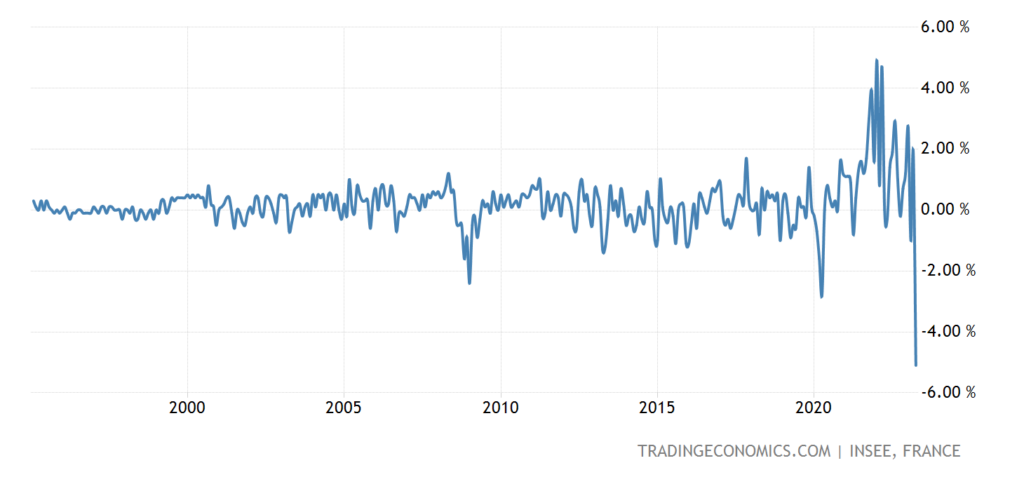
Pic. 28
Import prices in Germany -7.1% per year – not counting the covid dip, this is the lowest since 2009:
Pic. 29
Obvious deflationary signs, the economy of the European Union (and Brazil) sags …
The number of unemployed in Germany is growing for 4 months in a row:
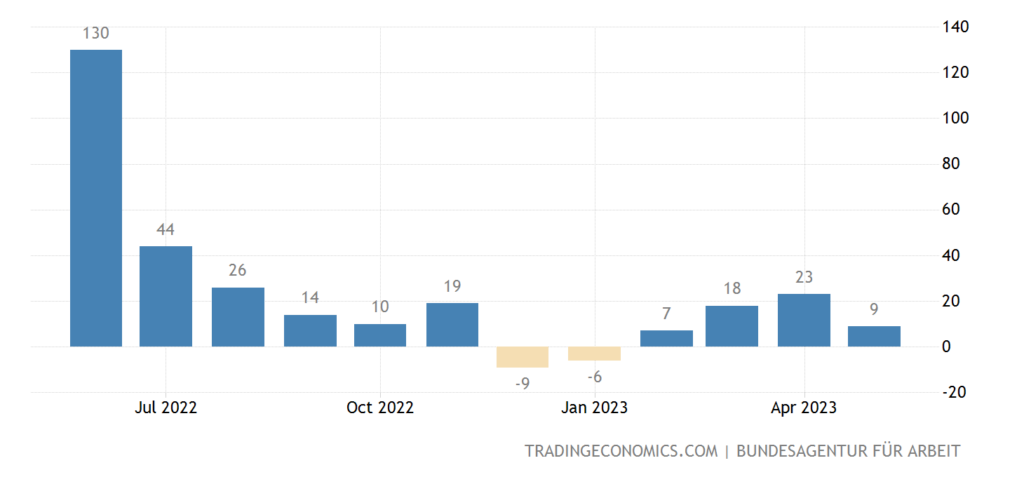
Pic. 30
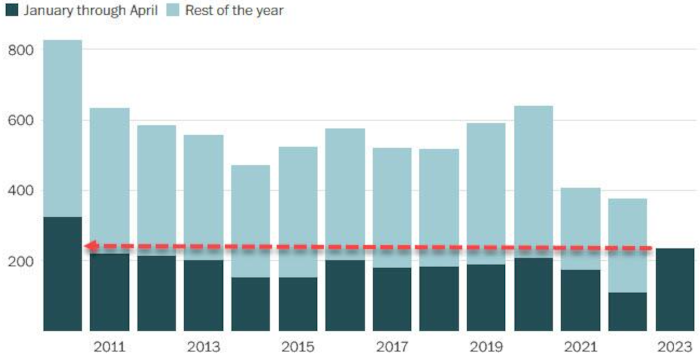
Announcements of layoffs of US firms in January-May are the highest since 2009 (excluding 2020):
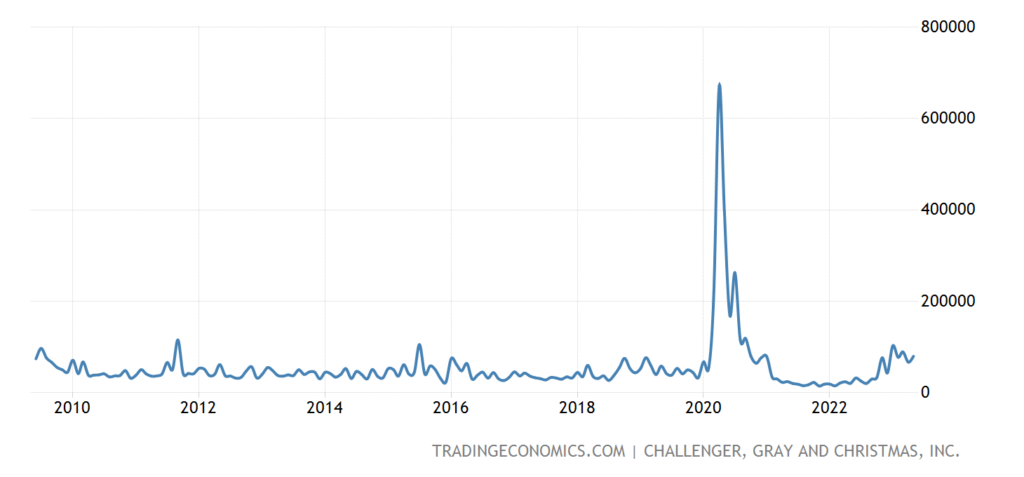
Pic. 31
Retail South Korea -2.3% per month – the worst dynamics in 3 years:
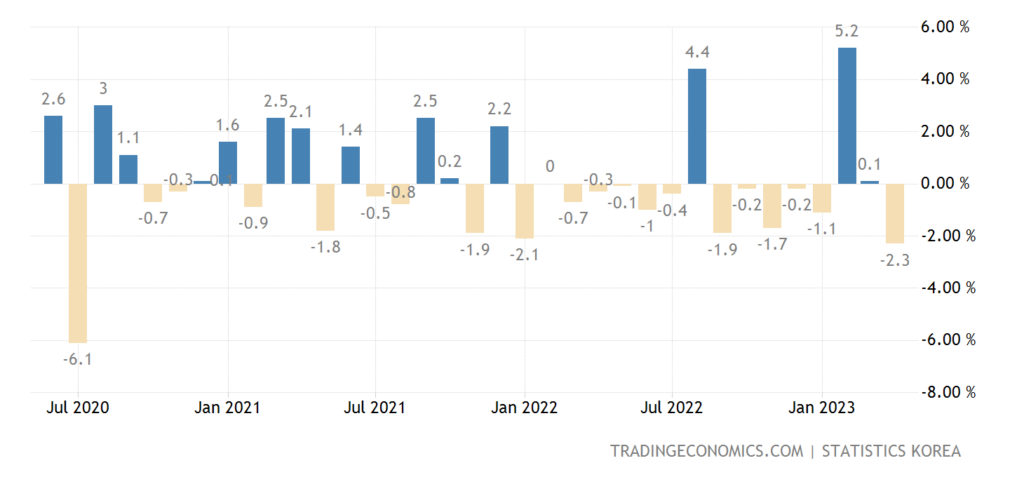
Pic. 32
Retail Germany -4.3% per year — the 12th negative in a row:
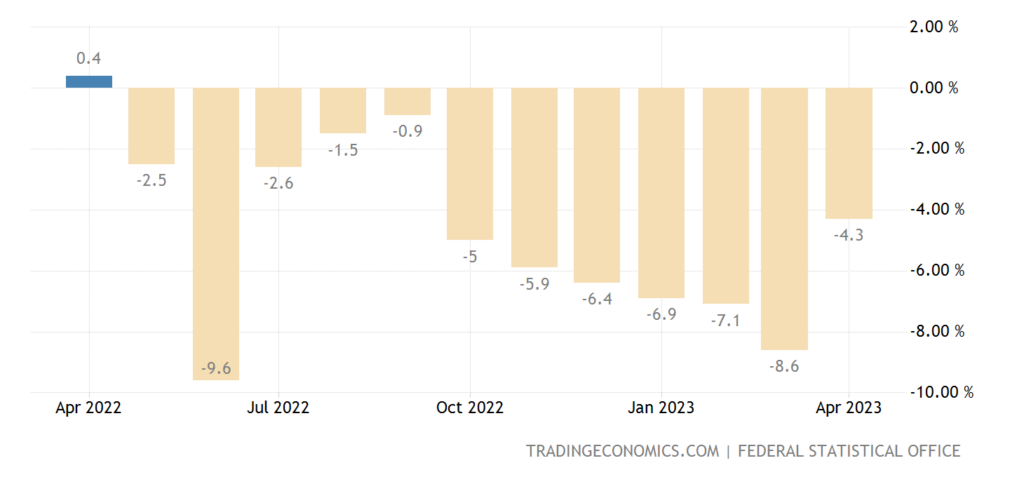
Pic. 33
Retail Switzerland -2.0% per month – 2-year bottom:
Pic. 34
And -3.7% per year — the 7th negative in a row:
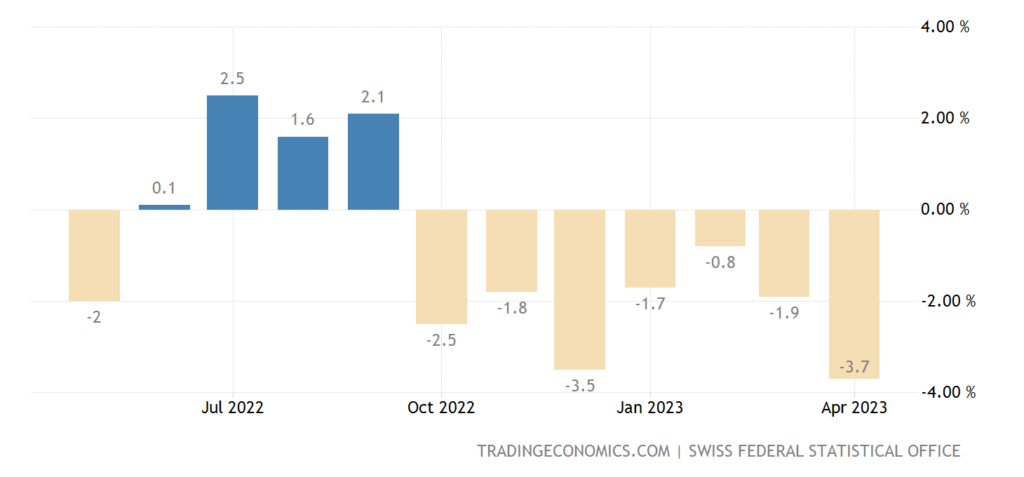
Pic. 35
French spending -1.0% per month – 3rd negative in a row:
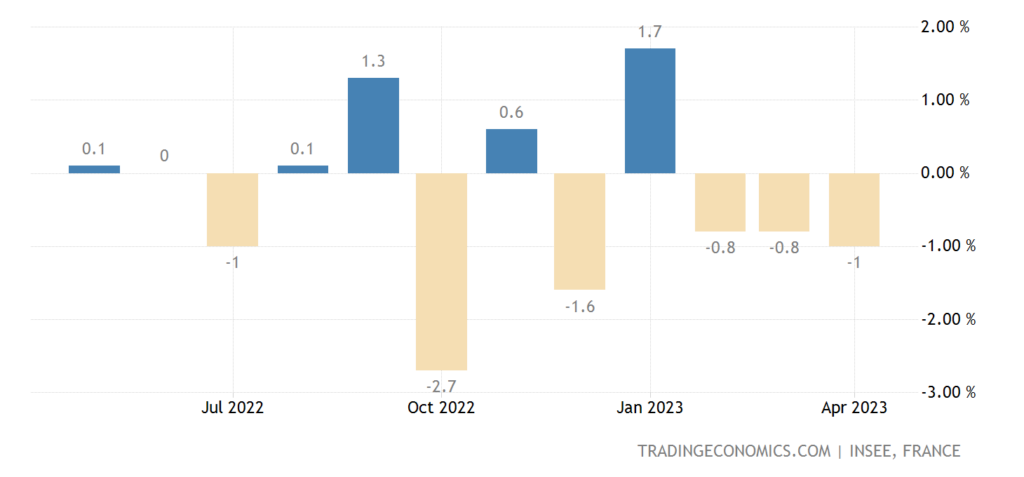
Pic. 36
The fall of the economy is confirmed by aggregate demand.
The number of corporate bankruptcies in the United States is the highest in 13 years amid tightening lending conditions:
Main conclusions. There are good reasons to believe that the answers to the two main questions on US strategy are close to being accepted. More precisely, at an informal, elite level, they are quite possibly already given, but we will see this somewhere by the end of summer – the beginning of autumn. If events show that this hypothesis is not correct, we will immediately warn our readers.
The economy is still the same. A clear decline in the US and the EU, most likely things are not going well in China and Latin America. But as long as the US standard of living is maintained by providing cheap Chinese goods, China will do better than the US. By the way, this is another argument in favor of starting a policy of restricting China – in a situation of stimulating private demand, the logic requires that these same households buy domestic products, not Chinese ones.
Summer has come, with which we congratulate our readers! Have a nice weekend and a calm and productive work week!