
January 1-7, 2023
Big news.
Of course, the main news of the week was the epic with the potential arrest of Trump and the presentation of criminal charges against him. And although, of course, this whole story was more political and legal, it also had an economic component. Roughly speaking, it is difficult to expect the stability of the dollar and, in general, the financial system of a country in which such perturbations take place.
And purely economic news was the decision of the OPEC + member countries to voluntarily reduce oil production in the amount of 1.66 million barrels per day in addition to agreements to reduce production by 2 million barrels. per day. This was stated:
- Saudi Arabia – 500 thousand barrels per day;
- Iraq – 211 thousand barrels per day;
- UAE – 144 thousand barrels per day;
- Kuwait – 128 thousand barrels per day;
- Kazakhstan – 78 thousand barrels per day;
- Algeria – 48 thousand barrels per day;
- Oman – 40 thousand barrels per day;
- Gabon – 8 thousand barrels per day.
Russia also announced a voluntary reduction in oil production by 500,000 barrels the day before. per day until the end of 2023. This situation looks like a vivid anti-American demonstration (especially in combination with the Trump story), but, by and large, it is purely pragmatic.
The crisis in the global economy continues, private demand is falling (see the next section of the Review), and the demand for oil is also falling. In such a situation, a reduction in production is a completely natural policy, but it is another matter that it was difficult to implement it before in a situation of obvious opposition from the United States. But times are changing and the authority and political resource of this country are significantly reduced, in a sense, before the eyes of all mankind, and the objective needs of specific countries begin to come to the fore.
Of course, not all of them are adequate to the situation, who only today does not write about the lack of political subjectivity in most EU countries, but in general, the trend is obvious. And as the crisis develops, it will manifest itself brighter and brighter. Moreover, we assume that the relevant processes will develop faster and faster, until in any case, such a trend is clearly visible.
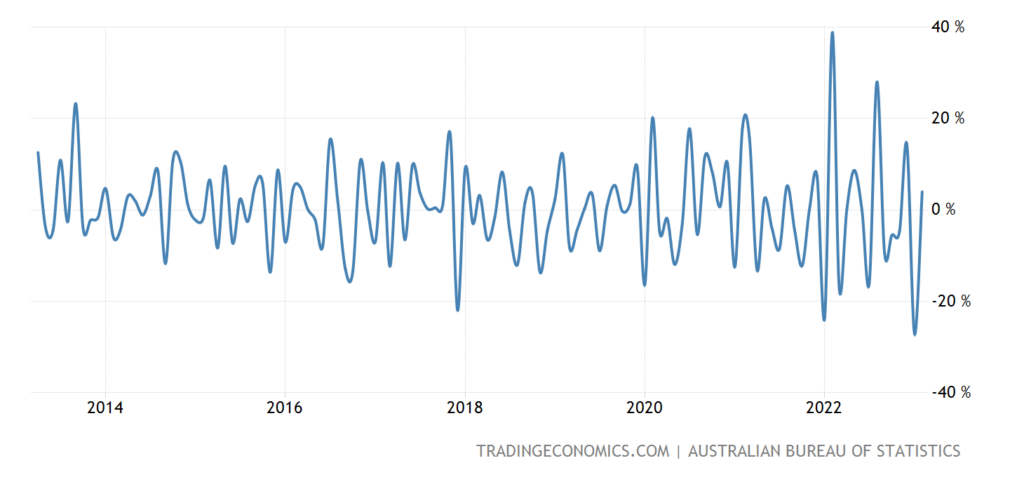
Macroeconomics. Swedish GDP -1.0% per month – the 4th minus in the last 5 months:
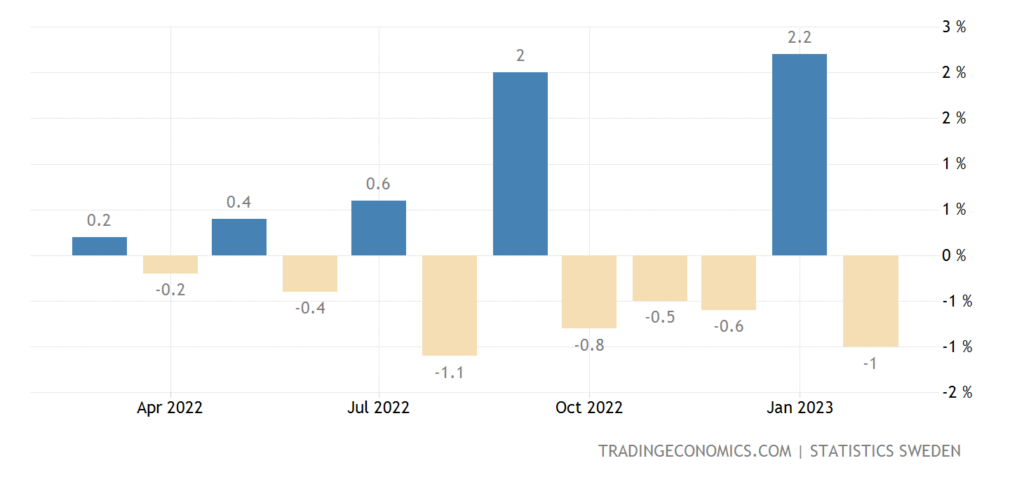
Pic. 1
US industrial orders -0.7% m/m – 2nd negative in a row and 3rd in the last 4 months:
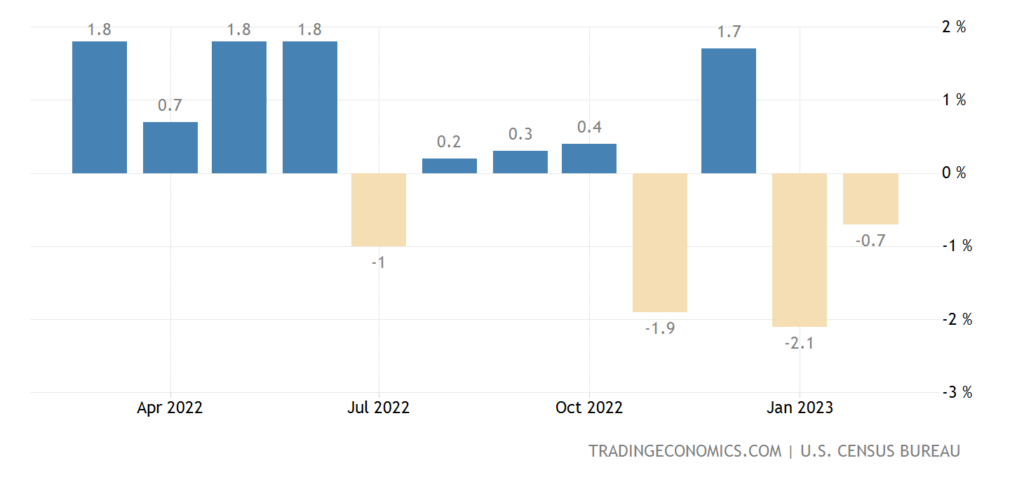
Pic. 2
In Germany -5.7% per year – the 12th negative in a row:
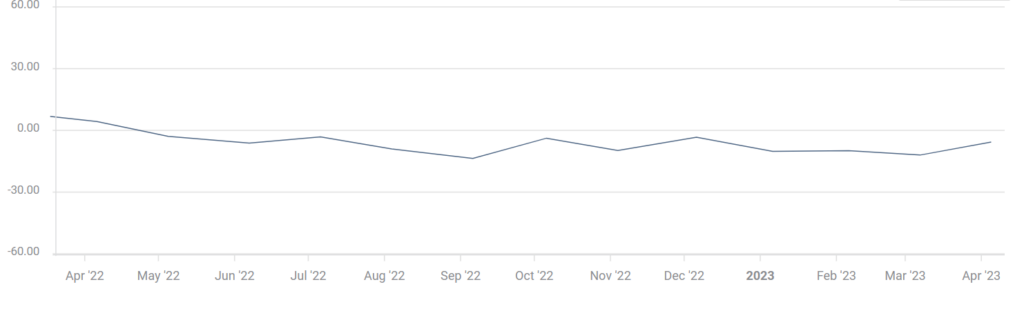
Pic. 3
German industrial output -1.6% per year – 4th negative in a row and 9th in the last 11 months:
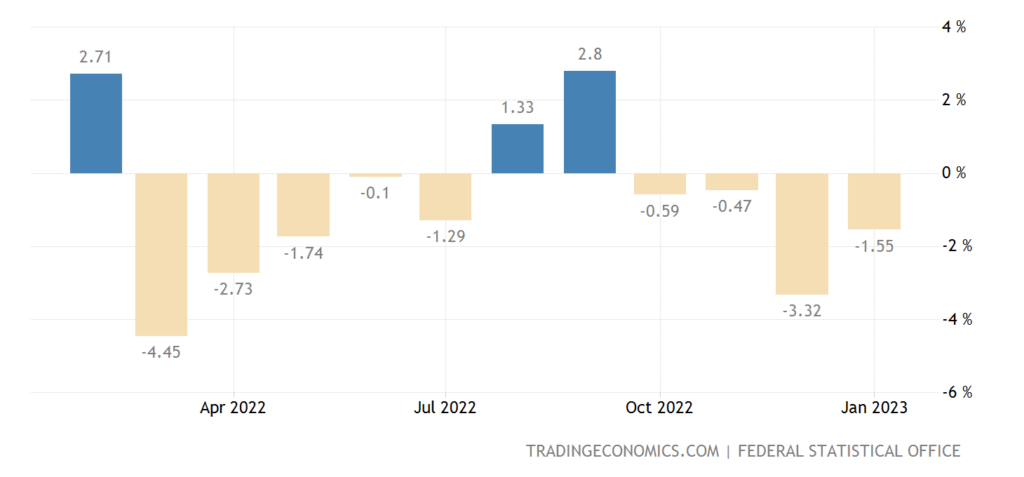
Pic. 4
That is, formally, the transition to a sustainable industrial decline has not yet occurred, then a negative trend is clearly taking place.
Unlike official data, private researchers show the stagnation of PMI (an expert index describing the state of the industry; its values below 50 means stagnation and decline) of China’s industry:
Pic. 5
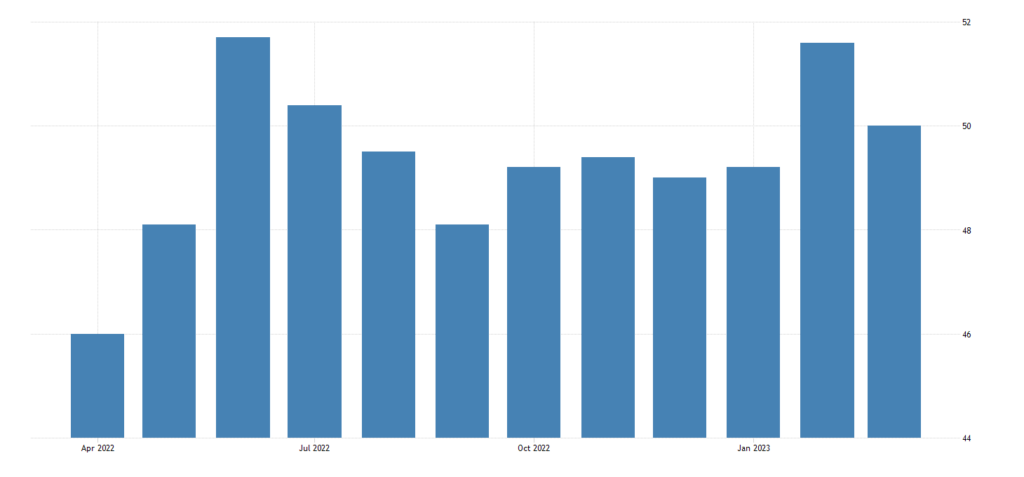
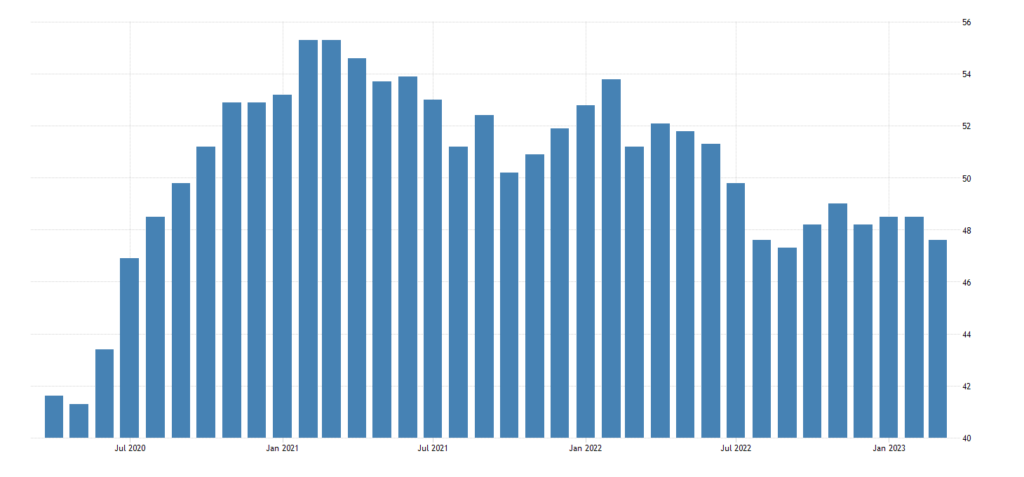
Australian Manufacturing PMI (49.1) at the bottom for 3 years:
Pic. 6
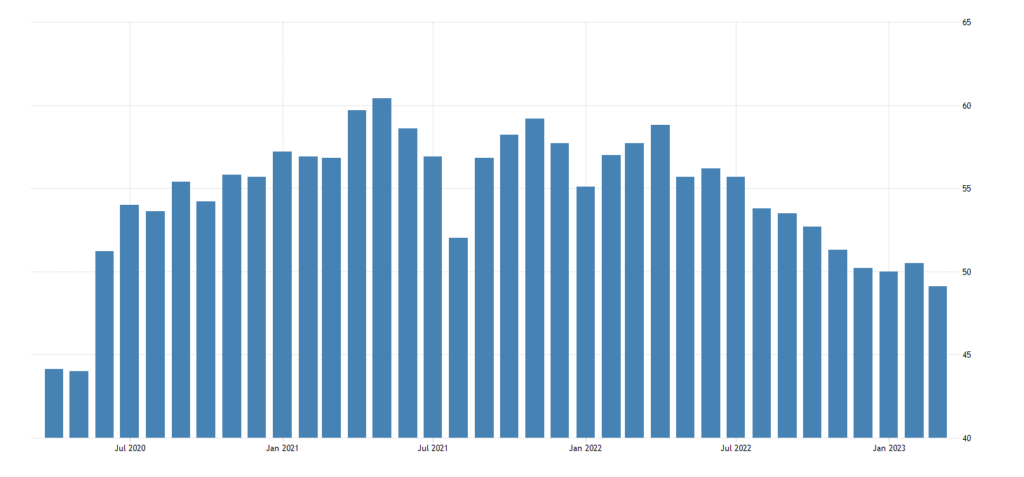
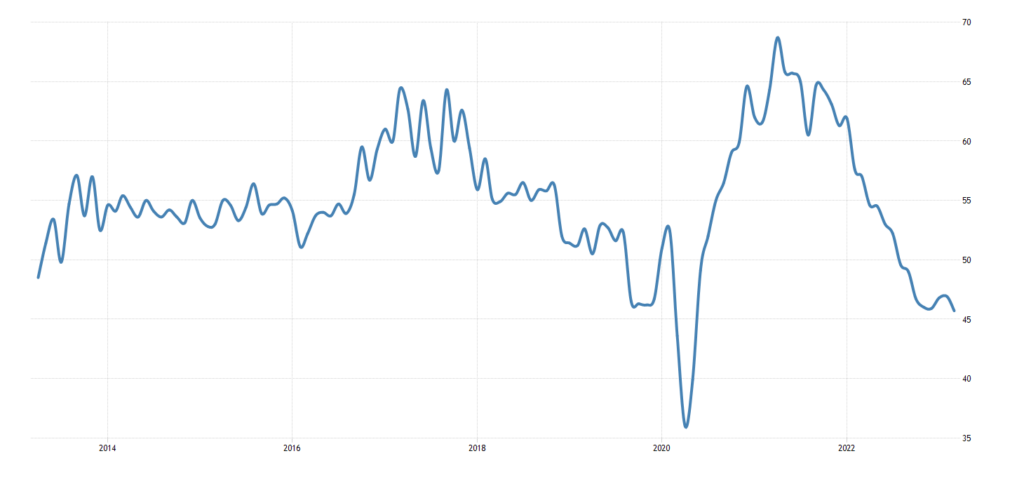
As in Switzerland (47.0):
Pic. 7
And in Canada (48.6):
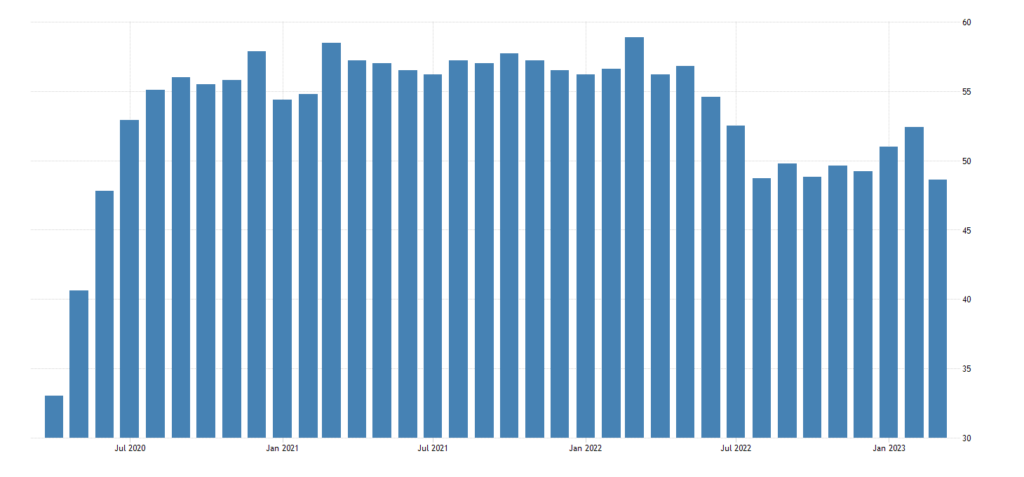
Pic. 8
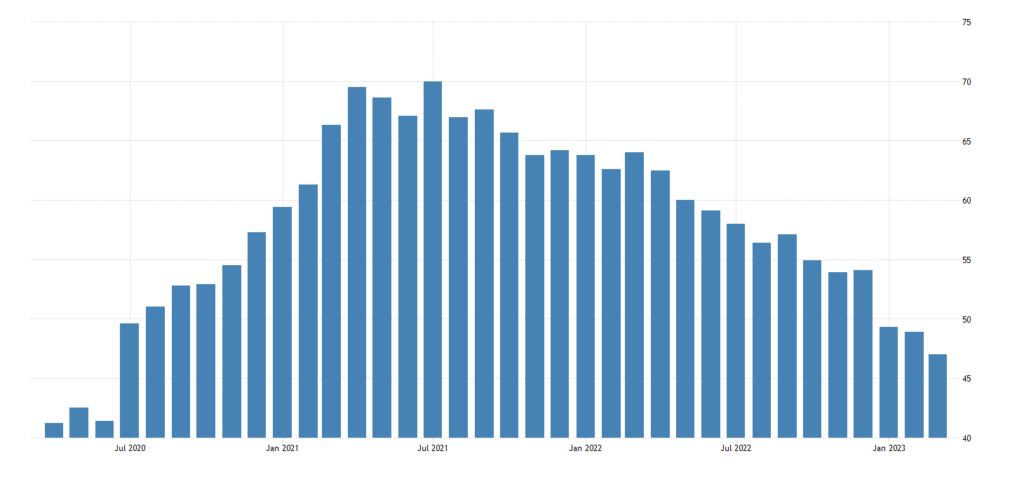
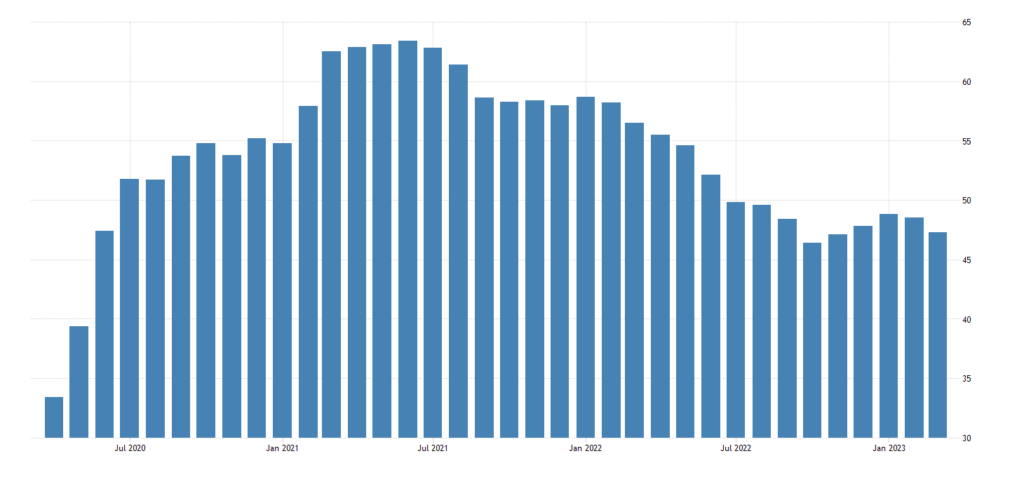
South Korea is also close (47.6):
Pic. 9
In Sweden (45.7), excluding the failure of 2020, the 10-year low is:
Pic. 10
And in the USA (46.3) – even a 14-year-old:
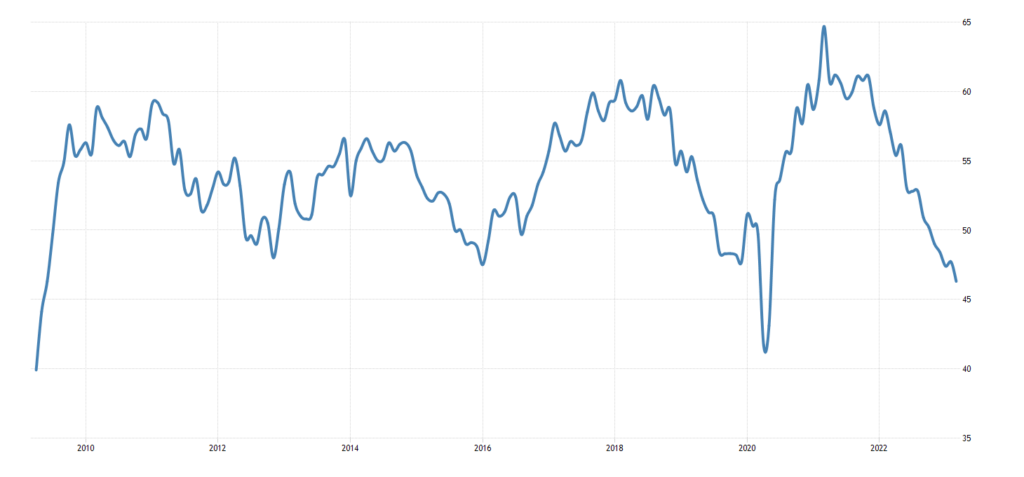
Pic. 11
Noticeable deterioration also in the Eurozone (47.3):
Pic. 12
And in Britain (47.9):
Pic. 13
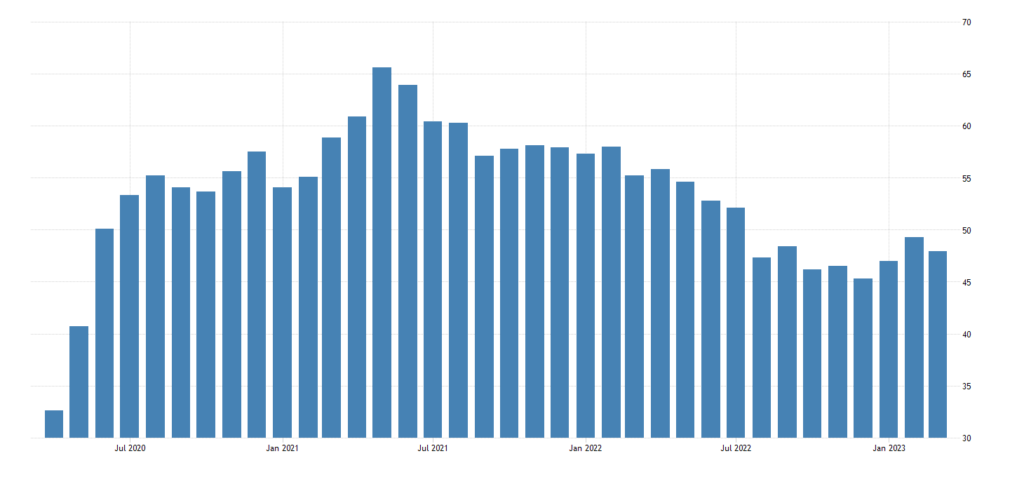
The sentiment of major manufacturers in Japan (review of the Central Bank “Tankan”) is the worst since the end of 2020:
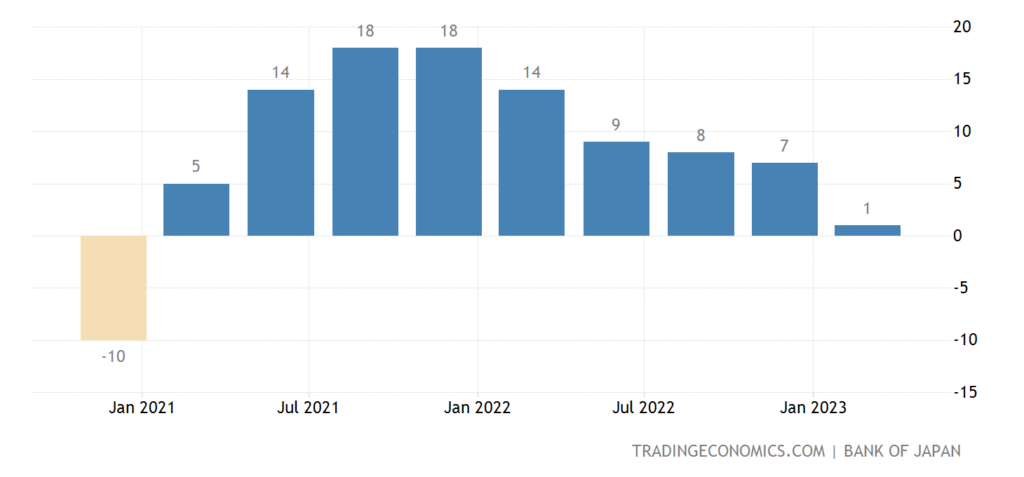
Pic. 14
Australia’s industry indicator remains in the red for 11 straight months:
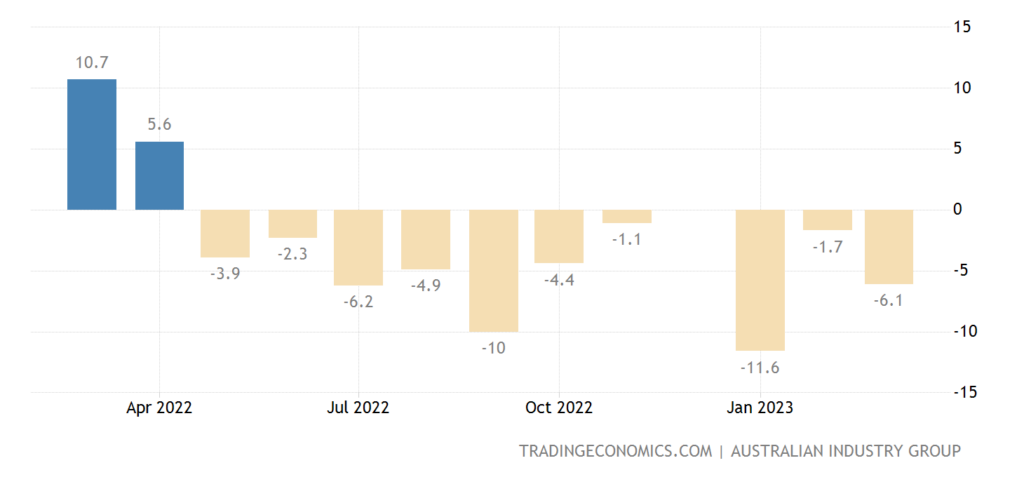
Pic. 15
Let’s not close our eyes and bury our heads in the sand: virtually every major economy in the world is in a severe industrial recession!
Business confidence in New Zealand remains at record lows:
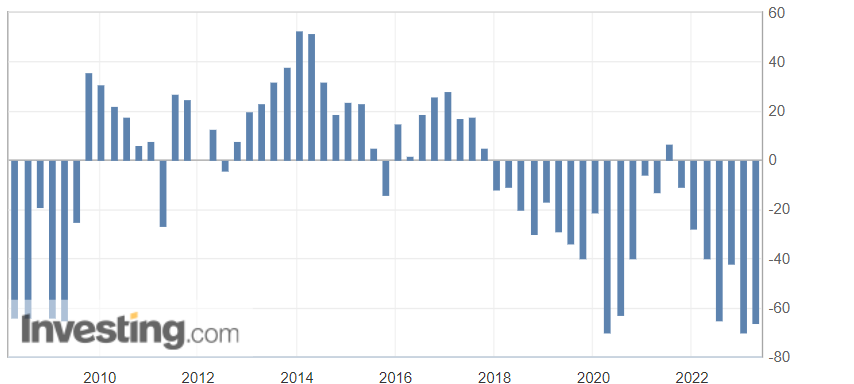
Pic. 16
Building permits in Australia at 10-year lows, especially in the non-residential sector:
Pic. 17
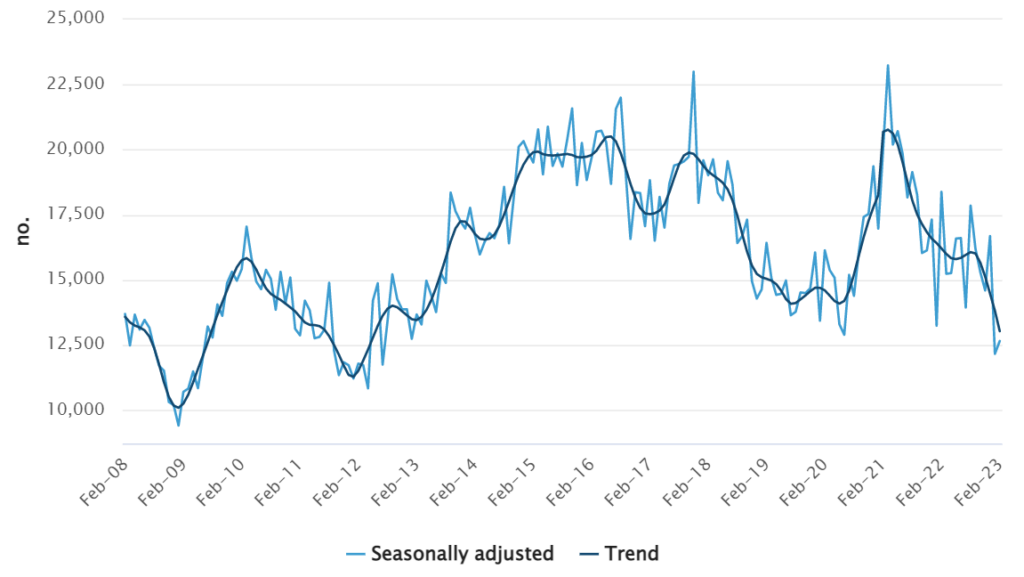
Pic. 18
House prices in Britain +1.6% per year – at least since 2019, then there will be 10-year lows:
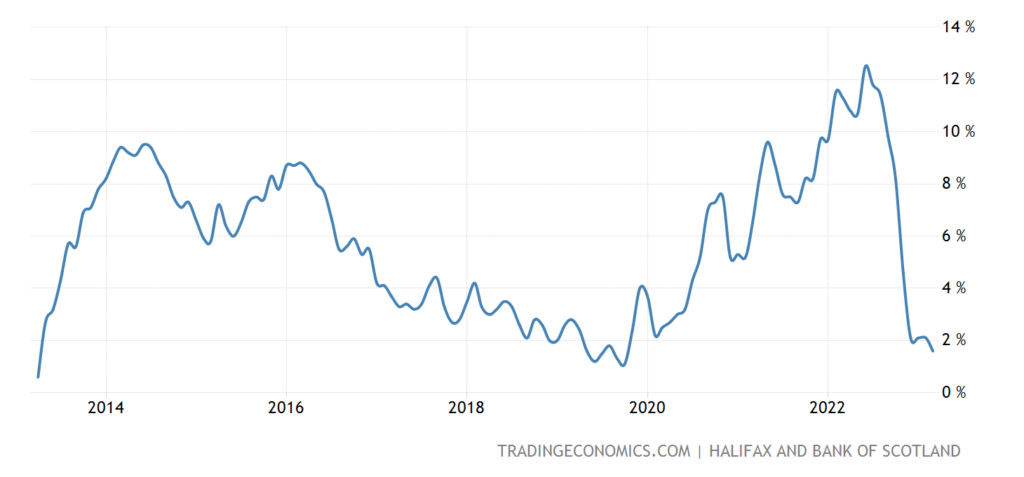
Pic. 19
Swedish household spending -1.4% per month – 4th minus in the last 5 months:
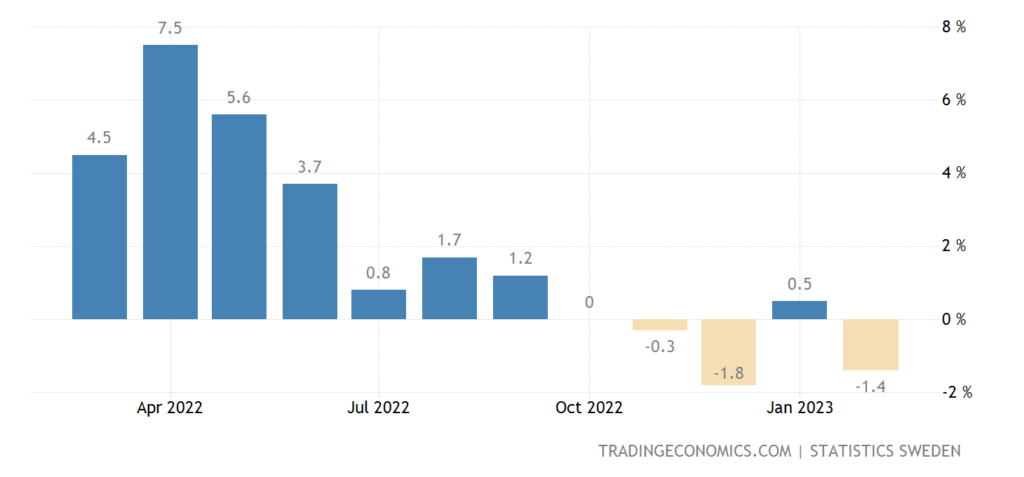
Pic. 20
The number of open vacancies in the US is the lowest in almost 2 years and is falling much faster than expected:
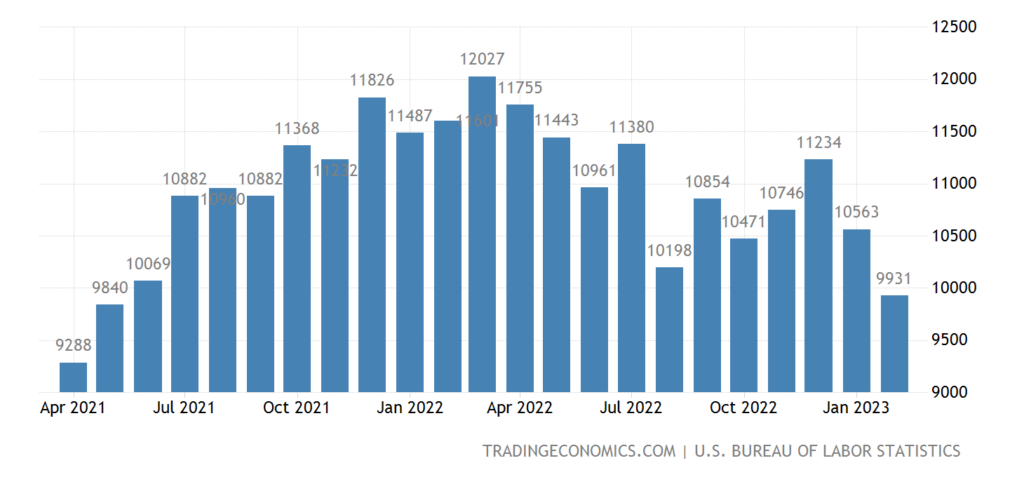
Pic. 21
The number of new jobs is the lowest in 27 months:
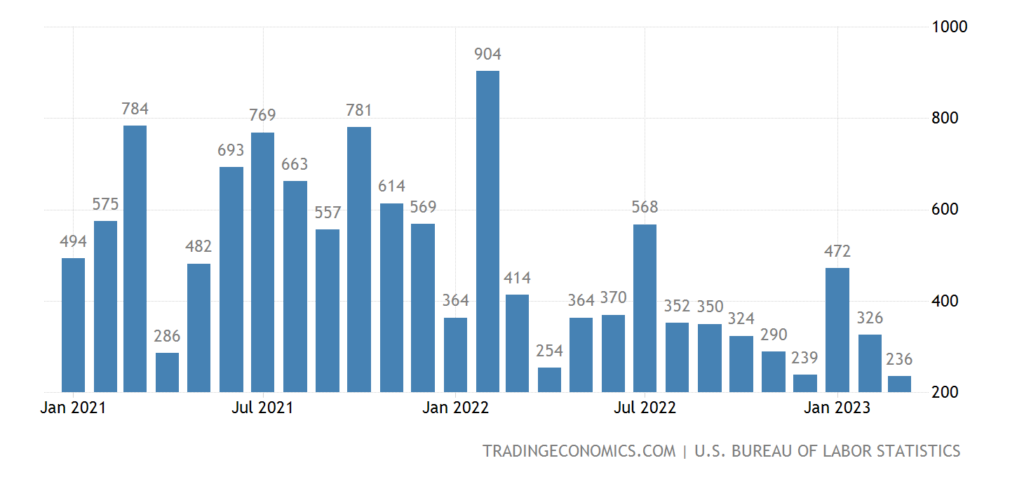
Pic. 22
Number of U.S. Unemployment Beneficiaries in a 16-month maximum:
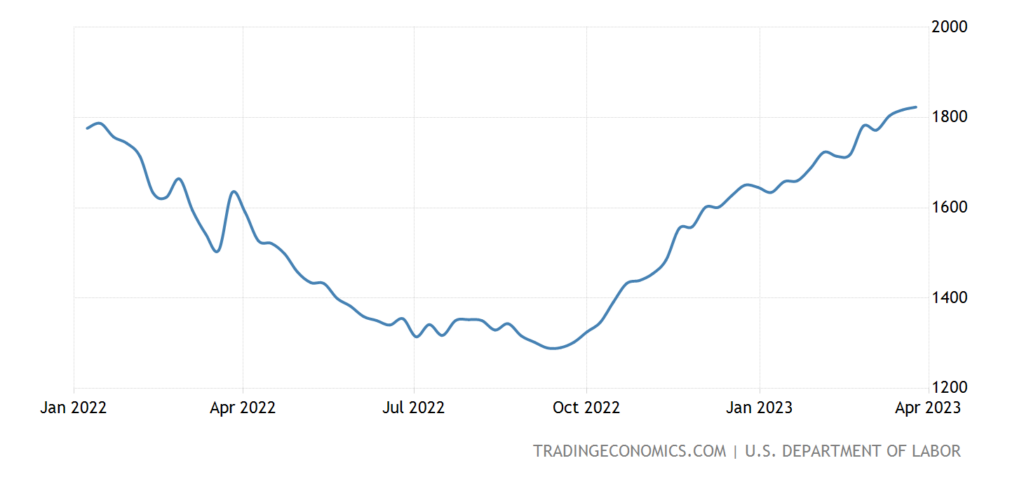
Pic. 23
Announcements of layoffs in the US in March increased 4.2 times compared to last year, in general for 1 quarter. – 4.0 times to the highest levels since 2009 (not counting the brief spike in 2020); layoffs in the technology sector jumped 385 times y/y in Q1, in the financial sector – 5.2 times; at the same time, the plans for hiring staff are the most modest in 7-8 years:
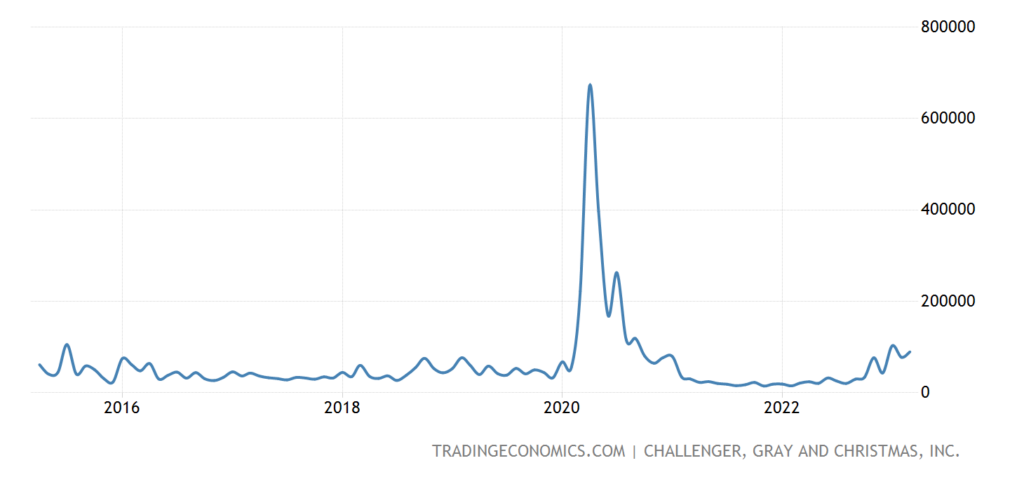
Pic. 24
Recall that the data of US labor statistics are most strongly distorted and often have no relation to reality at all. However, in this case, there are reasons to take them seriously: the indicator of the average length of the working week, which is practically not falsified (because no one looks at it) and is very stable, has decreased from 34.5 hours to 34.4.
The Central Bank of New Zealand raised the rate by 0.50% to 5.25%.
The Central Bank of Australia took a break in the cycle of raising rates, as did the Central Bank of India.
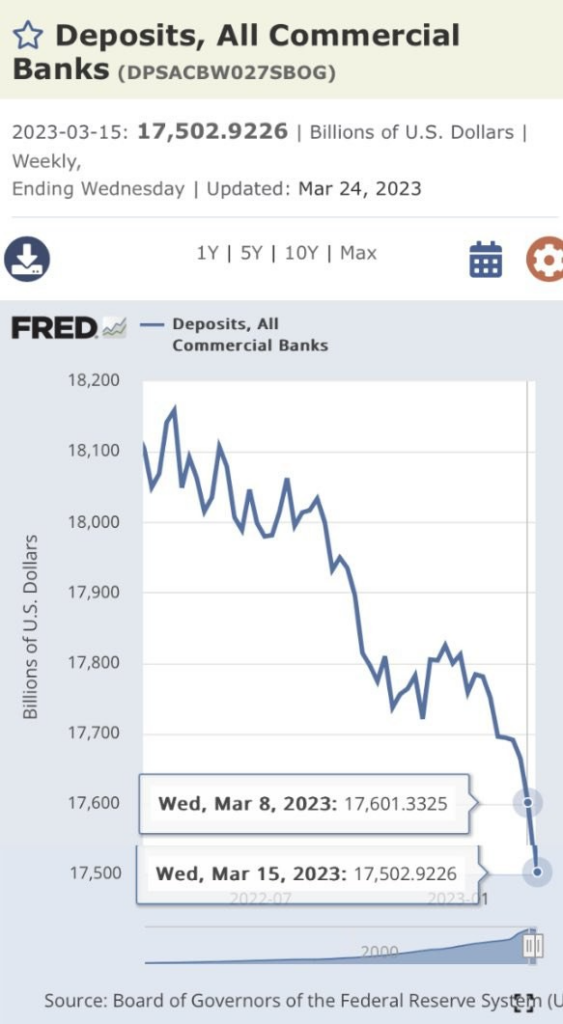
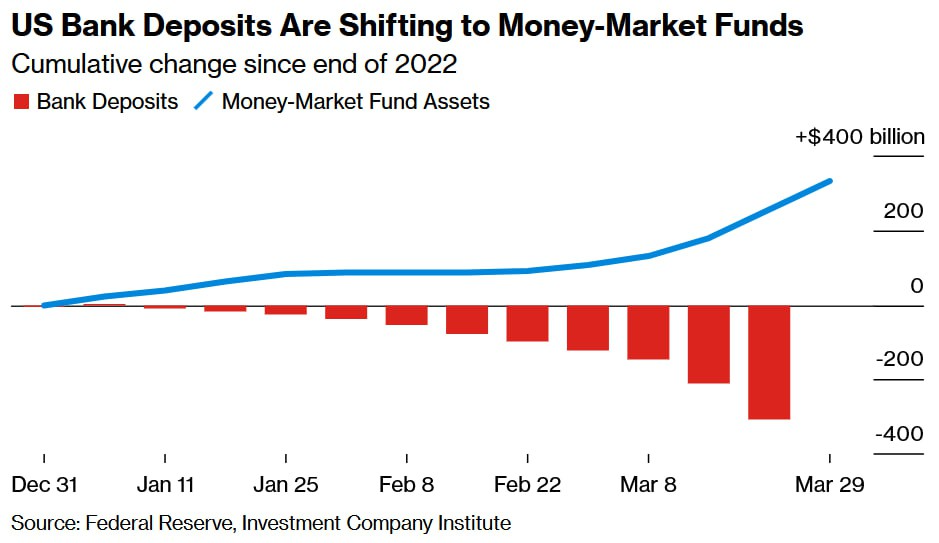
Main conclusions. The industry has taken over the baton from inflation, if a year ago every review was accompanied by record price increases, then recently we have noted a drop in industrial production. At the same time, most likely, the process will continue for some time due to the state of the banking system, in which there is an obvious outflow of deposits:
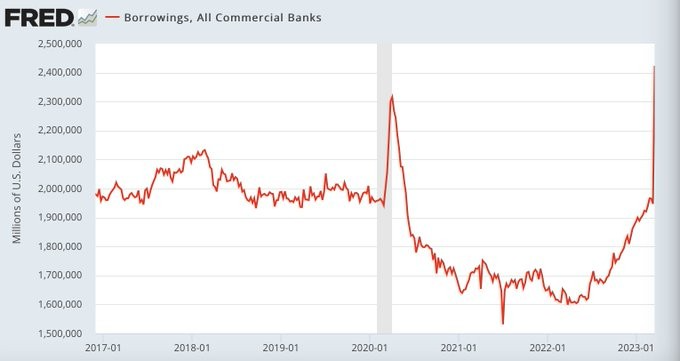
There are other problems for banks, for example, the growth of debt. In the context of raising rates, this increases risks, and a halt in tightening monetary policy will inevitably lead to a rapid increase in inflation … In general, despite the fact that the banking crisis that took place a few weeks ago was man-made, it is possible that it will have an objective continuation.
At the same time, the capital market in the US does not function properly (here we refer to information from Pavel Ryabov, Spydell). The volume of initial offerings (IPOs) is practically at zero — on average, over the past six months, they place 0.6 billion per month, which is 20-25 times less than it was during the investment boom in 2021.
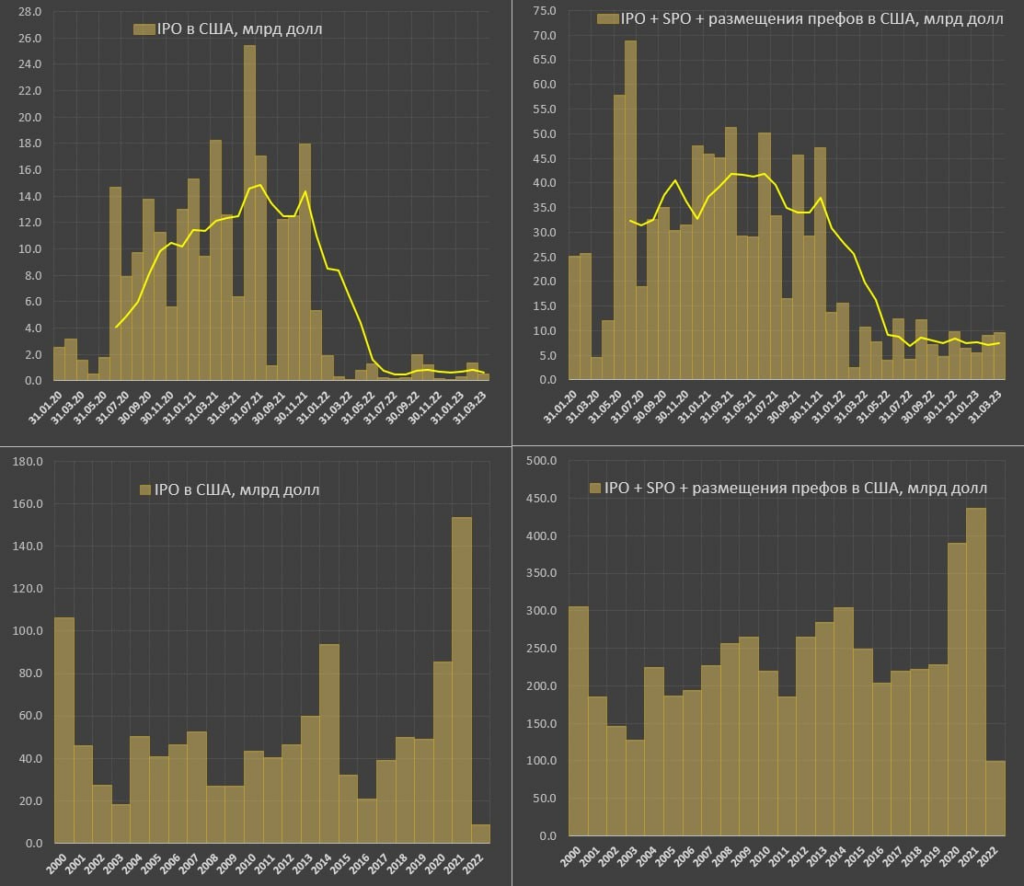
The average monthly volume of placements is considered to be about $4 billion, and taking into account the factor of accumulated inflation and the volume of liquidity, about $6-7 billion, or almost $80 billion per month (now 10 times less).
Taking into account secondary and other placements, 7.5 billion a month on average over the past 6 months comes out (the situation in March did not change – 9.5 billion). This is 5 times less than the average monthly rate in 2021 and 2.5 times less than the norm or 3.5 times less in accordance with the volume of liquidity.
Taking into account the market capitalization and the capacity of the dollar system, this volume of placement is the minimum for the entire period when statistics are kept (since 1987).
The availability of the capital market correlates with the organic growth of the market, i.e. the investment cycle in placements always coincides with the growth of the US market capitalization. Accordingly, if the market grows without an increase in the volume of placements, this indicates a “fictitious” or unstable growth.
IPO, SPO is a very accurate indicator of financial conditions, investment climate and investor confidence. The availability of the capital market is reflected in investment cycles in the real economy.
Thus, near-zero placements, which are at a minimum in modern history, are a clear marker of “investment paralysis”. In principle, with a lag of half a year, this is reflected in the capital investments of the business, which tend to decrease.
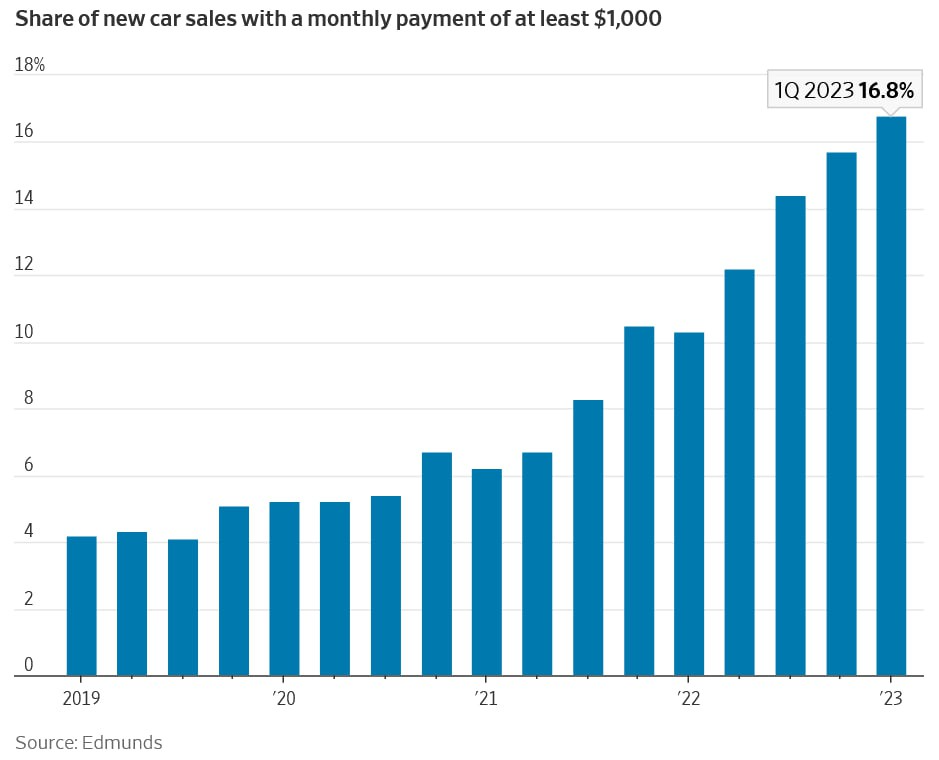
All this is happening against the backdrop of a rising cost of living. As an example, here is a graph of the proportion of car sales that require monthly payments of more than $1,000 per month:
At the same time, citizens, as we have already noted in previous reviews, tend to place the money they take from banks in speculative instruments:
In general, against the backdrop of a clearly ongoing structural crisis, we have clearly unbalanced financial markets, the credibility of which is also falling for political reasons. Next week the data on inflation in the US will be released, and if they turn out to be not very good, we can already expect some sharp reactions, both from the markets and from the monetary authorities.
However, our readers have already been warned, so we wish them a quiet weekend and a successful work week!