Time period: 20-26 November 2021
Top news story. The main economic event of the week – US President Joe Biden announced the decision to use the strategic oil reserve to lower prices, and the United States Department of Energy opened 50 million barrels of oil. Simultaneously with the United States, China, India, Japan, South Korea and the United Kingdom uncovered strategic reserves.
As a matter of principle, the market did not react. By the end of the week, oil prices dropped slightly (the price of a Brent oil futures contract for delivery in January 2022 on the London ICE exchange fell by 5.59%, to $76.4 per barrel, according to data from the trading floor at 14:21 Moscow time; the last time the price of Brent was below $77 per barrel on September 30, 2021), but the decline was significantly less than expected. In fact, the problem is that experts assess price increases solely on the basis of the monetary concept of price increases, whereas a structural factor intervened.
Macroeconomics
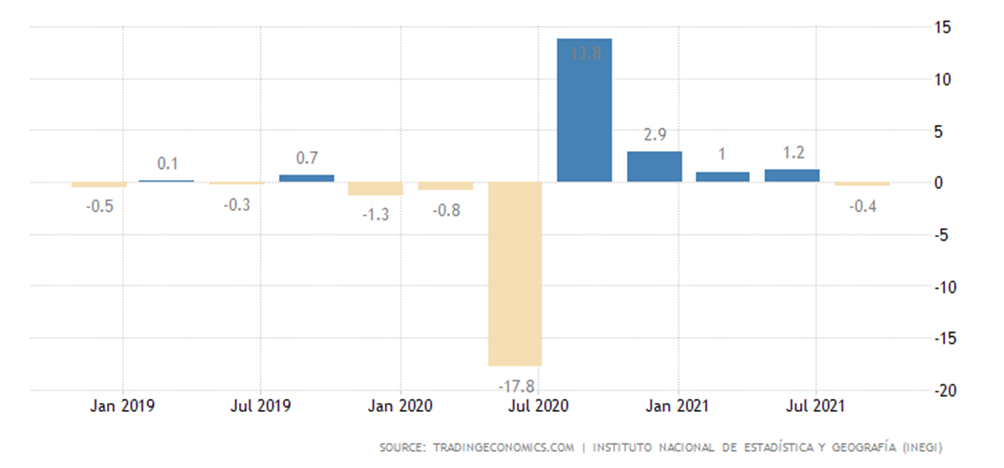
Mexico’s GDP returned to negative quarterly values a year later:
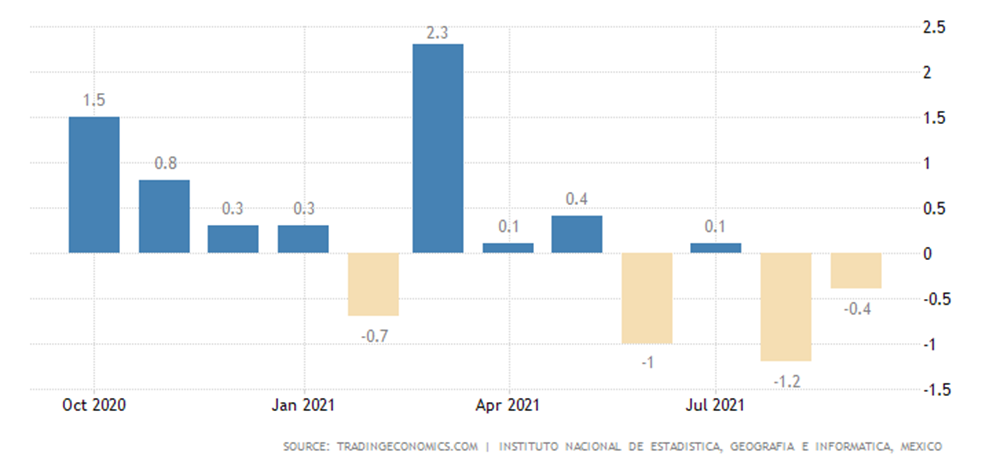
Separately in September there was also a monthly negative (-0.4%):
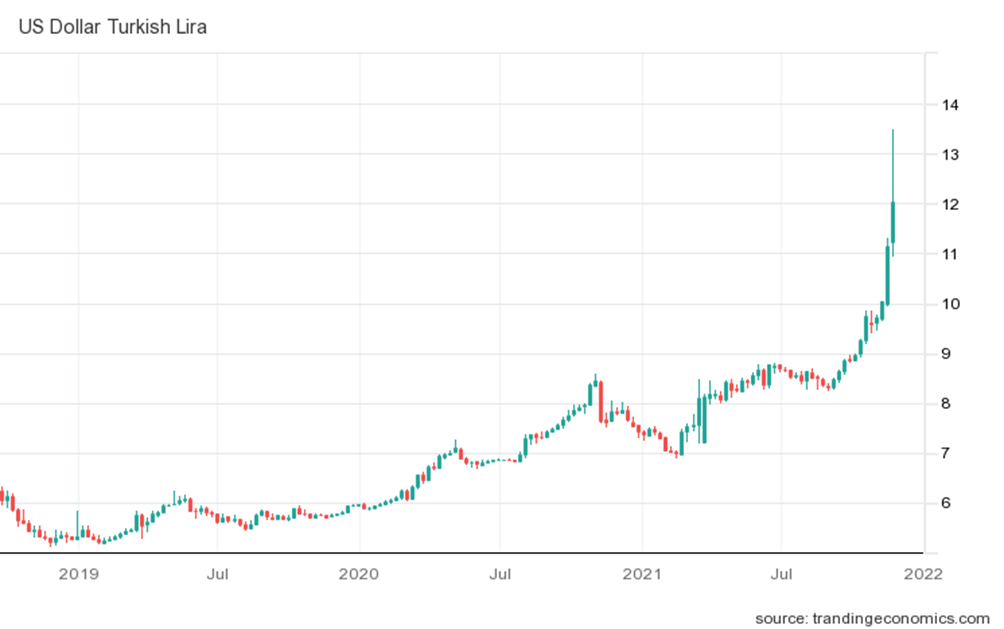
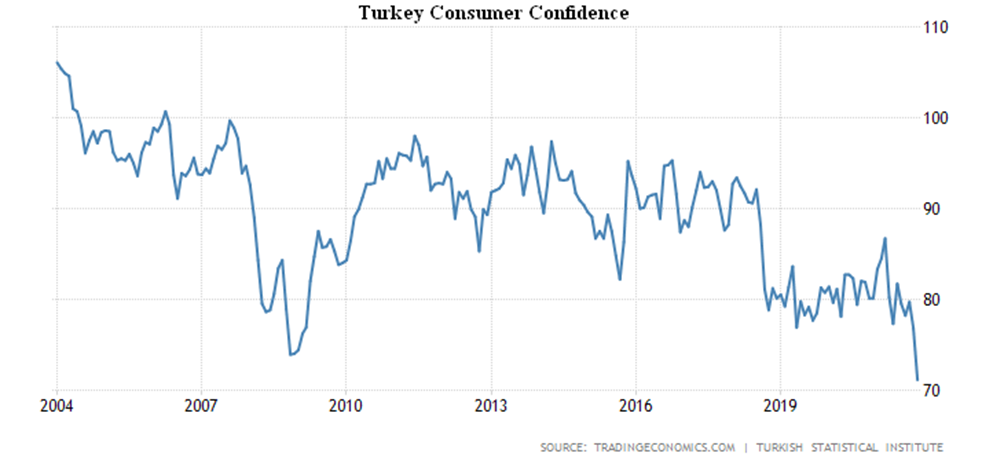
Business confidence in Turkey is the weakest in 10 months:
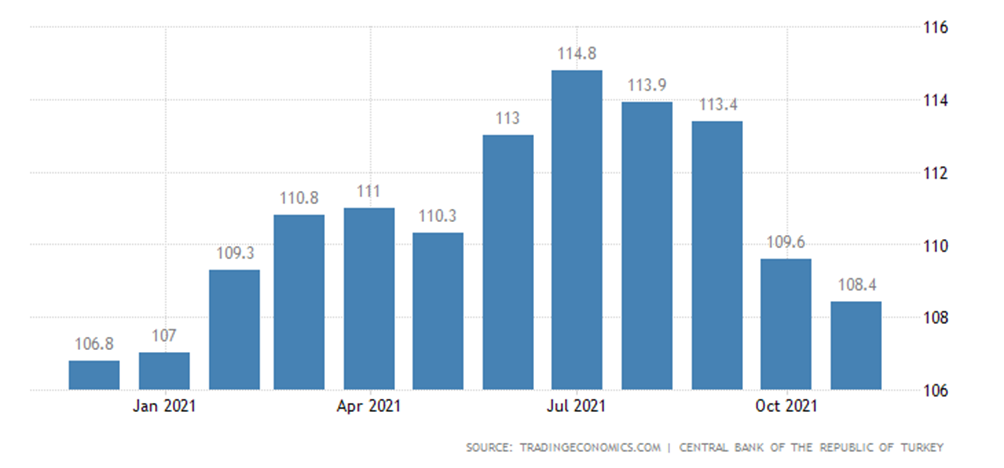
However, given the condition of the Turkish lira, it is not surprising:
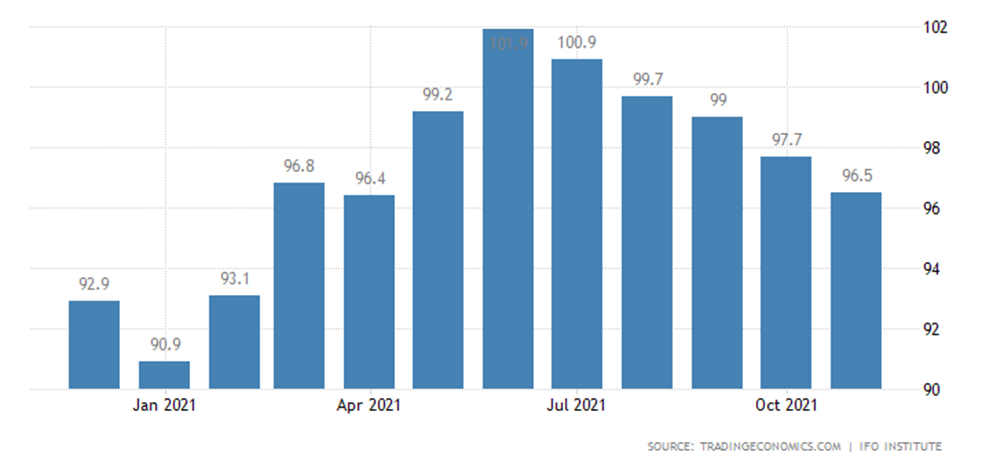
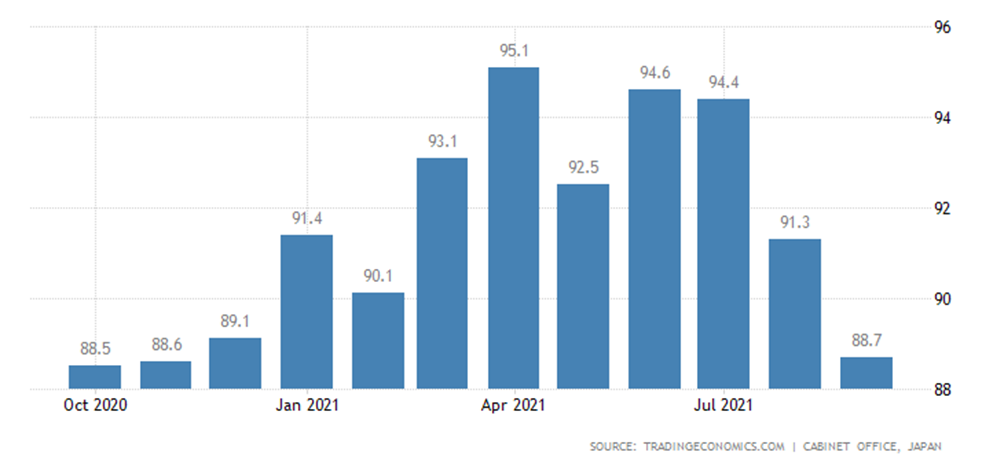
Germany’s business climate (IFO survey) is the worst in seven months:
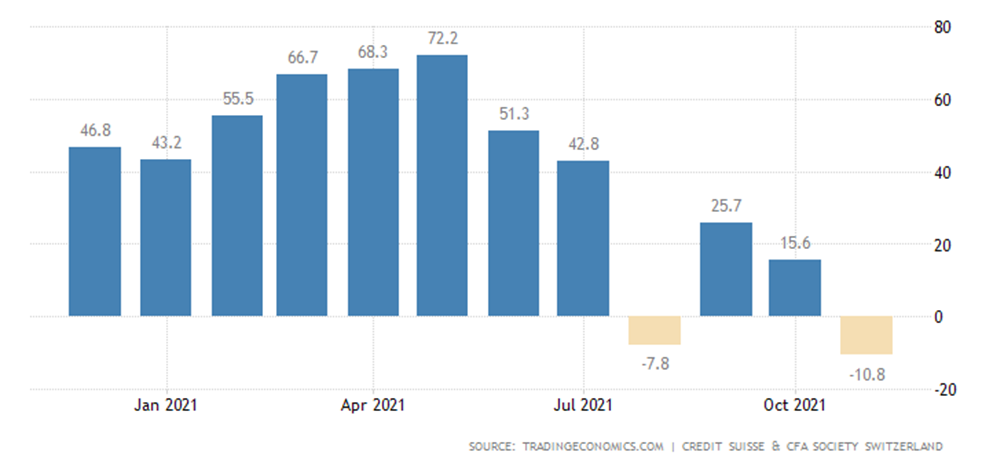
In Switzerland, the lowest in 1.5 years:
Japan’s leading indicators are at the trough in 7 months:
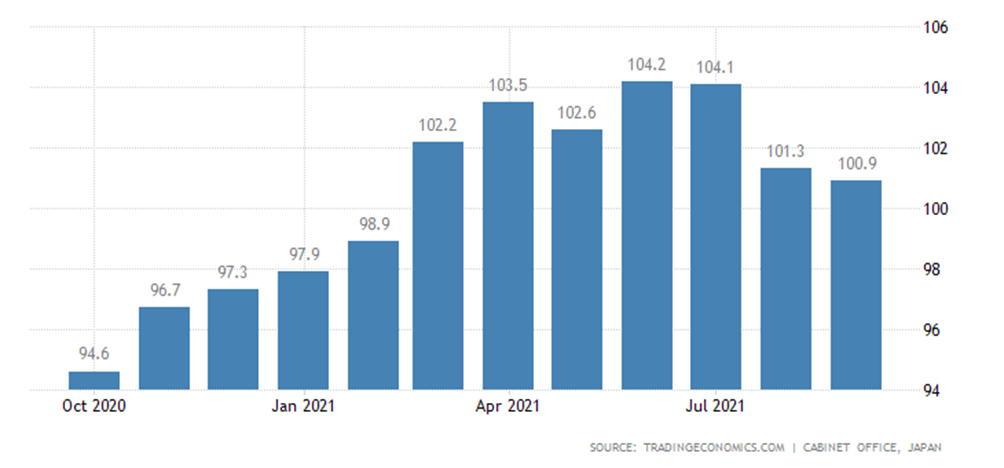
And the coinciding indicators are at the trough for 10 years:
Typical of recent months, inflation rates are breaking records.
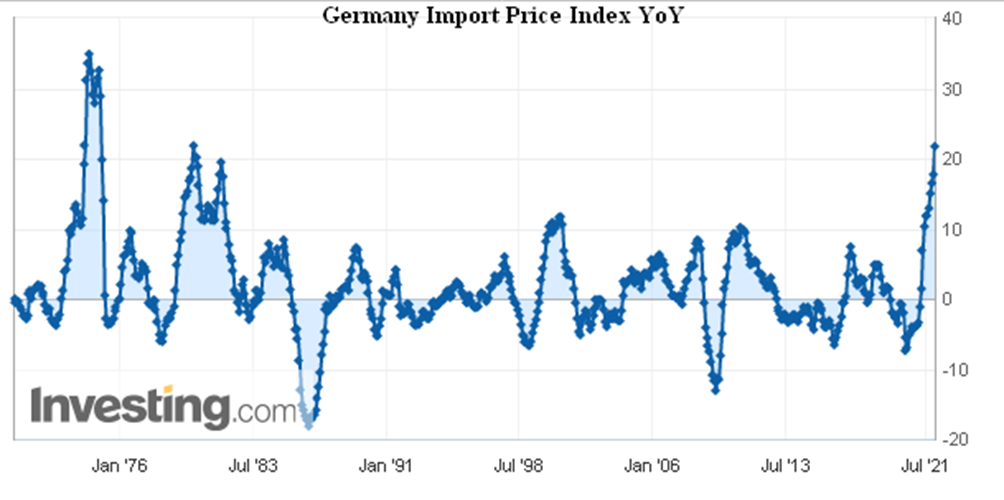
Import prices in Germany (+21.7% per year) are the highest since 1980:
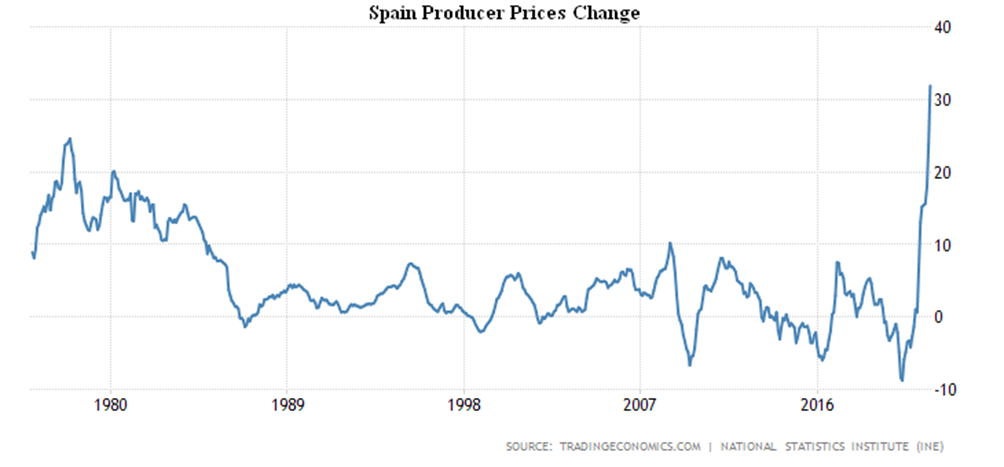
PPI (Producer Price Index) of Spain +31.9% per year – a record for 46 years of observation:
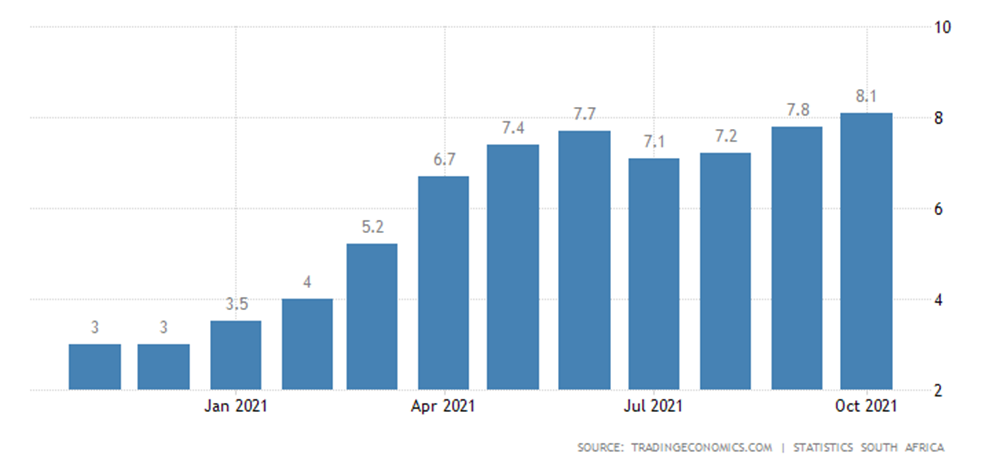
PPI South Africa +8.1% per year – at its highest since May 2014:
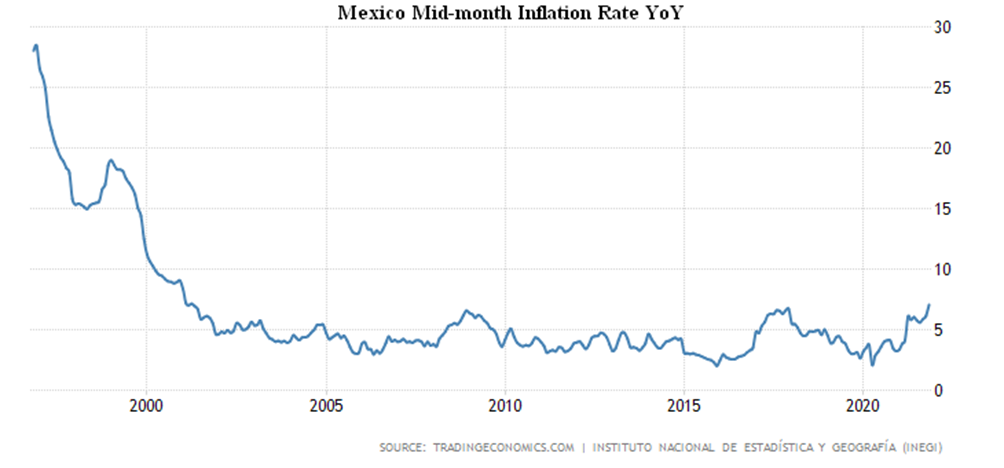
CPI (Consumer Price index) of Mexico +7.05% per year – peak since 2001:
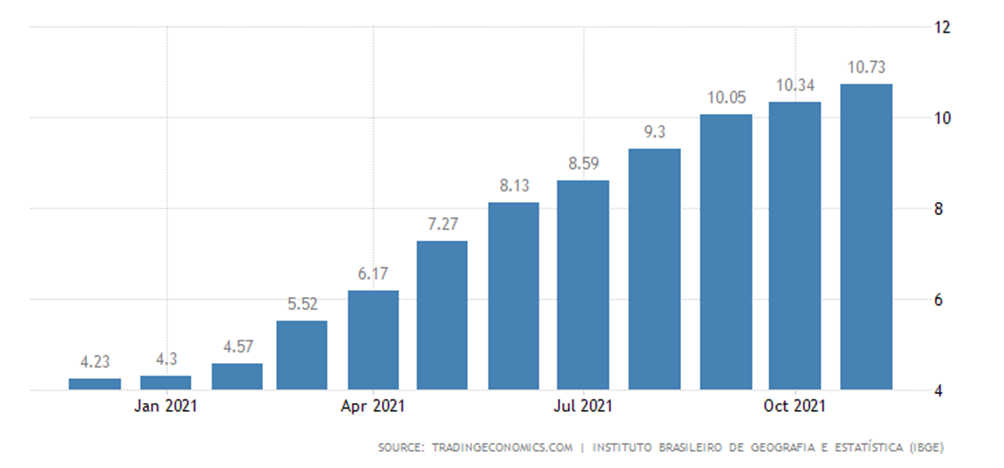
CPI Brazil +10.73% per year, which is only 0.1% of the peak of 2016, followed by the peak of 2003:
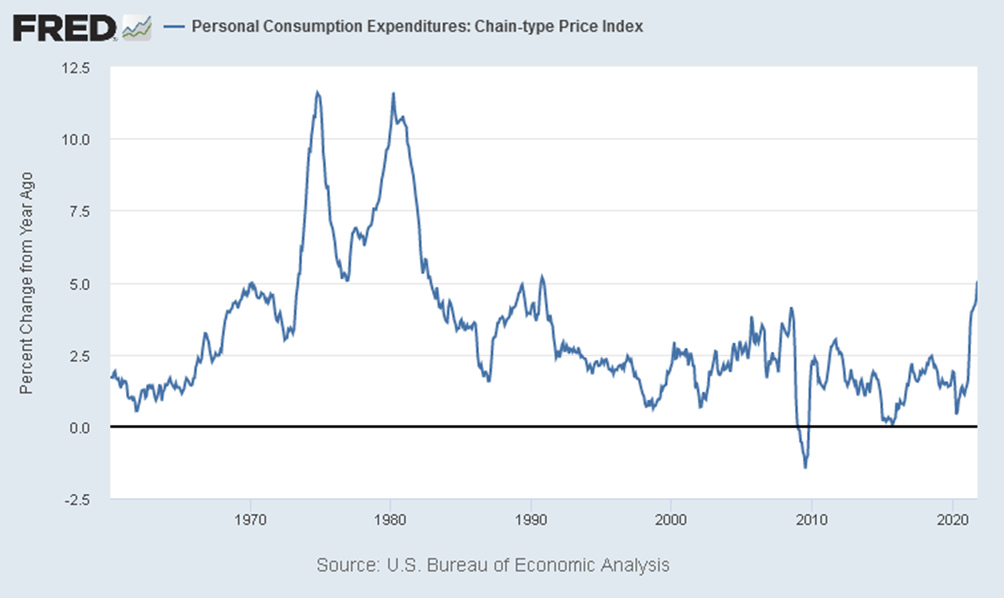
The US Chain-type Price Index (Personal Consumption Expenditures) is +5.0% per year, which has been at its peak since October 1990 (only 0.1%):
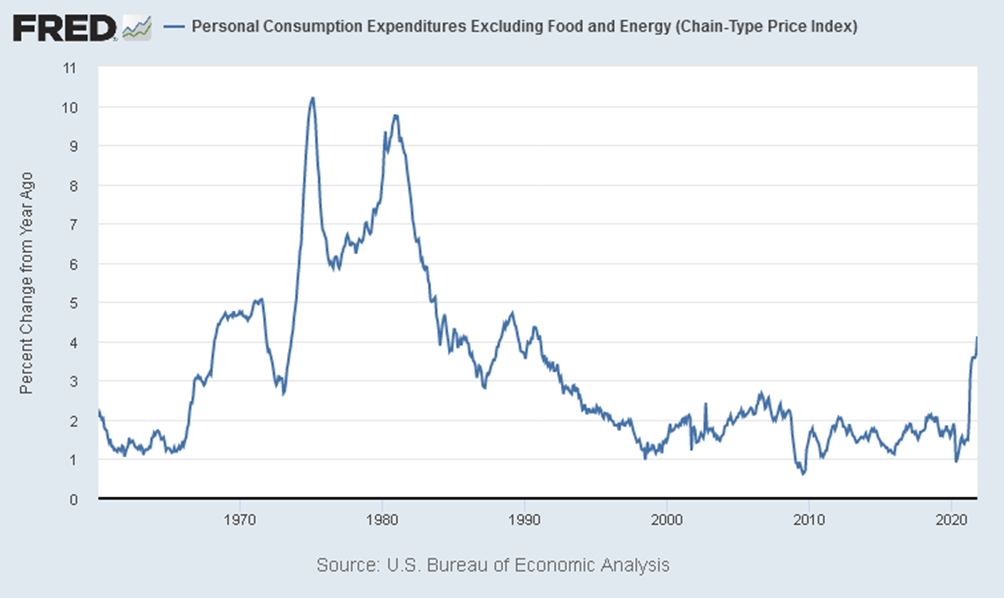
Excluding food and energy +4.1% per year – the highest since January 1991:
Consumer sentiment in Turkey is the most depressing in the 18 years of the survey’s existence, the reasons we have explained above are:
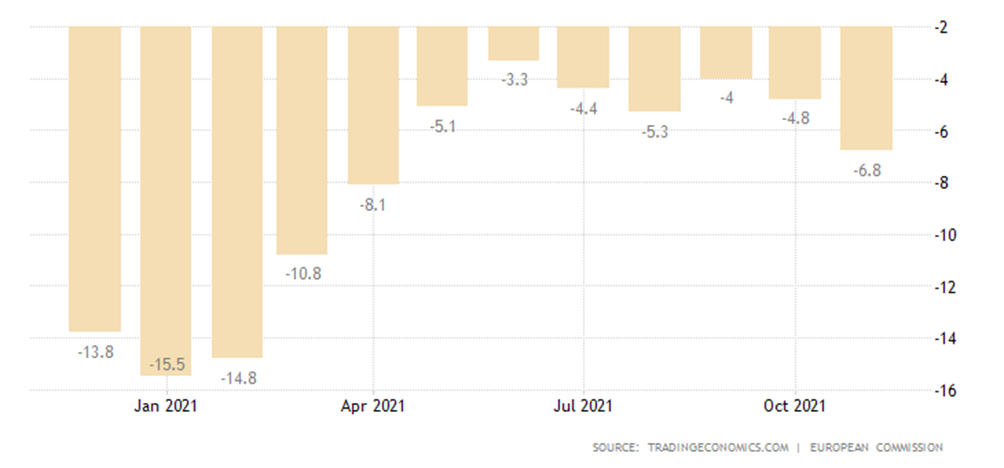
In the Euro Area, 7-month low in consumer sentiment:
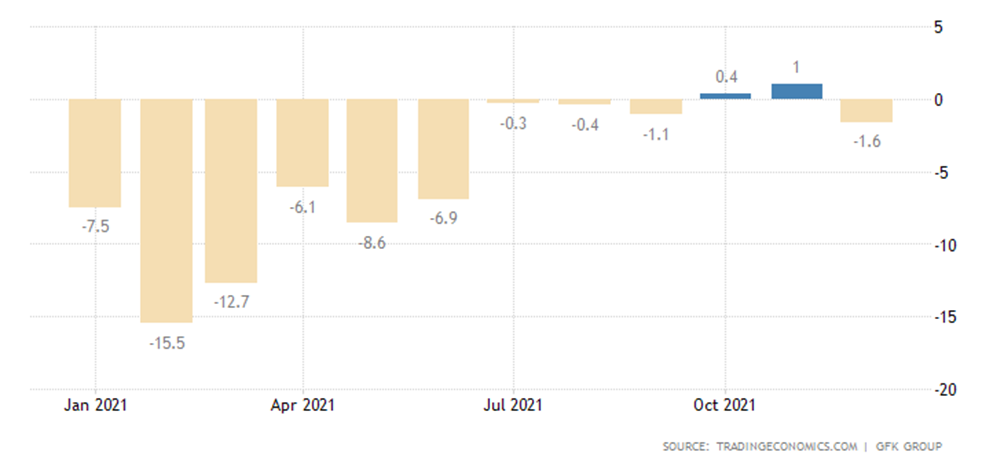
In Germany – 6-months low:
In New Zealand, in 13 years of observation, consumer confidence has been lower than it is today only twice – in April 2020 and early 2009:
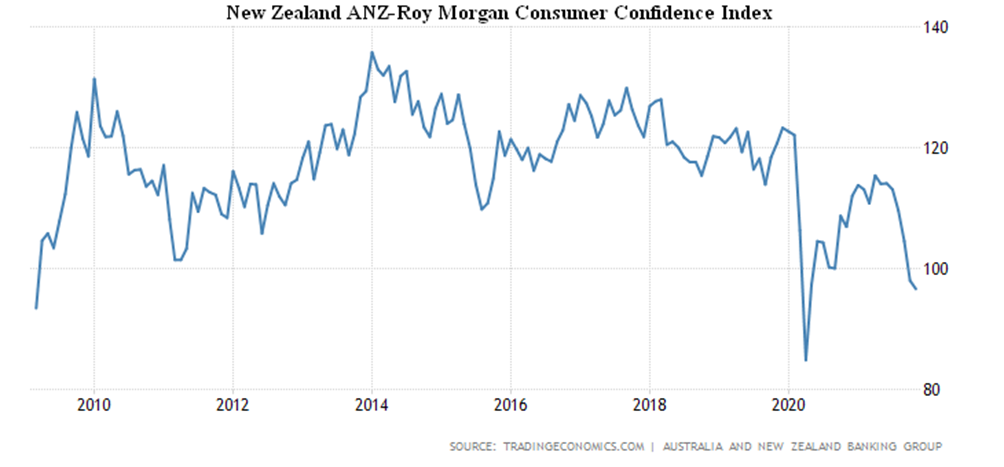
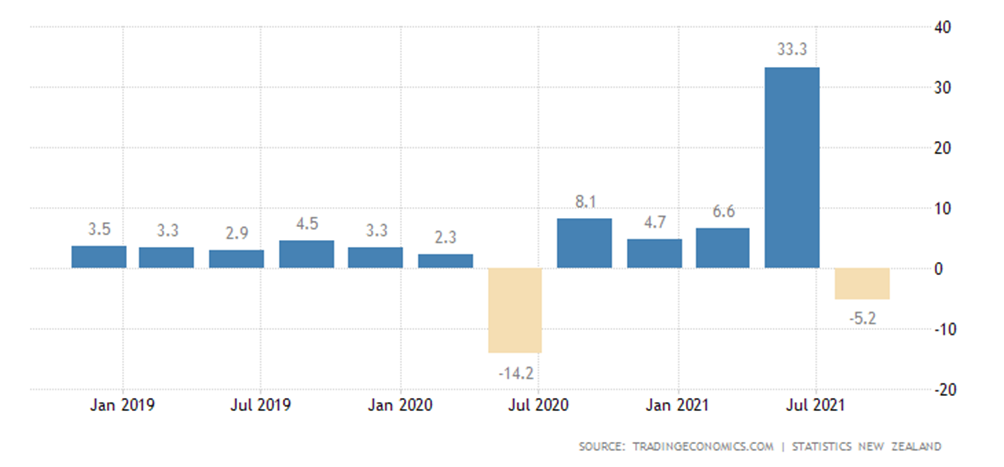
It shouldn’t be surprising that New Zealand Q3 retail sales -8.1% QoQ:
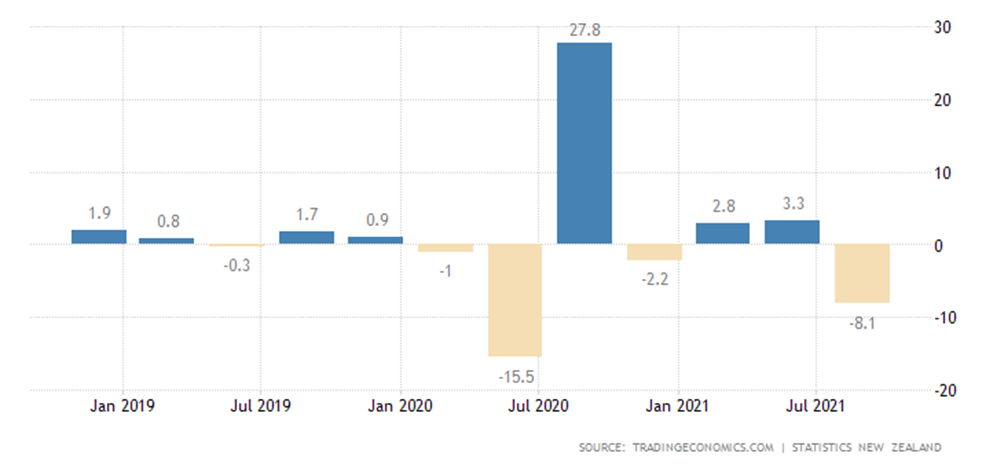
And -3.2% per year:
The Central Bank of China has left monetary policy unchanged, with further easing expected.
The Central Bank of New Zealand raised the rate for the second time in a row – 0.25% to 0.75%. Like the Central Bank of South Korea – 0.25% to 1.00%.
Because of the holidays in the United States, the week is shortened, there’s not much news.
Summary. When we concluded last week that the structural crisis had entered the “regular” phase, we certainly had some hope that we were wrong. Unfortunately, there is no reason to be optimistic – the crisis is continuing.
There is one news that can be interpreted as positive: the weekly initial jobless claims in the United States were only 199,000, with a forecast of 260,000 (268,000 a week ago). On the one hand, however, official US labor statistics are highly distorted – on the other hand, for example, orders for durable goods, excluding transport goods, tentatively for the month of October: -0.5% m/m in projection: 0.2% m/m. In September there was a -0.4% m/m. And this, taking into account the low inflation!
There are many other threatening trends, such as the increase in wheat prices:
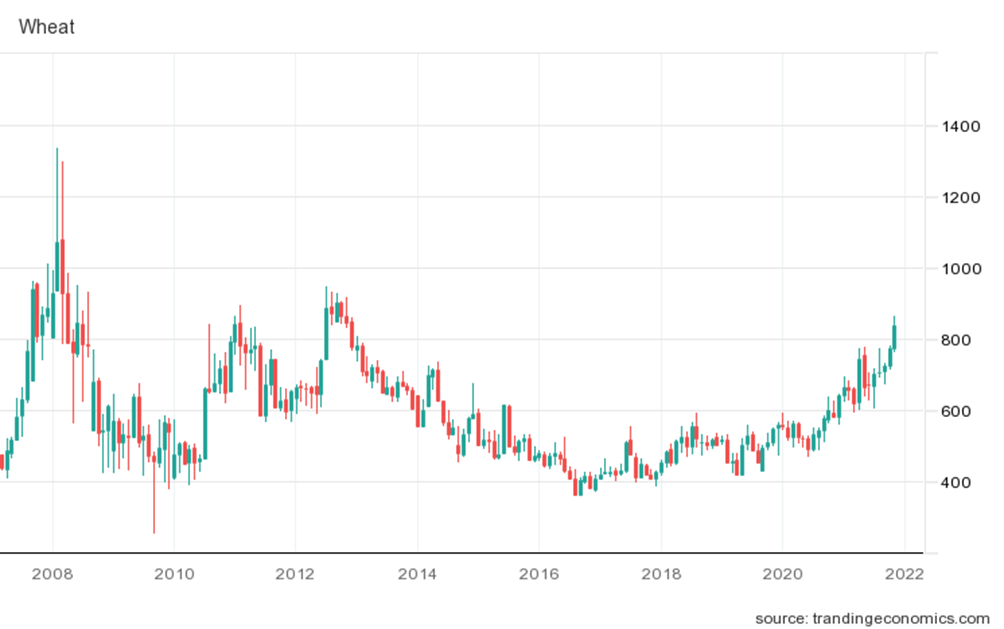
On the one hand, they have not yet reached their peak, and on the other, the standard of living of the population is falling. So it hasn’t come to starvation yet, but it’s time to think about it.
Finally, the most important indicator of the crisis is the efficiency of the US banking system. We recall that the credit multiplier, that is, the ratio of the extended money supply (aggregate M3) to the money base (cash money) in the normal economy should be between 4 and 6. If it is higher, there are financial bubbles, if it is lower, then there is a clear stagnation. In the U.S., the M3 data is classified and the M2 picture is:
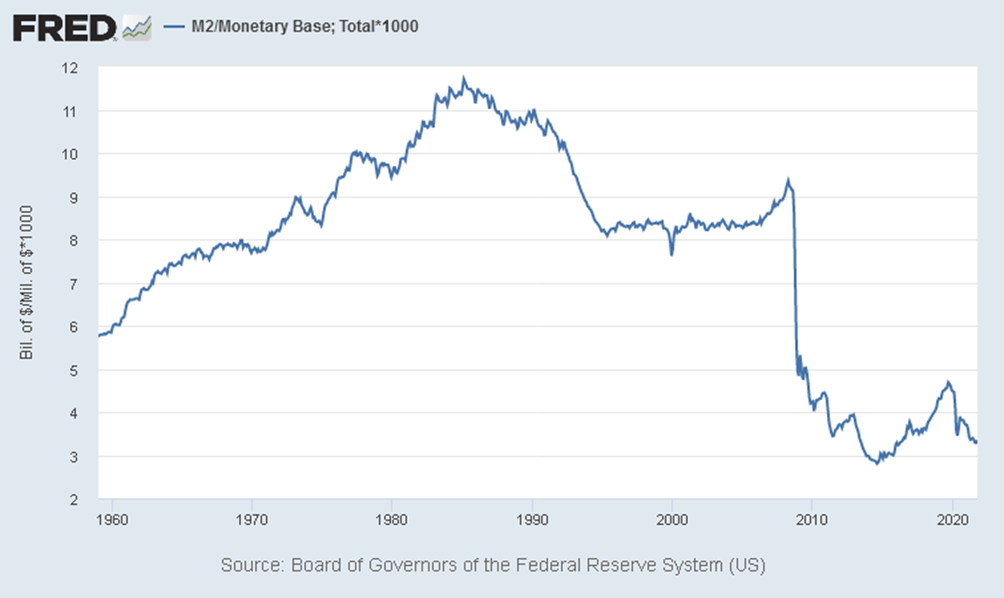
After the collapse of 2008 and attempts to normalize the situation in 2018-2020, the banking system clearly started to malfunction. In fact, banks are reluctant to finance the economy, which is the main proof that the crisis is unfolding. We should also note that a large proportion of the loans relate to purely financial transactions linked to speculative markets.
In general, it is sad to note that the assertion made in the previous Review that the structural crisis has entered a regular phase (with 6-8% of the decline per year) has received further confirmation this week.
We wish all our subscribers a successful working week!