
September 30 – October 6, 2023
Big news. Oddly enough, nothing fundamentally new is happening in the global economy. More precisely, there are very few events that can be considered as the beginning (or the end) of any new significant trends. However, one thing seems interesting to us.
We have been saying for many months that a structural decline has begun in the world economy, and it’s pace, as expected according to theory, remains virtually unchanged. At the same time, it is difficult to calculate it from the most popular statistical data, since they are mercilessly falsified. Yes, a large amount of macroeconomic data (as in our reviews) allows us to restore the picture, but it would be nice to see that this decline is the normal picture of the economy today.
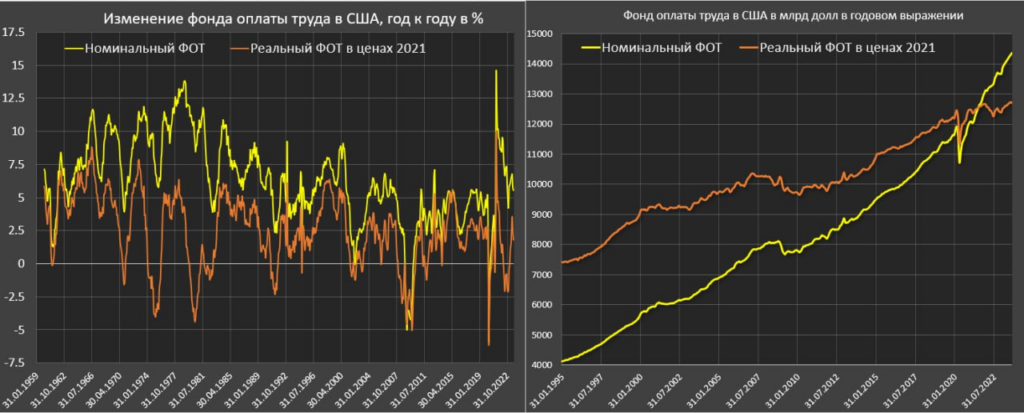
As usual, this week data was released on the length of the working week in the United States, which turned out to be the same as last week – 34.4 hours. And these numbers, slightly fluctuating, have been relevant for many months. But the data on average wages for the year has changed, previously the growth was 4.3%, but now it is 4.2%. The weekly growth of 0.2% remained unchanged.
In fact, this means that the current situation in the US economy is the new norm. We see that there is a decline that began in the fall of 2021, which is hidden in the statistics. The theoretical estimate gives the magnitude of this decline at 6-8% of GDP per year, but it will be possible to verify these figures in practice only after some time. But if our hypothesis is correct (and it is very similar to the truth), then the given indicators show that the US economy has adapted to this uniform (structural) decline, which is expressed, first of all, in a decrease in the standard of living of the population due to inflation, with small nominal income growth.
Macroeconomisc. Italy’s GDP -0.4% per quarter:
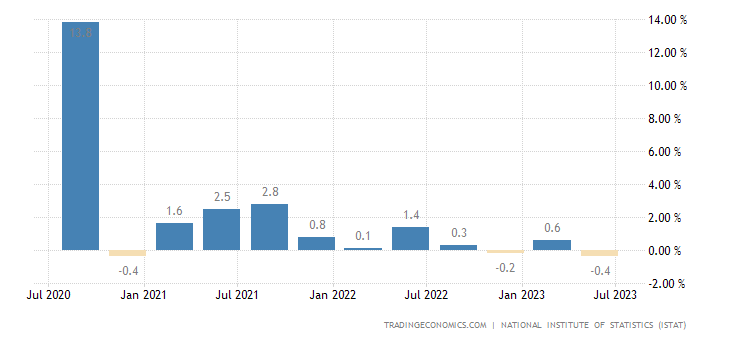
Pic. 1
Industrial production in South Korea -0.5% per year – the 11th minus in a row:
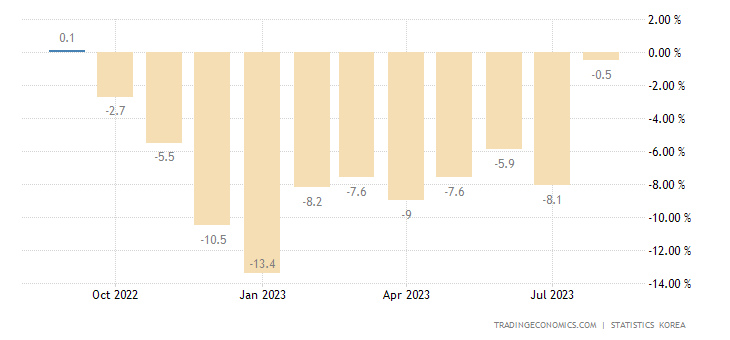
Pic. 2
In Spain -3.4% per year – the 5th minus in a row:
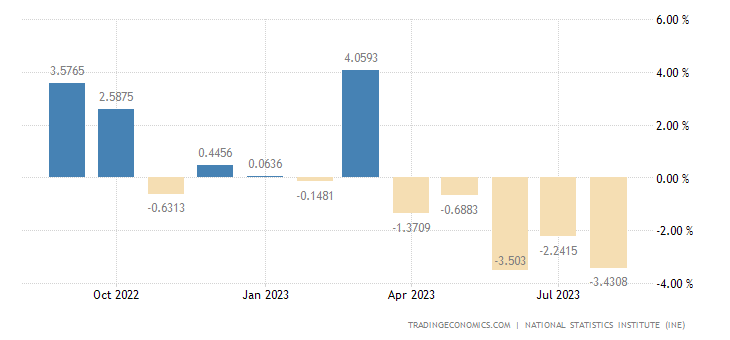
Pic. 3
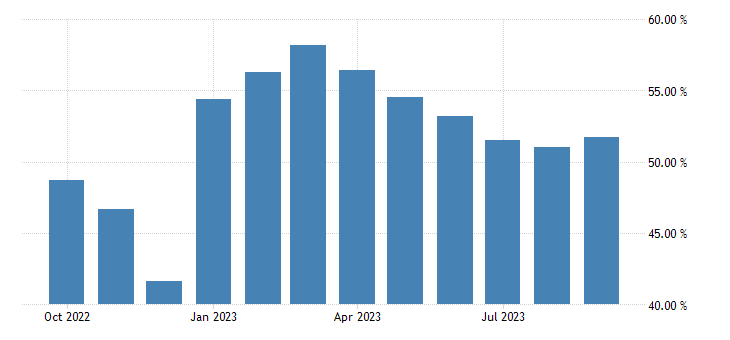
The official PMI (expert index of the state of the industry; its value below 50 means stagnation and decline) of the Chinese industry was above 50 points for the first time in six months:
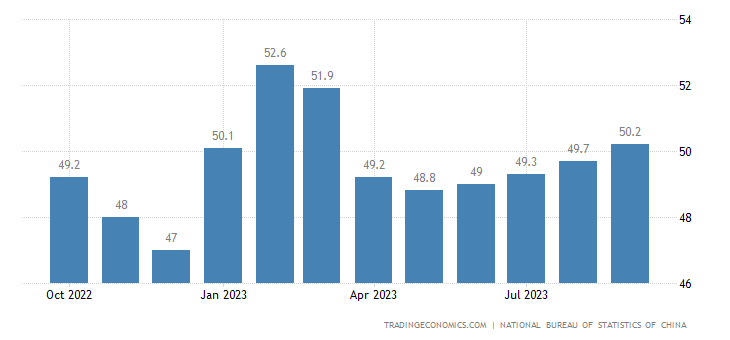
Pic. 3
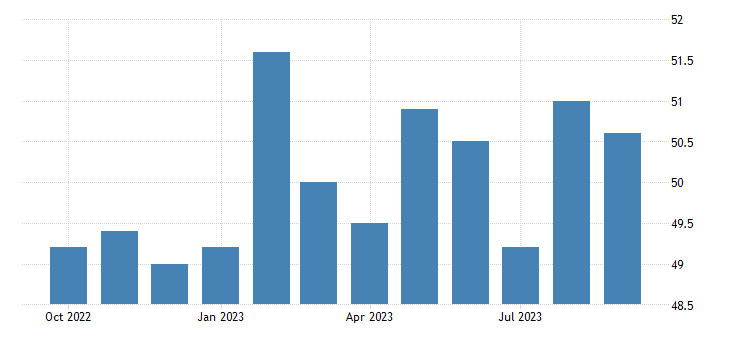
The same is true for the service sector:
Pic. 4
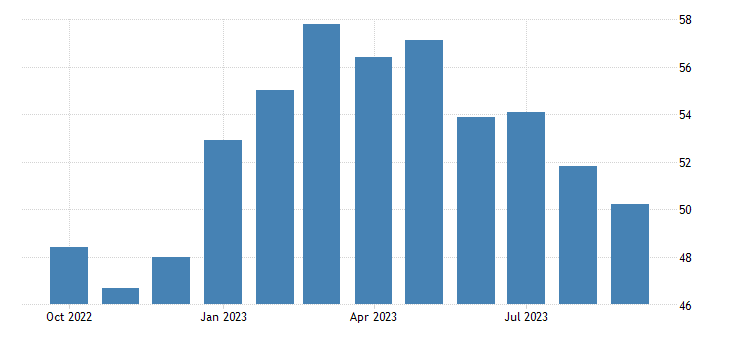
A private review is not so optimistic, although it also shows an industrial index above 50 points:
Pic. 5
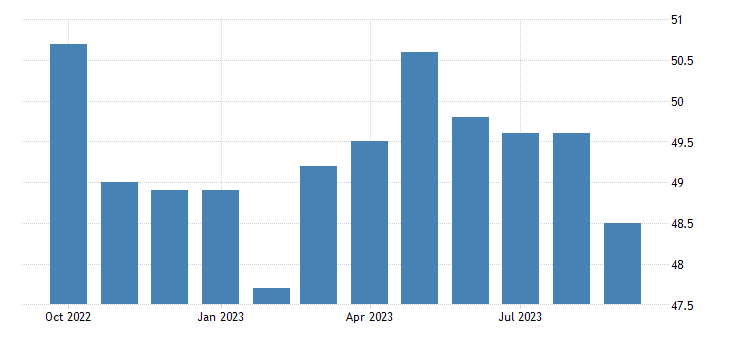
As well as the service sector indicator – however, it is still minimal for 9 months:
Pic. 6
There are no grounds for overcoming the crisis, so, most likely, this is a specific distortion of statistical data. However, Chinese economic statistics are generally a strange and uninformative thing.
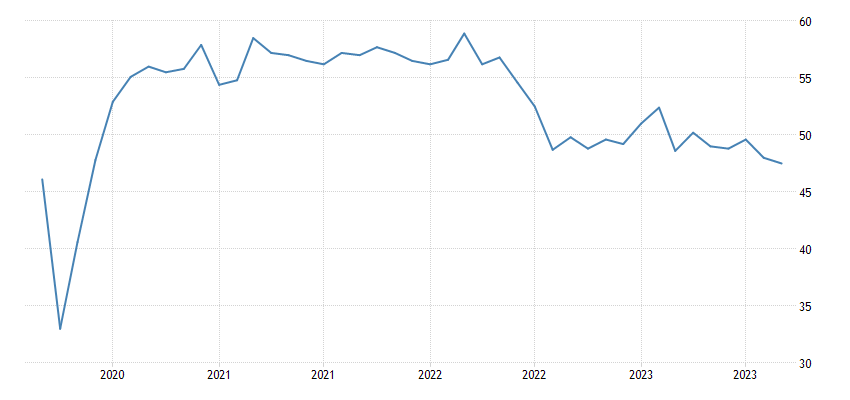
Japan Industrial PMI in decline zone (48.5) and worst in 7 months:
Pic. 7
Canada also has a decline (47.5) and the worst value in 3.5 years:
Pic. 8
In the eurozone, the indicator has been in decline (43.4) for 15 months in a row:
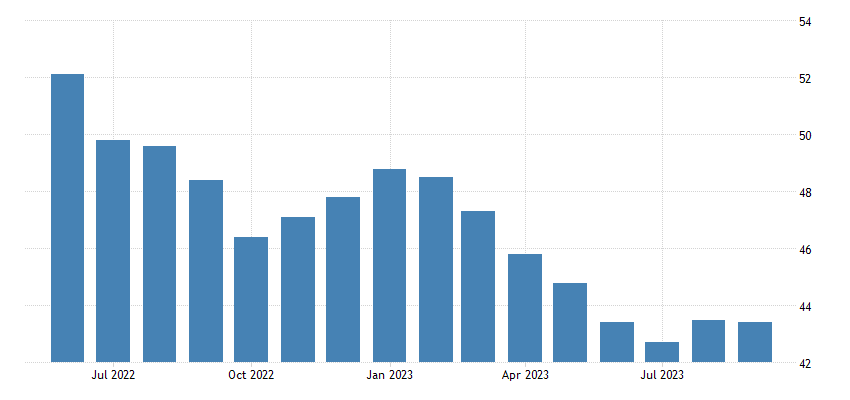
Pic. 9
Not the fall of 2021, of course, but if we take into account the systemic underestimation of inflation, then our reasoning from the previous section rather confirms this.
In Britain – 14 months (44.3):
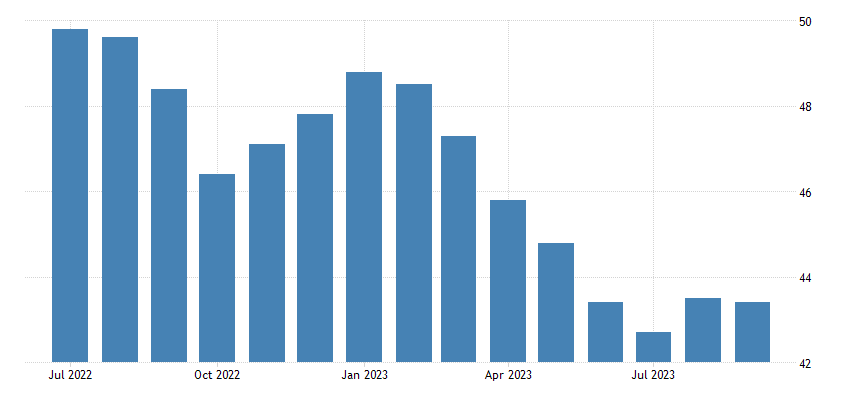
Pic. 10
Germany’s construction PMI is 39.3 – without taking into account the failure of 2020, this is a record low:
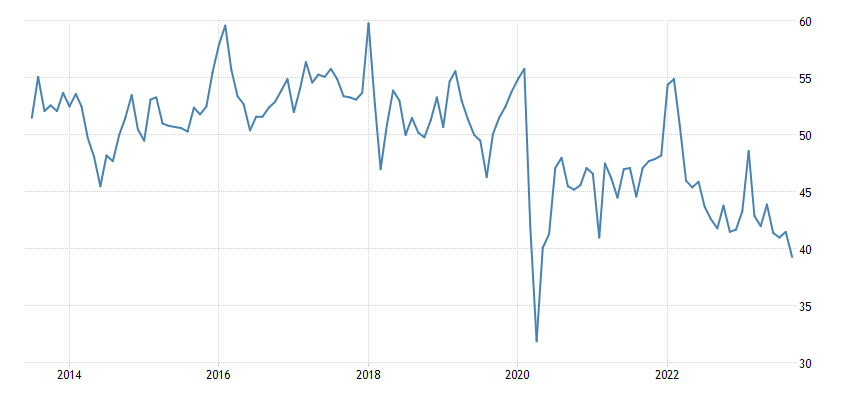
Pic. 11
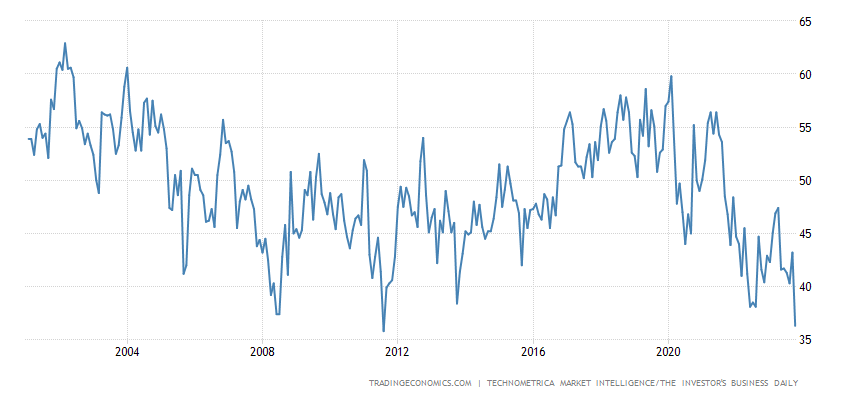
Economic optimism in the US (36.3 points) is near the record low of 2011, expectations for six months ahead have broken it and the worst in 23 years of data collection, financial stress is at its peak since 2008:
Pic. 12
Note that small fluctuations in market conditions, even in a negative direction, usually do not change optimism too much. But here we clearly have the effect of a very long-term deterioration. This also confirms our assessment of a long-term structural decline.
Accordingly, US mortgage applications hit a new 26-year low:
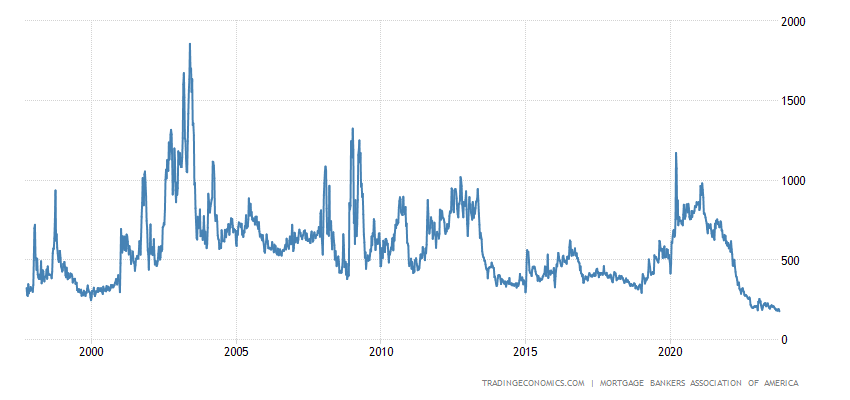
Pic. 13
Including demand for loans for purchases (not refinancing) – a 28-year low:
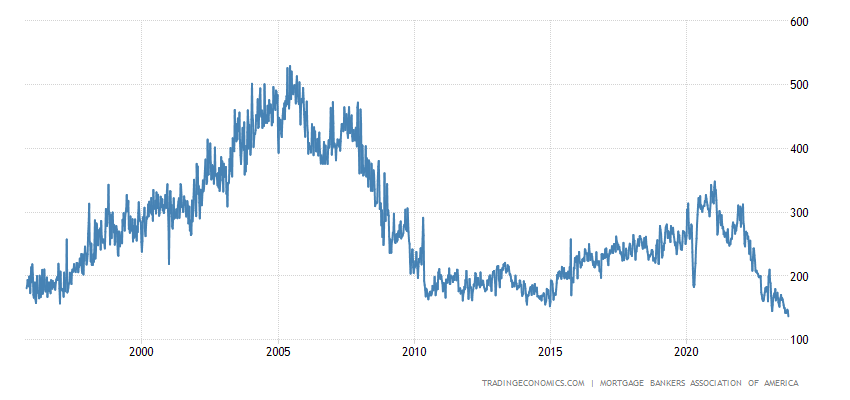
Pic. 14
30-year loan rate at 23-year peak (7.53%):
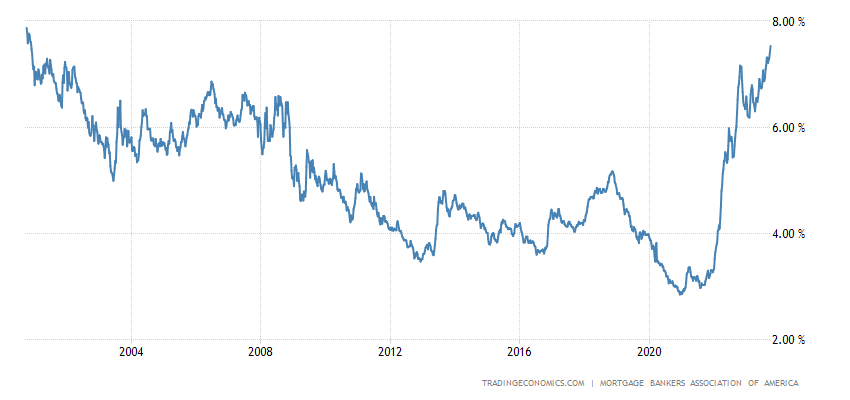
Pic. 15
House prices in Britain are still falling at the fastest rate since 2009 (-5.3% per year):
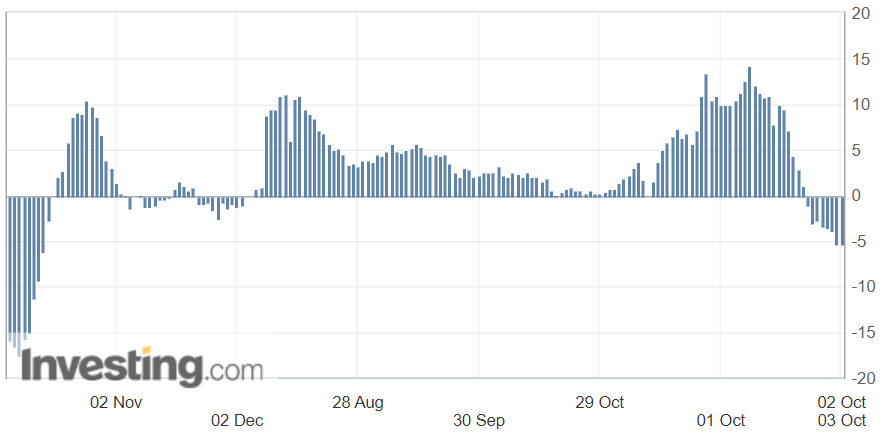
Pic. 16
Another review (from Halifax) says the same thing – it has -4.7% per year, and this is also a 14-year bottom:
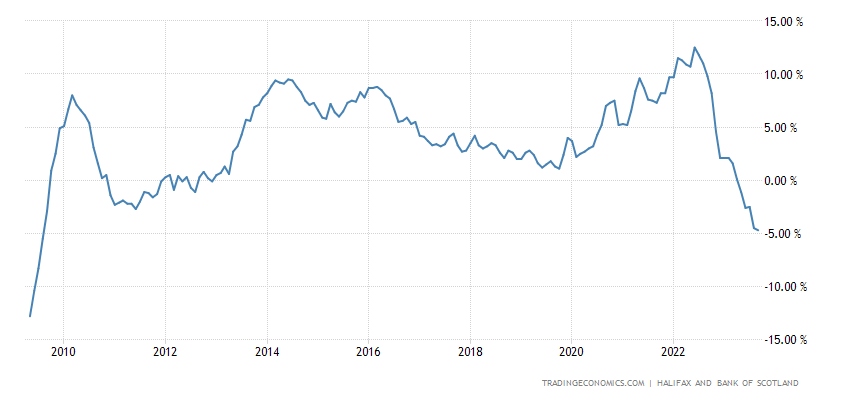
Pic. 17
What is to blame for the 25-year peak in 30-year mortgage rates (7.93%):
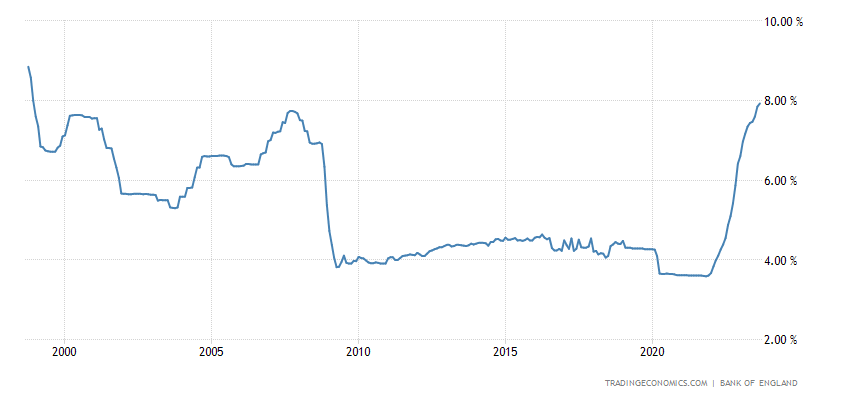
Pic. 18
PPI (industrial price index) of the eurozone -11.5% per year – a record low for 42 years of observation:
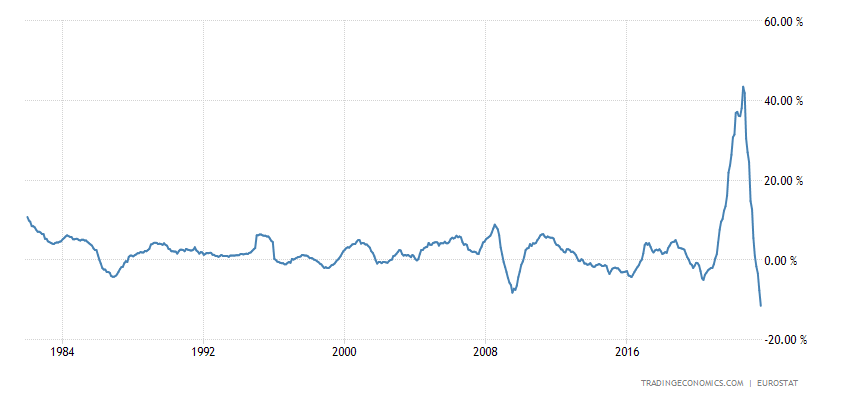
Pic. 19
This is generally a direct sign of an economic catastrophe. The trouble is that the average person doesn’t understand this.
In France, the budget deficit for January-August was a record:
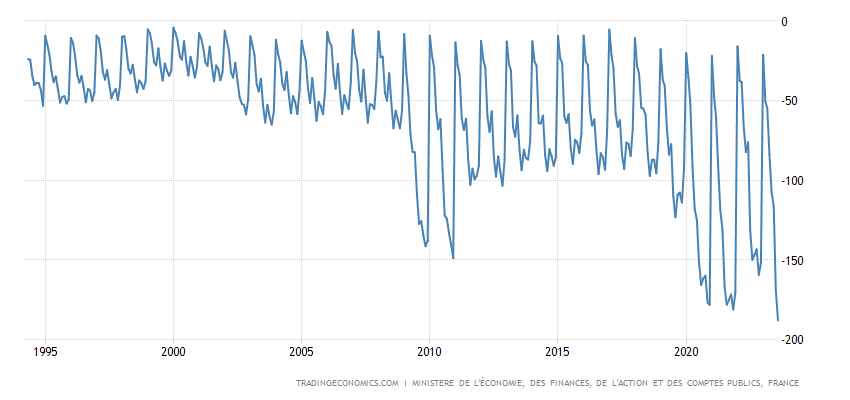
Pic. 20
US private sector employment growth is at its lowest in 32 months:
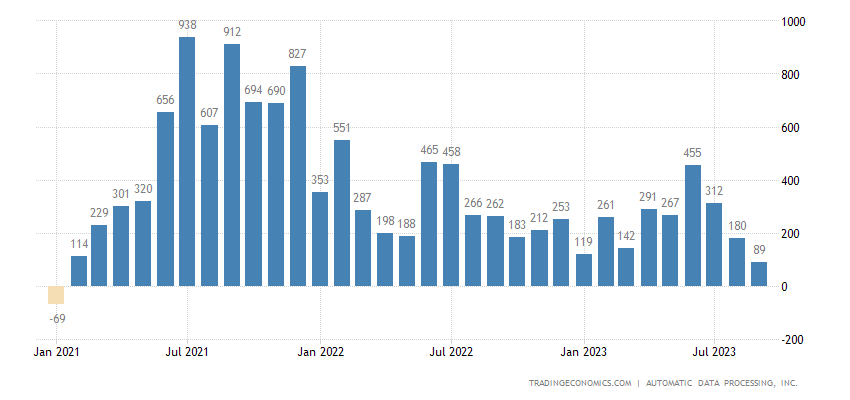
Pic. 21
And the planned layoffs in January-September are the highest since 2009 (not counting 2020):
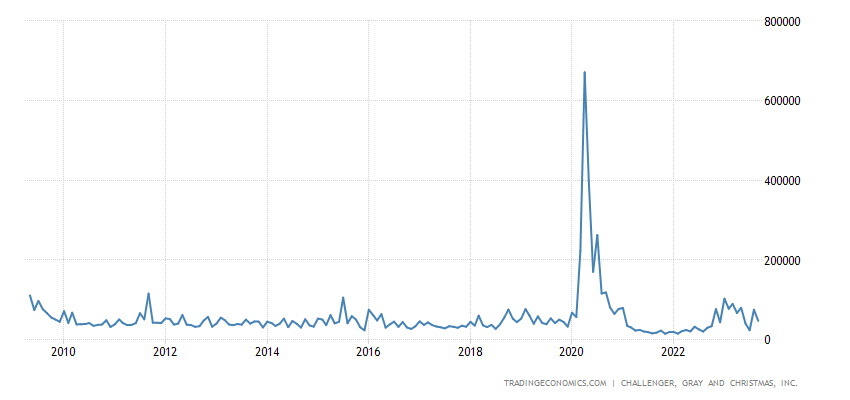
Pic. 22
Taking into account the data presented in the first section, these data can be treated with some distrust (usually, layoffs begin after a reduction in the working week and wages), but there may be two counter processes in which workers are fired, and part of the saved wage fund goes to compensate those left behind.
The volume of retail sales in the eurozone -2.1% per year – the 11th monthly minus in a row:
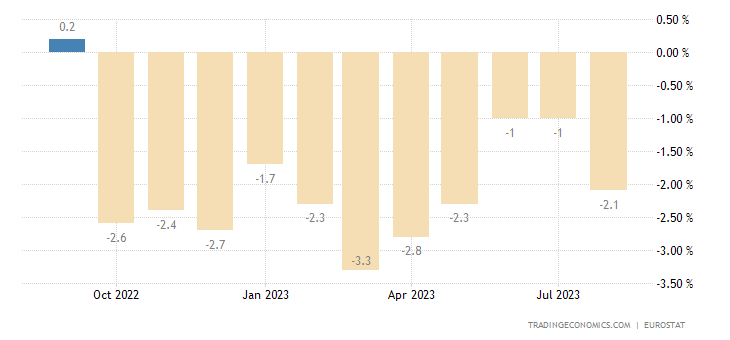
Pic. 23
Japanese spending -2.5% per year – 6th minus in a row:
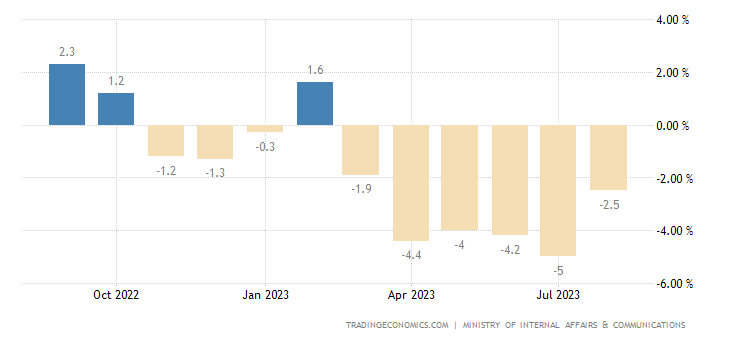
Pic. 24
The Central Bank of Australia left its monetary policy unchanged, as did the Central Bank of New Zealand and the Central Bank of India.
Main conclusions. The rise in rates caused an increase in the yield of government securities:
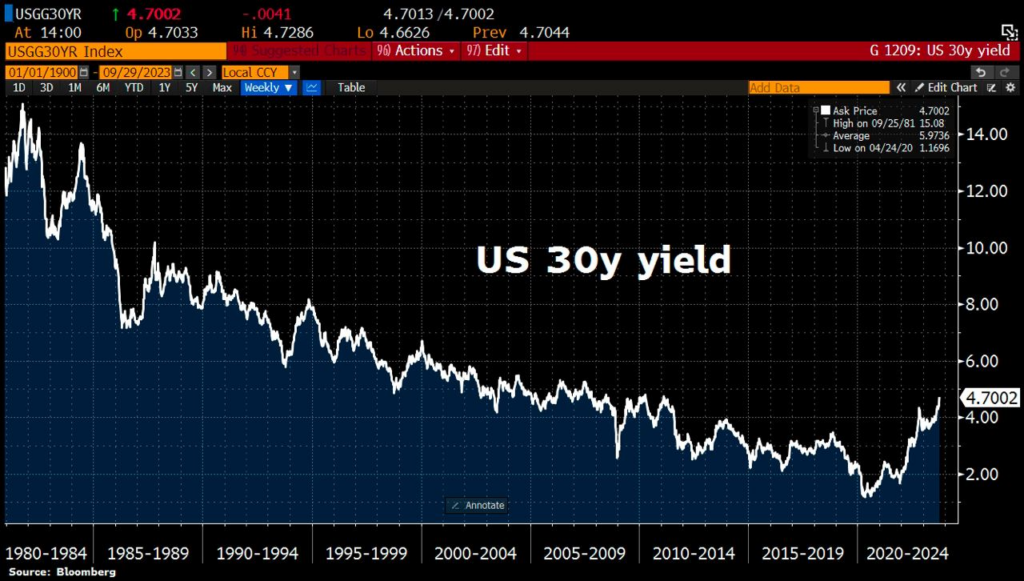
Someone will say – “Well, not so much!” But taking into account the accumulated debt… Yes, there are no models of at what rate all this will collapse and such models cannot be (all available models were more or less adequate with completely different combinations of parameters), but the fact that the strength of the system is decreasing all the time is obvious.
And all this against the backdrop of a sharply growing public debt:
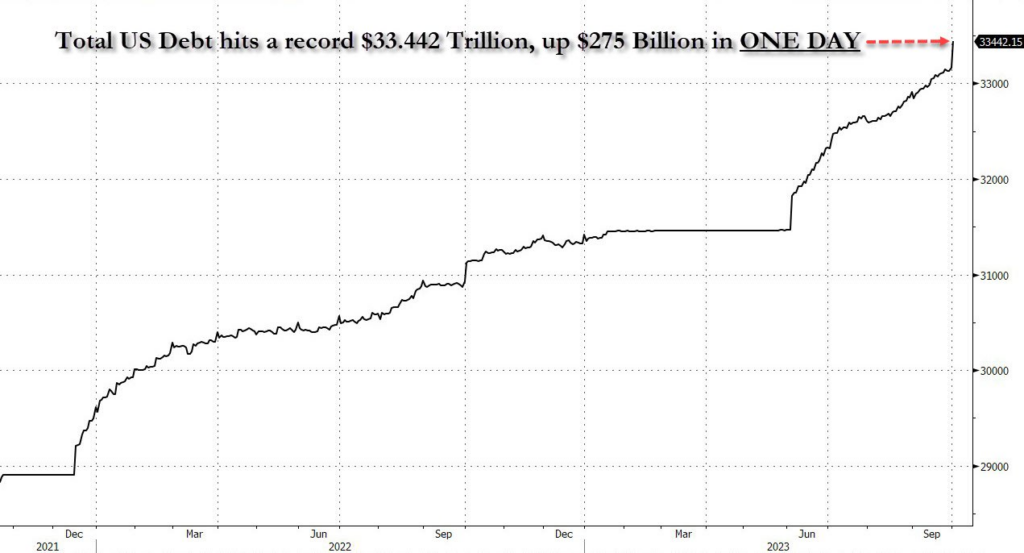
But maybe this is not critical? Are other indicators more optimistic? And here we remember that many indicators in American statistics cannot be trusted. Some may think that we are exaggerating. But here is the latest data from Pavel Ryabov (Spydell):
“Lost $2.6 trillion in national savings in the United States after one of the largest revisions of macroeconomic statistics at the Bureau of Economic Analysis (BEA). The historical series were revised since 1981 (!), and the most intensive accumulation of errors began to occur from 2013 to 2021, which accounted for almost 80% of the entire revision.
According to new data, savings until 2023 were lower, and from 2023, on the contrary, higher. According to new data, the savings rate in 2019 was 7.4% (before the revision – 8.8%), and from 2013 to 2019 on average 5.6% (previously – 7.1% ).
In 2019 money, savings are estimated at $1.19 trillion for the year, and before the revision – $1.44 trillion. From 2013 to 2018, accumulated savings are now $4.7 trillion, but were almost $6 trillion!
During the period of active accumulation 2020-2021, the savings rate was 13.2% or $4.8 trillion, and there were 14.3% or $5.23 trillion. In 2022, on average 3.3% (568 billion per year), and according to old data 3.6% (658 billion), and in 2023, on the contrary, is higher, at least for the first half of the year – 5% ($497 billion for 1H 2023), and previously it was believed that the savings rate was 4.4% or $427 billion.”
Further, we have written a lot about the fact that the main conclusion from Russia’s SWO in Ukraine is the impossibility of reindustrializing the US economy at the expense of the domestic market. And why? Let us again refer to the calculations of Pavel Ryabov:
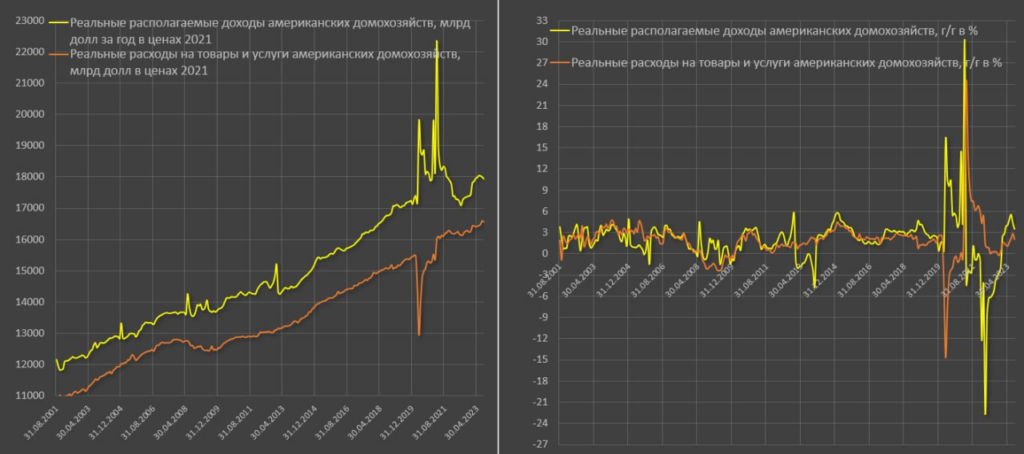
“The pace of consumer spending (goods + services) in real terms is growing extremely weakly – plus 2% y/y, only 2.3% over two years, but 7% growth compared to February 2020. It’s fair to talk about stagnation on a high base.
Income grew less significantly – 3.5% y/y, minus 2% over two years and plus 3.1% since February 2020, where almost 3 percentage points is the effect of manipulation with statistics, when the 2019 income base was underestimated by 1.5%, and current income increased by 1.5%.
As a result, the savings rate is near a historical low of 3.9%.
It turns out that the “forced” growth of expenses occurs at an insufficient rate of income growth, which naturally reduces the savings rate, and this acts as the main limiter for a sustainable increase in expenses in the future. The reduction in the savings rate is realized by accelerating the cost of servicing the debt, which is in the phase of active expansion.
Wealthy Americans receive income from assets and business activities, but their spending patterns remain largely unchanged in line with income trends, while for low- and middle-income Americans, any shift in income is directly reflected in spending.
The main source of income is still wages from hired work. The trend here is negative. Yes, nominal incomes are growing at 5.6%, well above the typical 3.5-4% between 2010 and 2019, but inflation is completely different. The payroll in real terms is growing by 1.8% y/y, only by 1% over two years and plus 2% by February 2020 (inflation eats up all nominal growth).
The state can save the situation, but it is not saving it yet. The gross volume of government transfers to the population in real terms fell by 1% y/y, decreased by 14% over two years (disconnected “helicopter” money), but increased by 7.2% since February 2020.
Given the depletion of savings, the slowdown of the corporate sector and sluggish government support, there is no resource for rising costs, and the risks of a crisis are growing.”
In general, we see more and more often that rare optimistic figures can (and should) be questioned, but a large mass of pessimism presses and presses… Next week data on September inflation will be released, including on the full volume of industrial output . The same ones that have been causing serious deflation in the US for four months now.
This will be very important data, especially since it is less susceptible to falsification (public attention to this indicator is insignificant). However, based on data from the European Union, one cannot expect much optimism. But, let’s see. In the meantime, we wish our readers a relaxing weekend and a work week without unpleasant news!