
November 4 -10, 2023
Big news. Preliminary data on US GDP in the third quarter (published a couple of weeks ago) and Powell’s speeches (see the final section of the Review) put many in a positive mood. For this reason, the main news of the week will be the data on the average length of the working week in the United States, published on November 3. We did not list them in the last review, since the main news was different, but this indicator speaks volumes about the real development of events.
So, the average working week in the United States has decreased from the previous value of 34.4 hours to 34.3 hours.
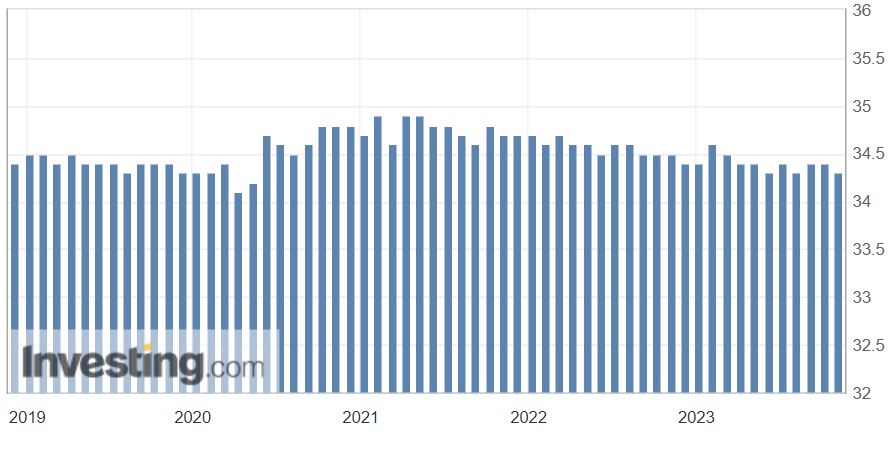
This indicator, as can be seen in the picture, is very conservative and therefore it is absolutely impossible to believe that it can decrease with economic growth. If the economy grows, the burden on the workforce increases, not decreases. We noted this several reviews ago (https://fondmx.pro/en/weekly-wrap/in-realiry-it-is-not-what-it-is/) when we commented on US GDP data for the third quarter. Namely, that these data are not related to reality, but are the result of a very specific processing of already not entirely correct primary data.
In fact, these data tell us that there is no real economic growth in the United States and that is what all our surveys say. Which thus describe economic reality better than US officials.
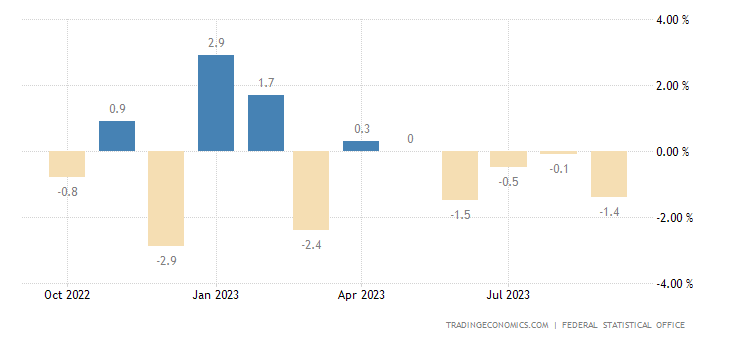
Macroeconomics. Industrial production in Germany -1.4% per month – the 4th minus in a row (and another zero before that):
Pic. 2
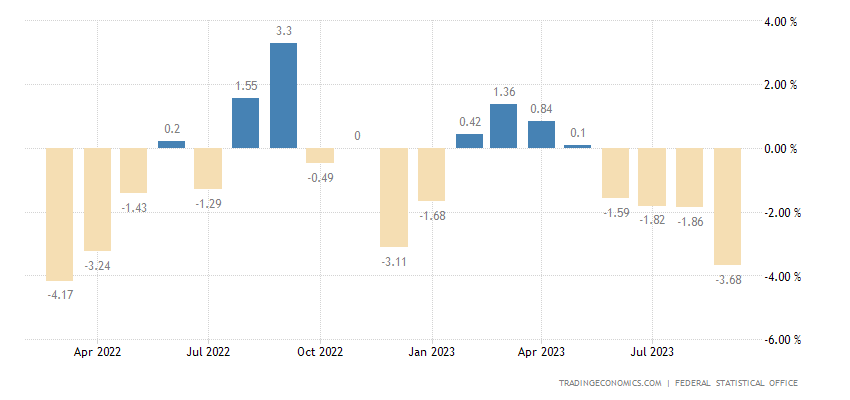
And -3.7% per year – the weakest dynamics in 1.5 years:
Pic. 3
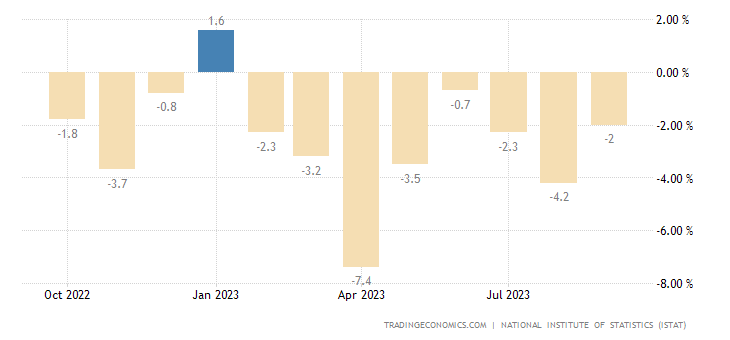
Industrial output in Italy -2.0% per year – 8th minus in a row:
Pic. 4
The construction PMI (expert index of industry health; its value below 50 means stagnation and decline) of the eurozone (42.7) has been in decline for 18 months in a row –

Pic. 5
In the eurozone, PMI in the services sector has been at a minimum for almost 3 years, and without taking into account Covid-related dips – since the beginning of 2013:
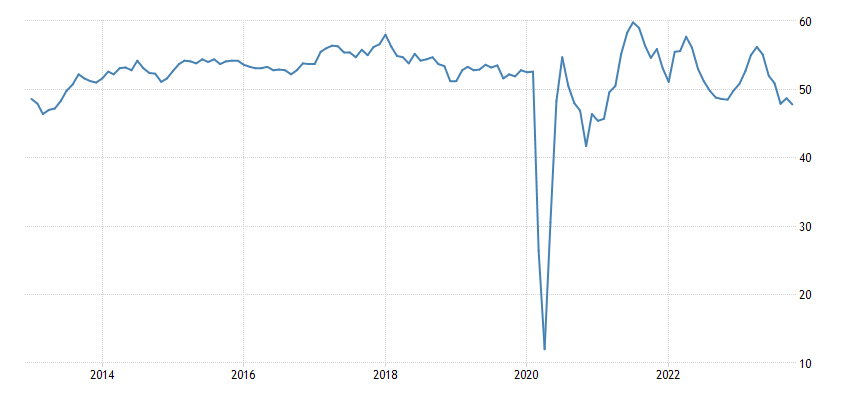
Pic. 6
The eurozone construction PMI (42.7) has been in decline for 18 months in a row:
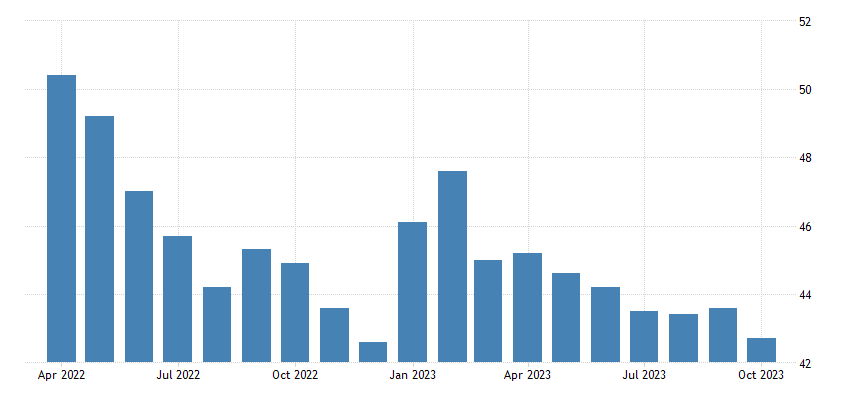
Pic. 7
UK construction orders in Q3 -20% per year – the worst dynamics in 3.5 years:
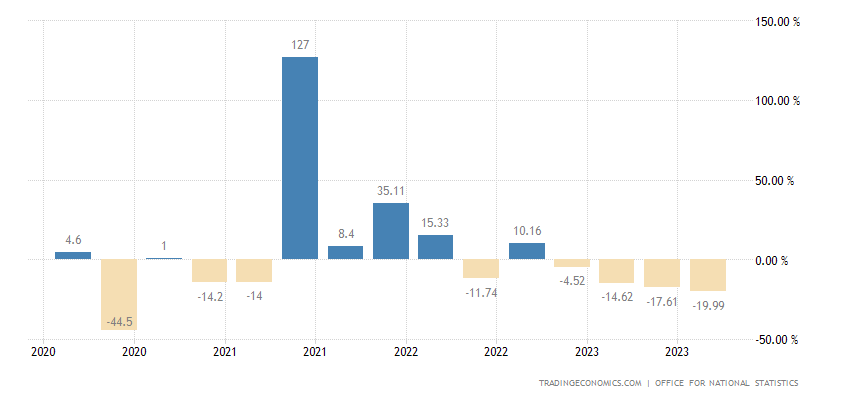
Pic. 8
New Zealand Manufacturing PMI 42.5 – not counting the fall due to Covid, this is the bottom since 2009:
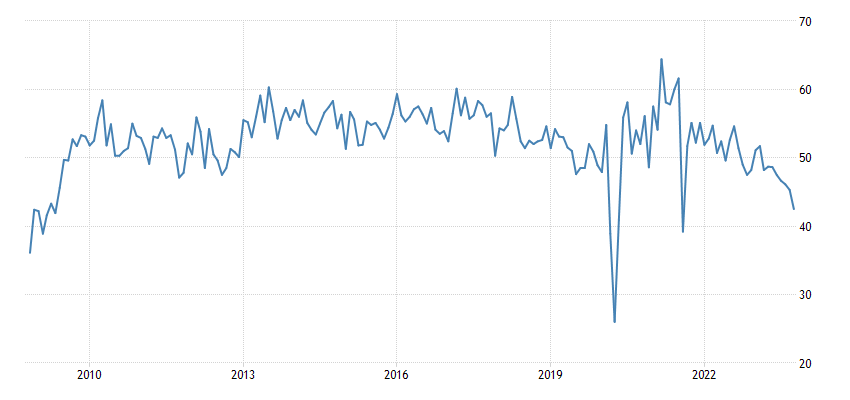
Pic. 9
Japan Services PMI worst in 10 months:
Pic. 10
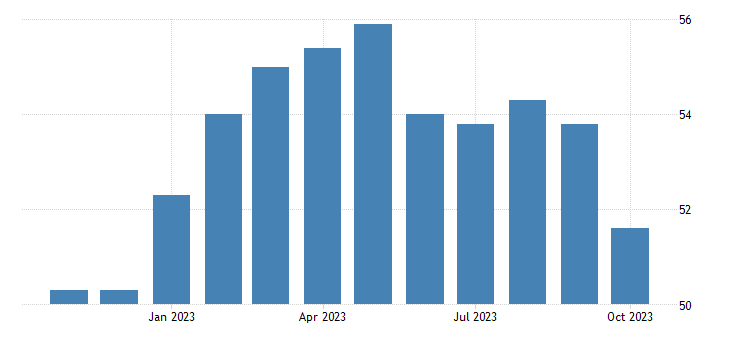
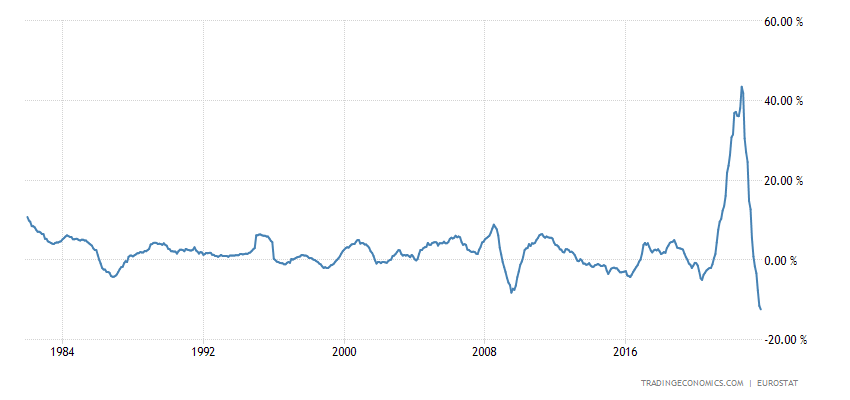
Building permits in Australia -20.6% per year – the 24th negative in a row:
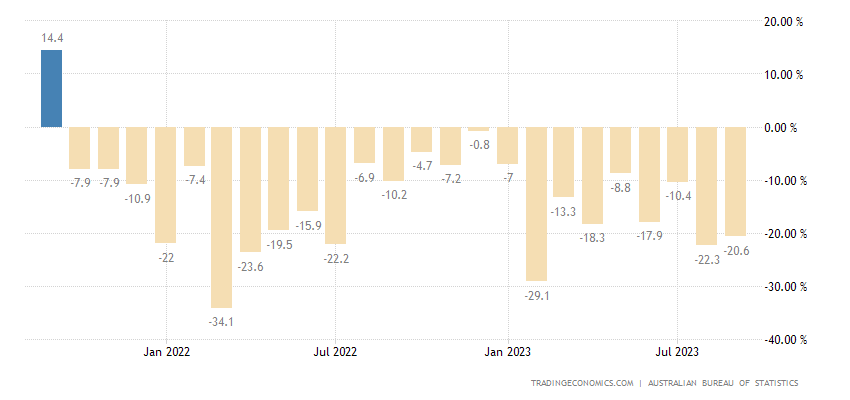
Pic. 11
The indicator is at the levels of 2008/12:
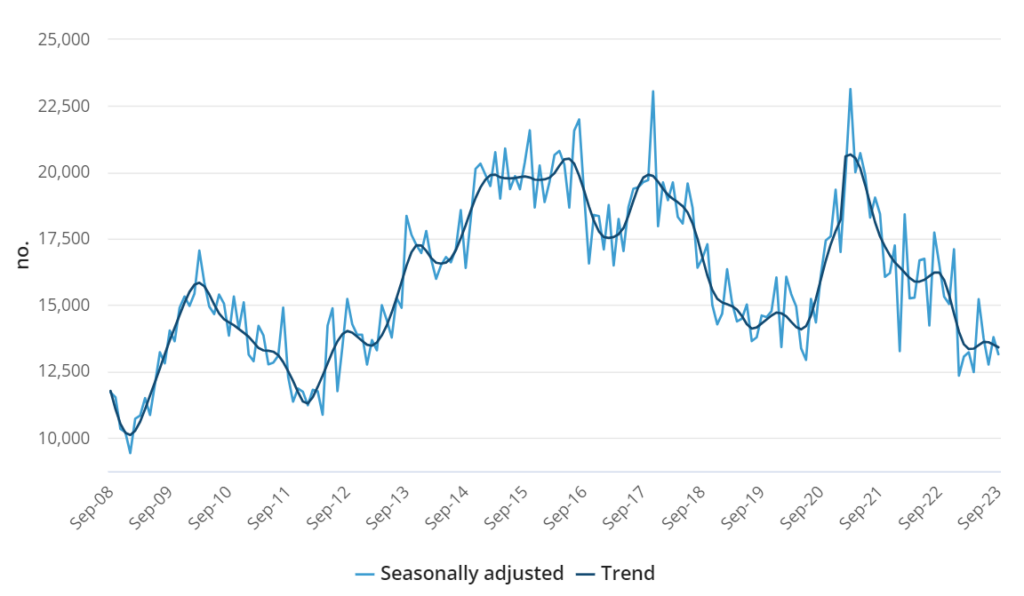
Pic. 12
5-year US inflation expectations (University of Michigan version) reached a 15-year peak of 3.2%:
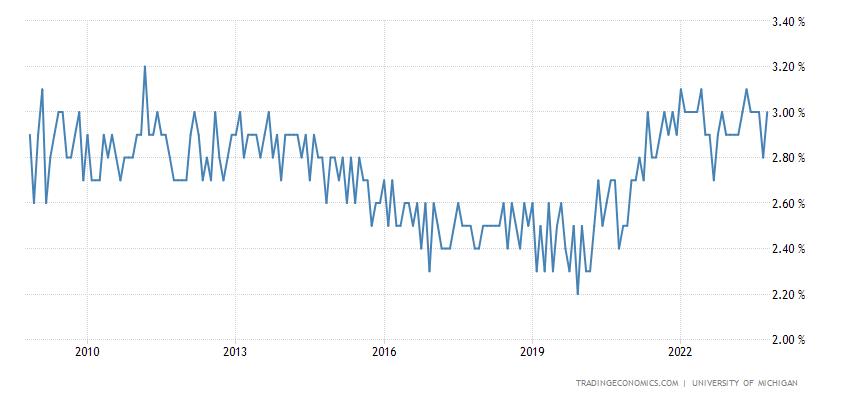
Pic. 13
It is not surprising that Powell is not satisfied with the current official value of this indicator.
Eurozone PPI (industrial inflation index) -12.4% per year – a record decline in 42 years of statistics:
Pic. 14
This is not at all surprising given the above indicators, but this level of deflation indicates an incredibly severe industrial crisis.
Job postings in Australia -3.0% per month – weakest in 26 months:
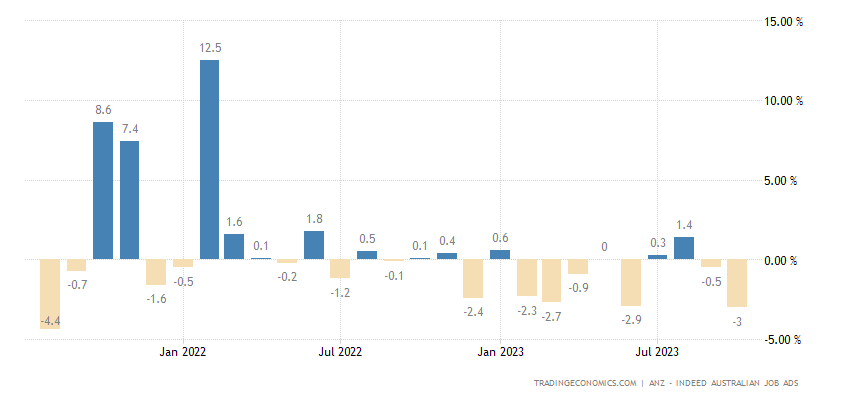
Pic. 15
The number of unemployment benefit recipients in the US is the highest in six months and near a 2-year peak:
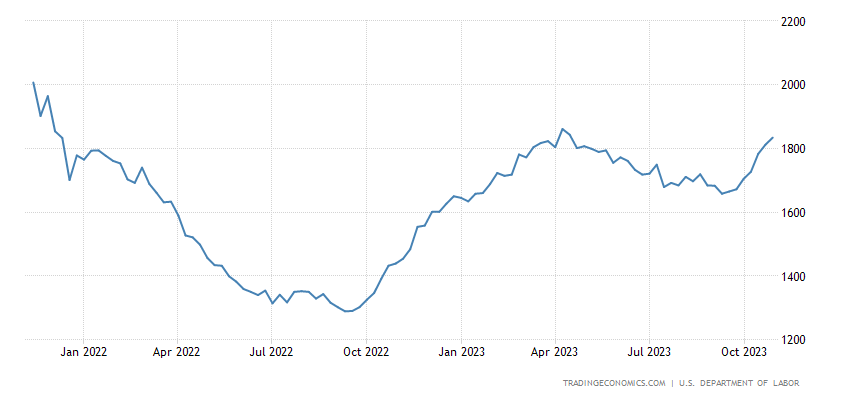
Pic. 16
Household spending in Japan -2.8% per year – 7th negative in a row:
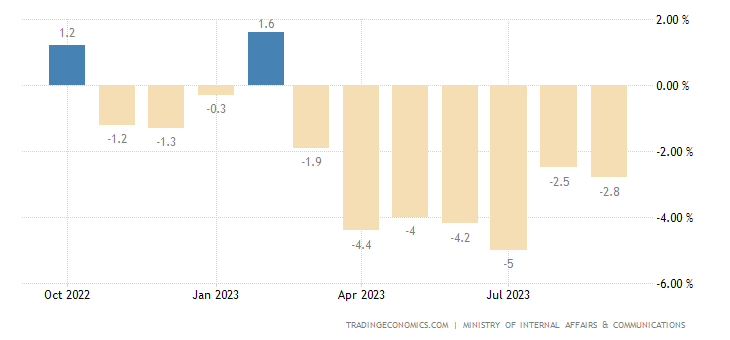
Pic. 17
The volume of retail sales in the eurozone is -0.3% per month – the 3rd minus in a row (and before that it was zero):
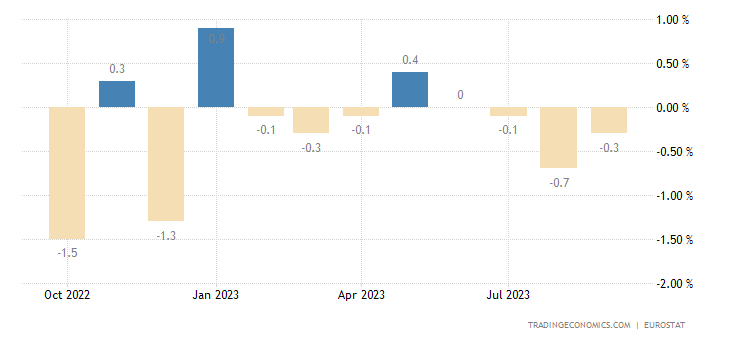
Pic. 18
And -2.9% per year – the 12th monthly minus in a row:
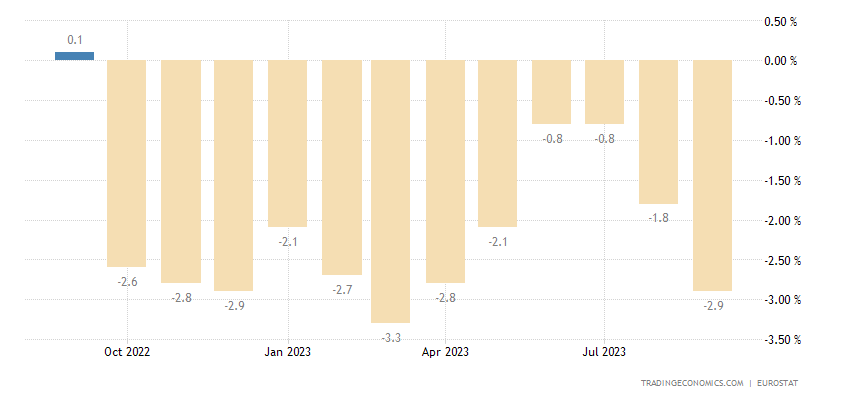
Pic. 19
The Australian Central Bank raised the rate by 0.25% to 4.35%. The Central Bank of Mexico remains unchanged.
Main conclusions. Powell’s next speech took place. The main points are given below:
- inflation has decreased, but is higher than our target of 2%;
- inflation will continue to decline for a long time;
- there is a desire for balance in the labor market;
- we expect a slowdown in economic growth in the United States in subsequent quarters;
- we must act carefully, but if there are risks of further growth in inflation, we will tighten monetary policy even more;
- we will continue to work until we achieve the goals that are set for us;
- the US economy is strong and temporarily resistant to rate increases;
- the biggest mistake now is the Fed rate not being high enough;
- The Fed is not going to ignore the significant rise in Treasury yields, but should not make any decisions right now;
- The Fed is in the range of restrictive rates, it is irrelevant to talk about neutral;
- some households and business segments do not care about the rate increase.
After the data on inflation expectations (see the previous section), Powell’s concern becomes clear: he either understands or feels the real state of affairs with inflation. However, we will examine this situation in detail in the next review, since in a week the October data on price growth (or fall) will be released. But to illustrate that everything is not very good with them, here is a graph of cocoa prices – they have updated their 45-year high:
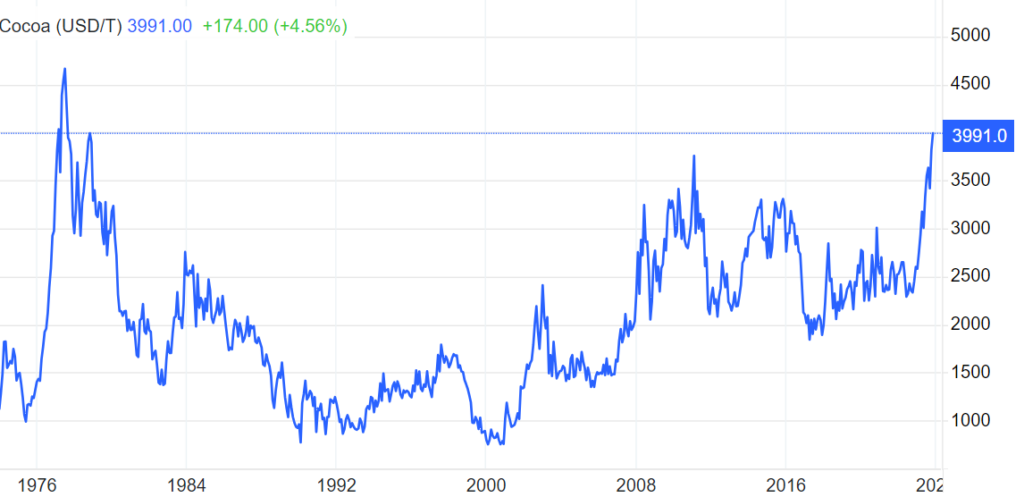
Pic. 20
Yes, this product is quite volatile, but 45 years… Against the background, as Powell says, of a slight increase in prices… It looks doubtful. In general, based on the results, we can only tell our readers that so far we have a more adequate view of the world than the Fed leadership, so that, unlike Powell, they can relax peacefully on weekends and work calmly during the work week!