
Time period: March 27 – April 1, 2022
Top news story. This week has gone without critical news. It was ordinary and quite. There was a debate about how to pay rubles for gas, and there was talk about which companies would leave Russia and which would remain, how to compensate for the rise in energy prices for citizens and so on. In other words, all the figures in the next section are now the usual indicators of the most innocuous week, which left the strongest impression.
Macroeconomics
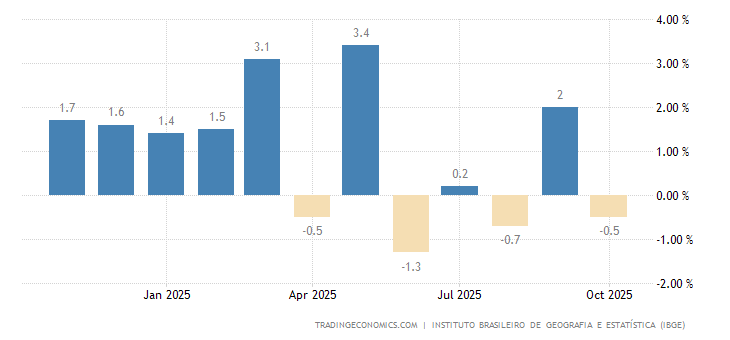
Brazil’s industrial output remains negative for 7 months in a row –
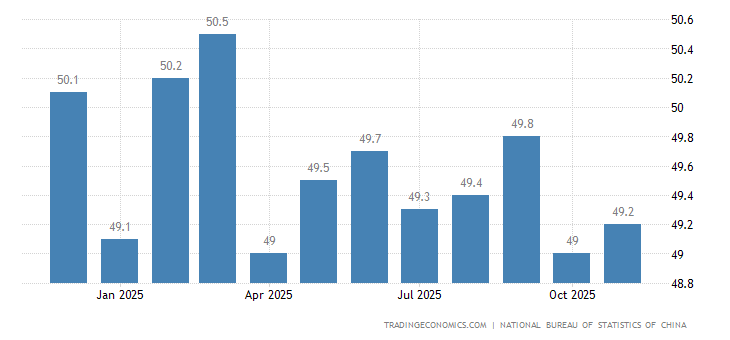
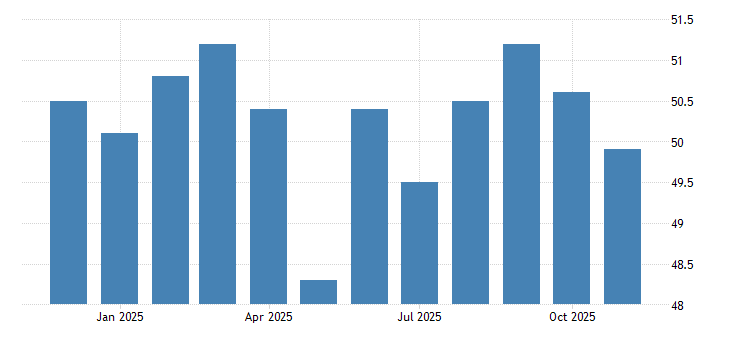
The official PMI (industry expert assessment index; below 50 means stagnation and decline) of the PRC industry is on the trough for 5 months and finally has reached the recession zone (49.5 points) –
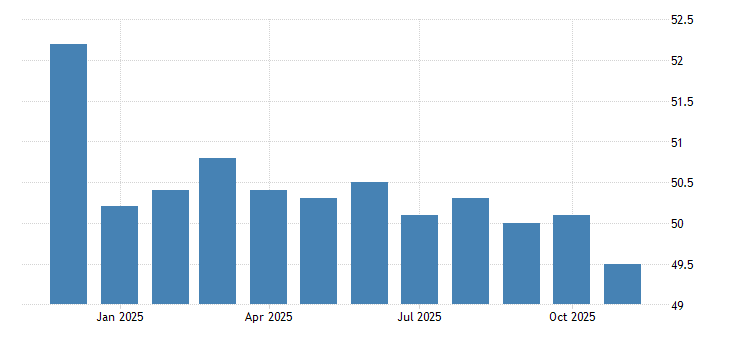
In other sectors 48.4 points, 7-month low:
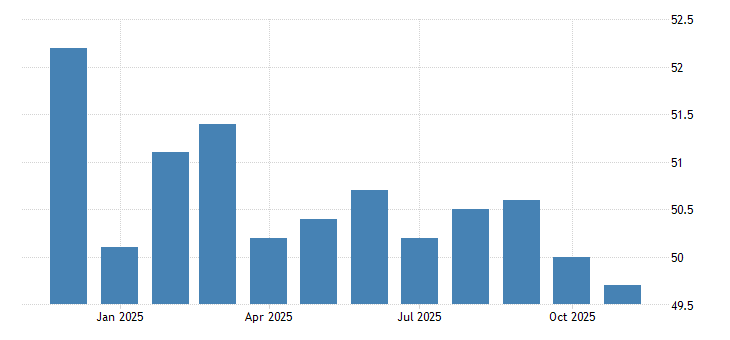
In general, the economy is on the trough since February 2020 (48.8):
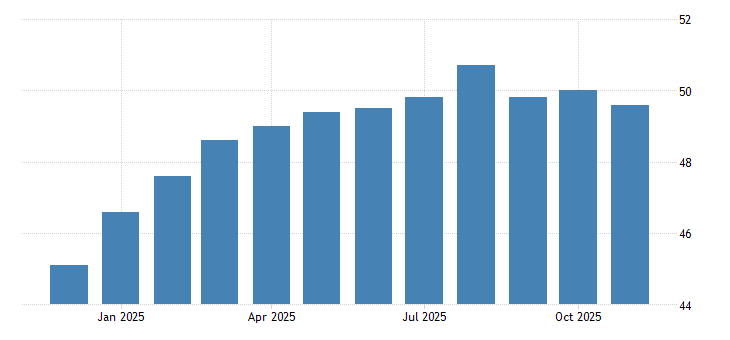
Independent review confirms manufacturing sector recession (48.1: 25-month low) –
Note that China has long gone to this result, and it can not be called an accident, however, for the largest producing economy of the world it is hard to expect growth in the enviroment where almost everything falls.
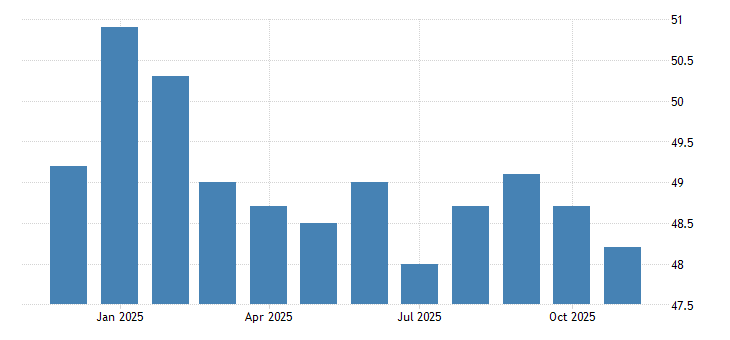
The Euro Area industry PMI is at its lowest:
Same in Britain:

And in the United States, from September 2020:
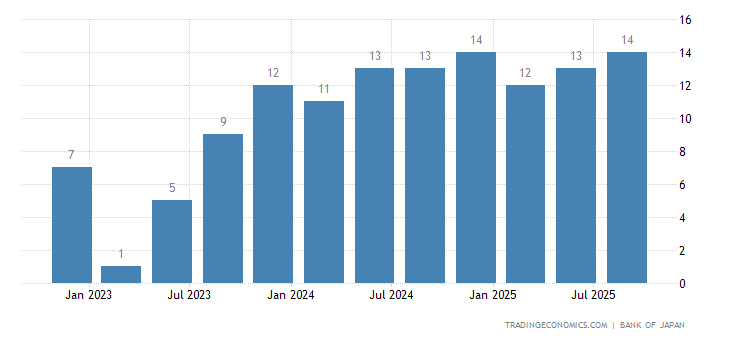
Sentiments of major producers of Japan (quarterly survey of CB “Tankan”) are gloomy for the year –
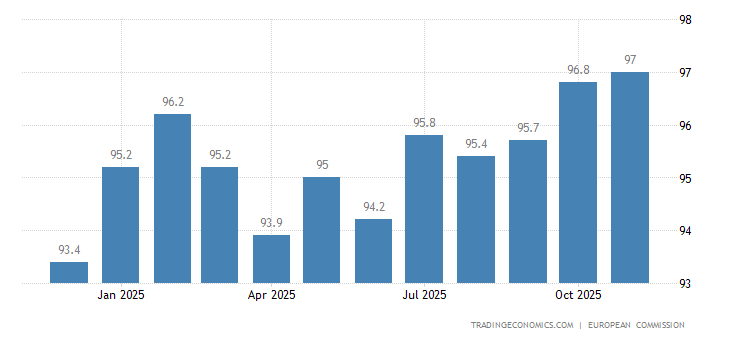
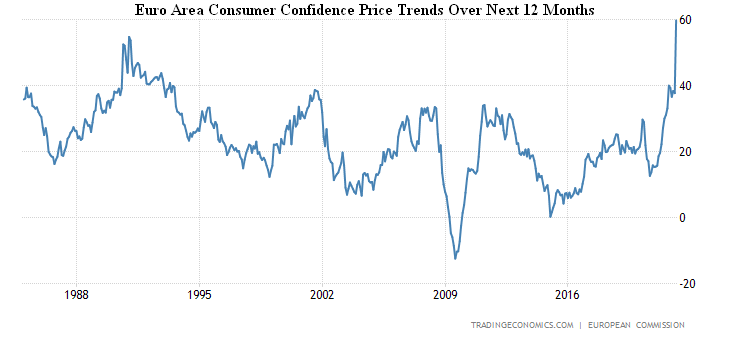
Economic sentiment in the Euro Area is the worst in a year –
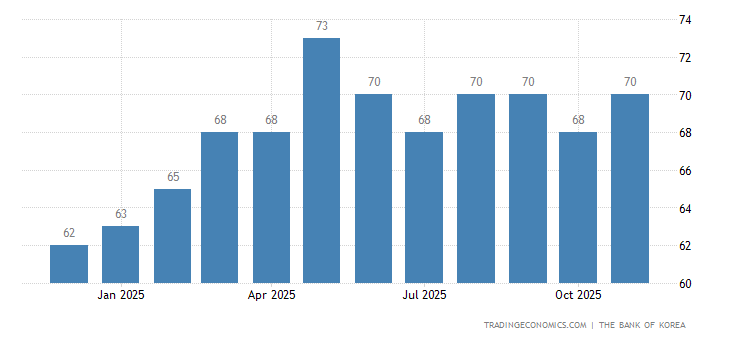
As is business confidence in South Korea:
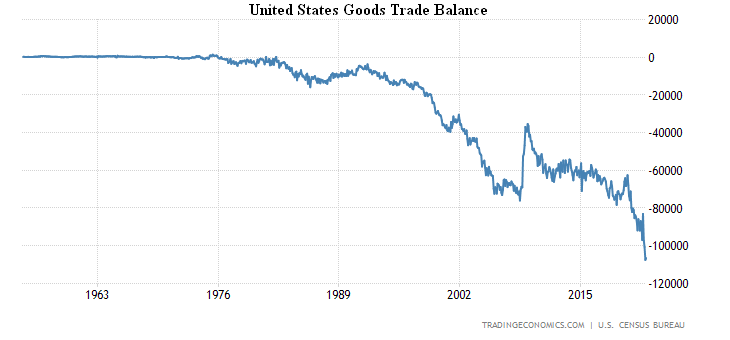
U.S. trade balance shrinks slightly but remains close to record high –
US mortgage applications are still -6.8% per week:

Moreover, the mortgage refinancing index is already at a 3-year trough and close to record lows –
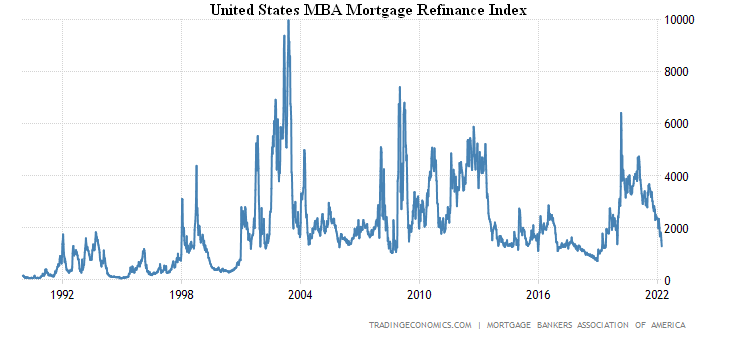
The reason was the mortgage rate of +4.8%б the peak since 2018, +0.3% per week (11-year high) and 1.5% per year (28-year high):
Then comes the price data, the usual records one by one.
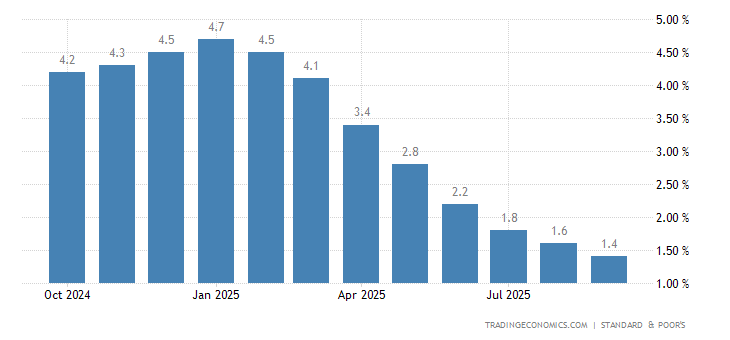
US house prices (S&P CoreLogic Case-Shiller survey) started picking up again (+19.1% y/y, 5-month high) –
The same picture is shown by the authorities (FHFA), according to their version +18.2% per year –
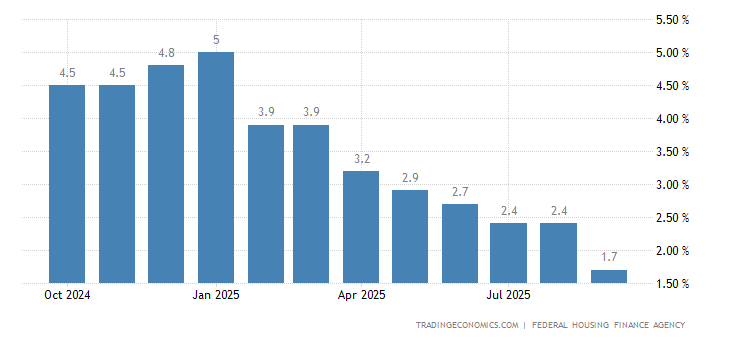
The monthly increases (+1.4% and +1.6% respectively) are also noticeably faster:
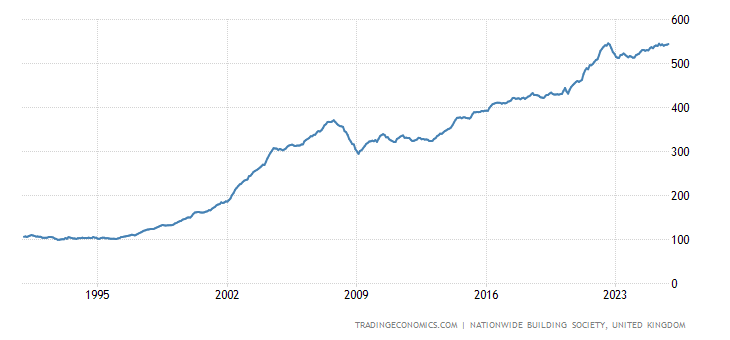
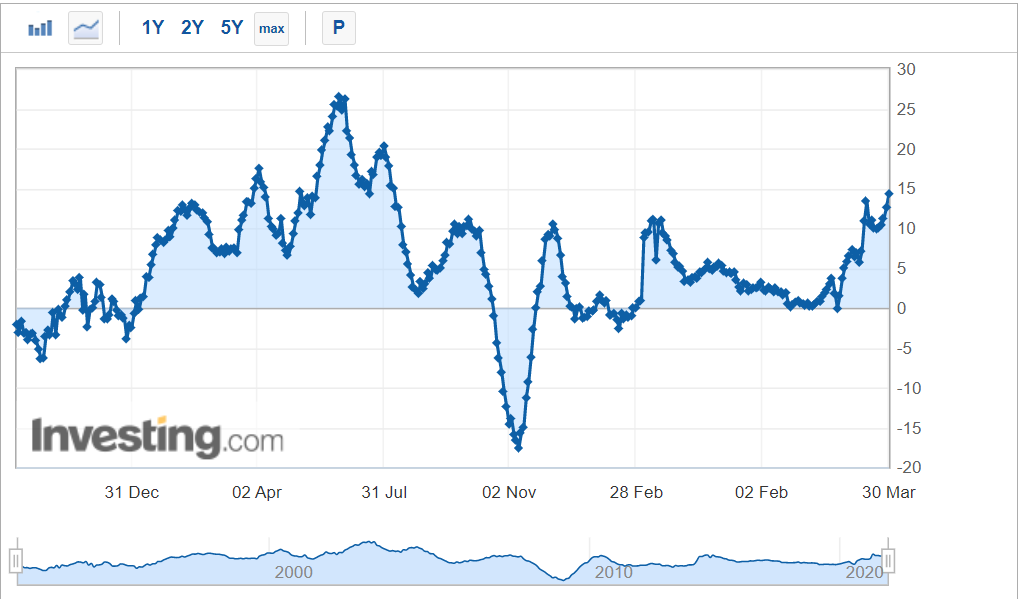
House prices in Britain +14.3% per year, at their highest since 2004:
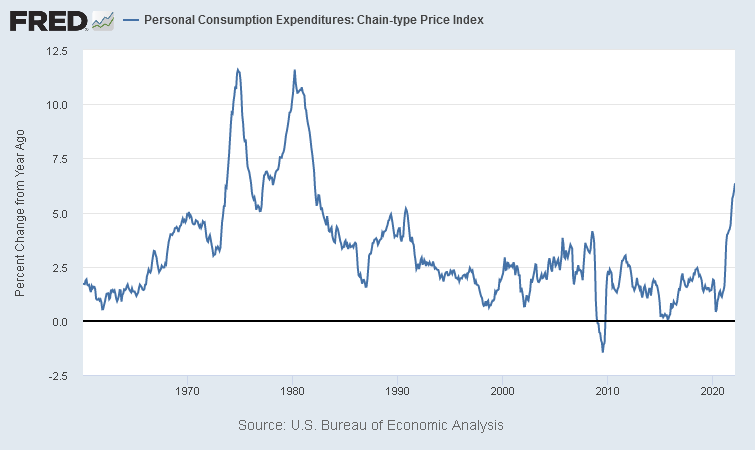
Personal consumer expenditures (PCE) in the US +6.4% per year, the highest since 1982:
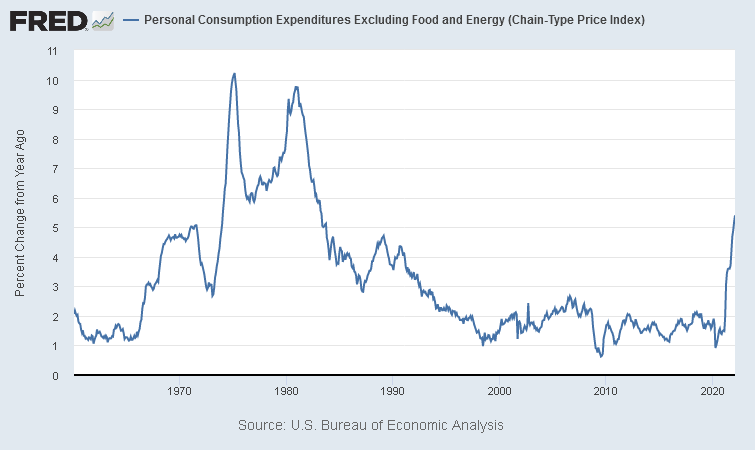
Less food and energy +5.4% per year, the highest since 1983:
CPI (Consumer Price Index) of Spain +3.0% per month, which was the peak since the late 1970s:

And +9.8% per year, the highest since 1985:

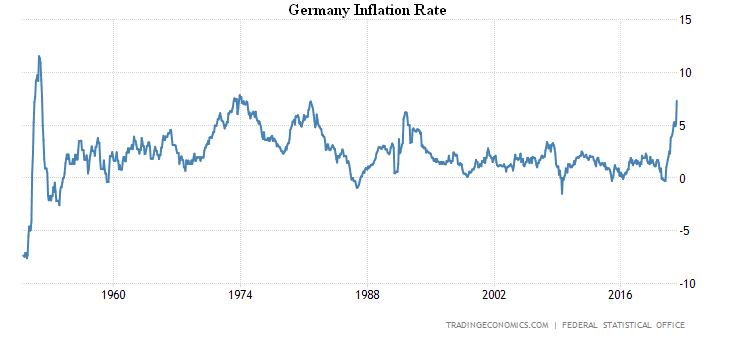
The same situation in Germany: +2.5% per month, only 0.2% below the record peak of 1951 –
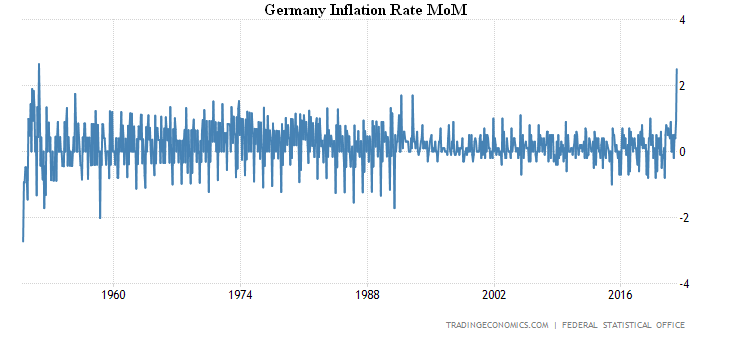
And +7.3%, the peak since 1974. Go up another 0.6%, and there will be a maximum since 1951:
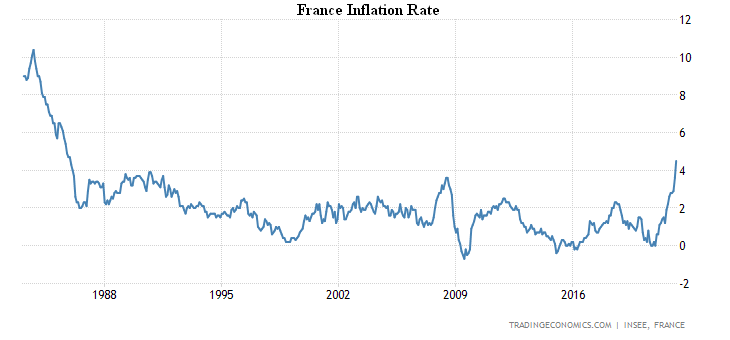
French CPI +1.4% per month, record for 32 years of statistics:
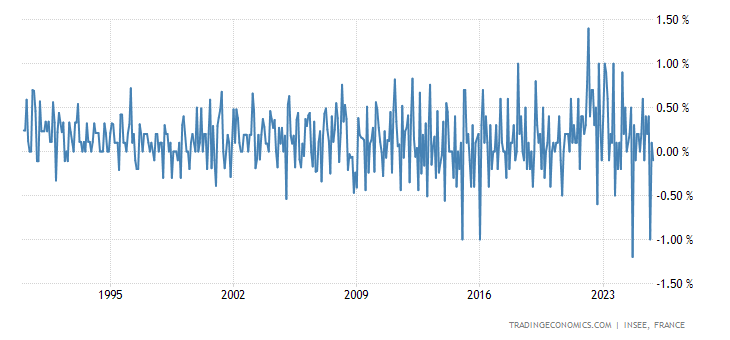
And +4.5 per annum, the highest since 1985:
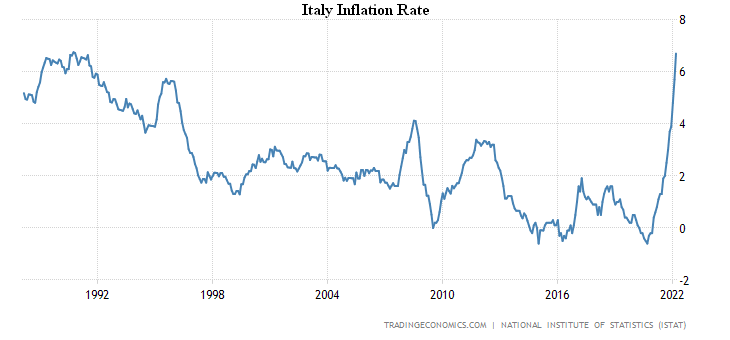
Italian CPI +6.7% per year, this is the peak since 1990:
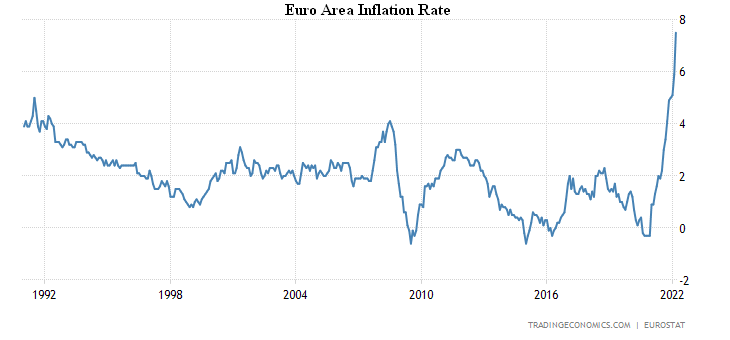
The Euro Area CPI +2.5% per month, which is the record for 32 years of survey:
And +7.5% per year, which is also a record, and higher-than-expected by as much as 1%:
Core inflation rate (less food, alcohol, tobacco and energy) also set a record (+3.0% per year):
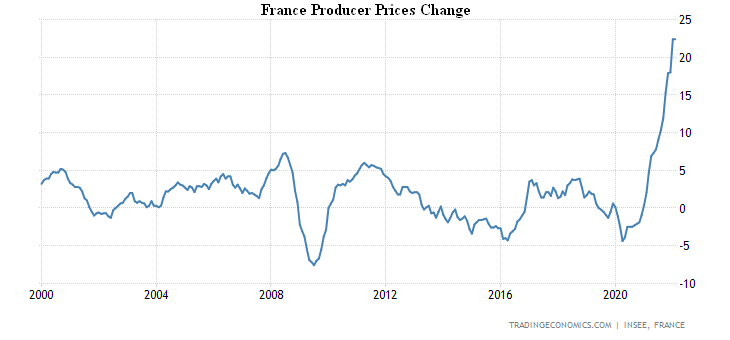
PPI (Producer Price Index) of France +22.4% per year, a record for 22 years of observation:
German consumer climate at its weakest in 14 months, expected household incomes are at a record low –
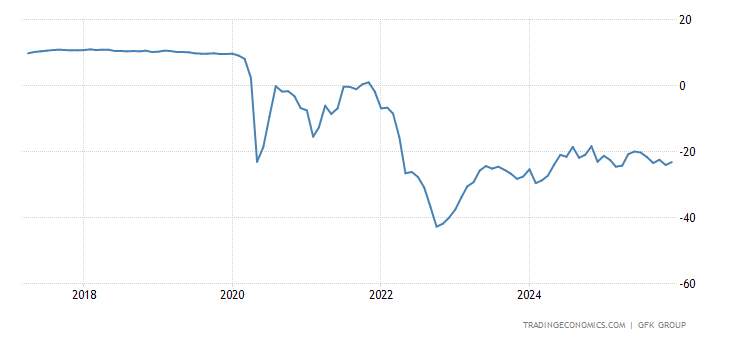
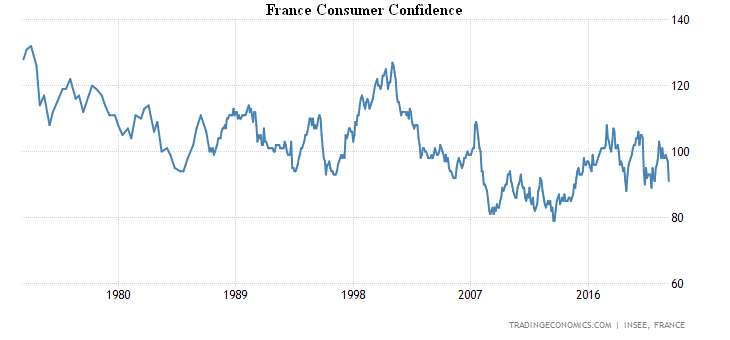
A similar picture is seen in France –
The Euro Area as a whole is on the trough for almost two years:
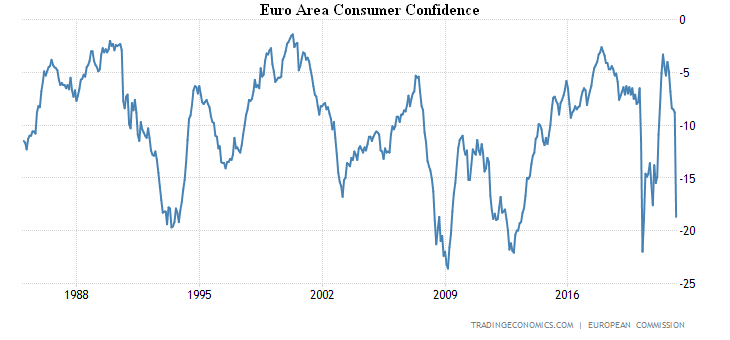
And inflation expectations there are the highest in 37 years of survey:
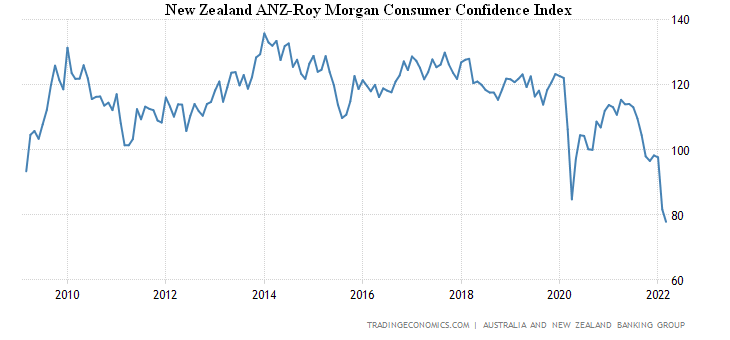
New Zealand consumer confidence is the weakest in 13 years of statistics –
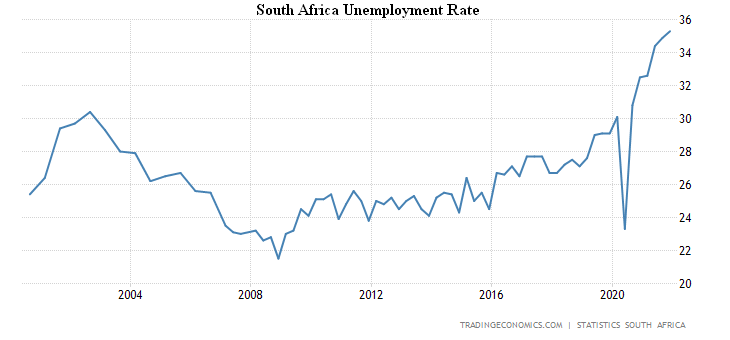
Unemployment rate in South Africa is at a record high (35.3%) –
Retail sales in Japan -0.8% m/m, 3rd consecutive negative:
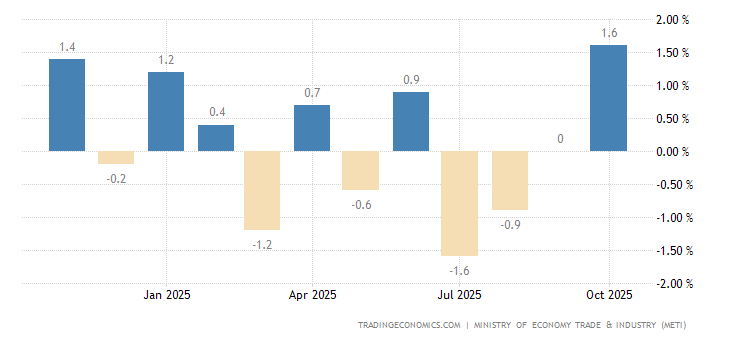
As a result, the annual performance also went into the red (by the same 0.8%) –

Summary. The picture is very similar to what happened in the United States in 1930-32. – steady decline (about 8-10% of GDP per year), which is in some ways a typical structural decline. It was just under three years, and now it’s likely to be five years. At the time, the crisis was in the deflationary scenario, but now it is in the inflationary scenario, because industrial inflation of 20 per cent, with incomes growing at about 8-10 per cent, means that GDP is down about 10 per cent per year. We promised to provide regular analysis of US labor statistics. This time, contradictions are revealed again.
On the one hand, the situation is rather optimistic: U-6 unemployment rate in March was 6.9% against 7.2% in February; population participation rate in the total labour force in March was 62.4% against 62.3% in February; average hourly wage in March was 0.4% m/m and 5.6% y/y (a little higher I optimistically assumed growth of 10% per year), in February it was +0.0% m/m and +5.1% y/y.
On the other hand, the average working week in March was 34.6 hours and in February it was 34.7 hours. I don’t think I’m going to reveal the big secret that with real economic growth, it initially increases working hours, and then it reduces unemployment. This is almost always the case. This means that labour statistics are, with a high degree of certainty, quite abstract, so that it is at least incorrect to consider them as reasons for optimism.
In general, it can be concluded that a typical week, without abrupt events and emergencies, has been very, very rich in various negative tendencies, while the positive hardly observed. And this situation has to be seen as some new reality: if nothing happens, there is a rather rapid decline. Of course, it is possible to colour GDP figures, including by underestimating real inflation rates (most likely in the consumer sector, since it is private consumption that makes up most of GDP). But it won’t change the nature of what’s going on.
We wish all readers of our Reviews a productive work week!