
Time period: 22-28 May 2021
Top news story. The inflationary wave continues to gain momentum. At the same time, as we have stressed on many occasions, official statistics have become increasingly unreliable, as they significantly embellish reality. In particular, official US statistics distort the reality with respect to consumer inflation (the CPI index), as it does not take into account the value of real estate. But if we consider it, the picture is this:

Joseph Carson, former Chief Economist of Deutsche Bank for the United States, concludes:
Joseph Carson, former Chief Economist of Deutsche Bank for the United States, concludes:
“In April, the median price of dwellings in the US secondary market rose by 20.3% y/y, which is not only a record figure but also markedly higher than the peak of 17.4% y/y in the 1970s. More importantly, price increases in the secondary housing market are ten times higher than the 2% y/y figure taken into account for the CPI as a non-market estimate of rent increases. The weight of the rental equivalence index is almost one quarter of the total consumer price index and one third of the same base index. If instead of the above 2% enter current data on house price dynamics, in April the real CPI in the USA grew by about 9.2% y/y (instead of the official 4.2% y/y) and the base CPI by 8% y/y (instead of the official 3% y/y). These are record figures since 1978-1982.” (https://www.profinance.ru/news/2021/05/25/c29n-realnaya-inflyatsiya-v-ssha-priblizhaetsya-k-pikovym-znacheniyam-kontsa-1970-kh-.html)
Macroeconomics
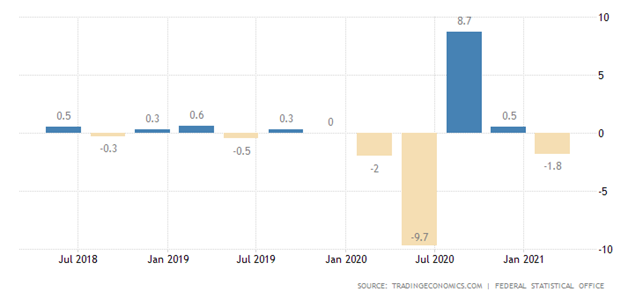
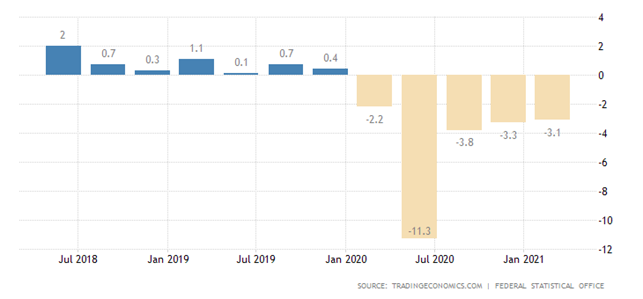
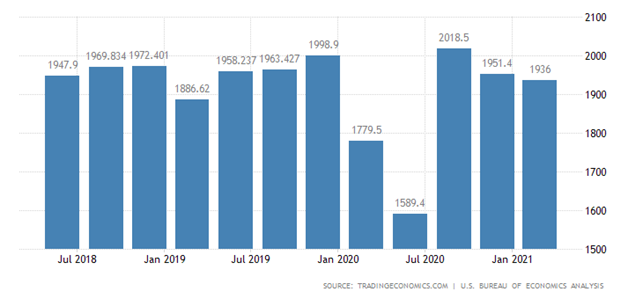
GDP of Germany -1.8% per quarter and -3.1% per year; -5.0% of the peak of late 2018:
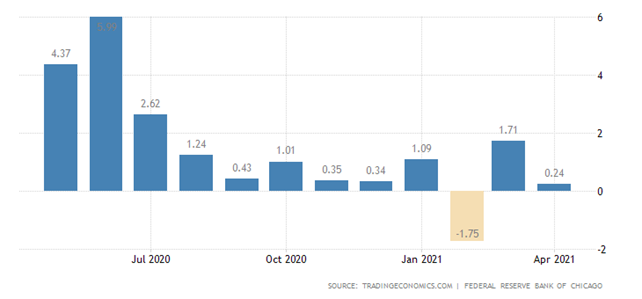
The Chicago Fed National Activity Index deteriorated significantly in April:
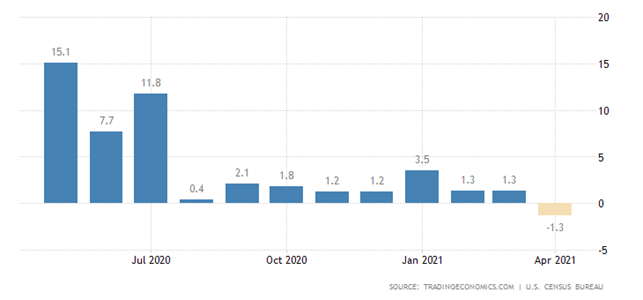
Orders for durable goods in the United States declined unexpectedly by 1.3% per month in April:
So did corporate profits in the first quarter:
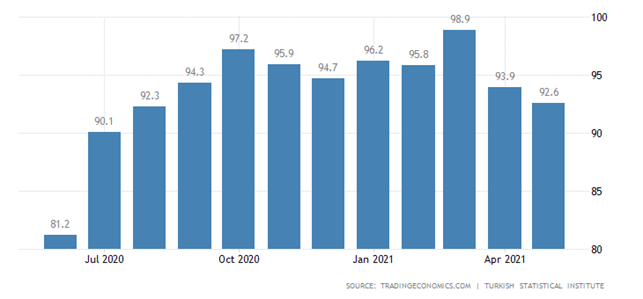
Turkey’s Economic Confidence Index is the worst in 9 months:
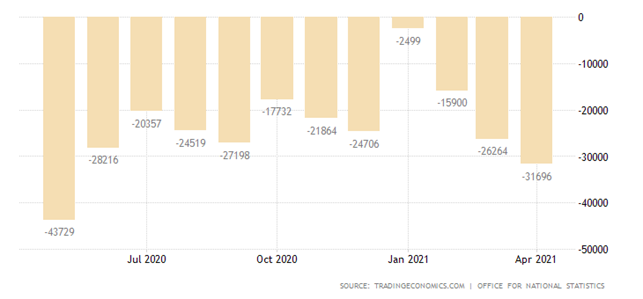
Public sector net borrowing for the last financial year is a record one since 1946 (-14.3% of GDP):
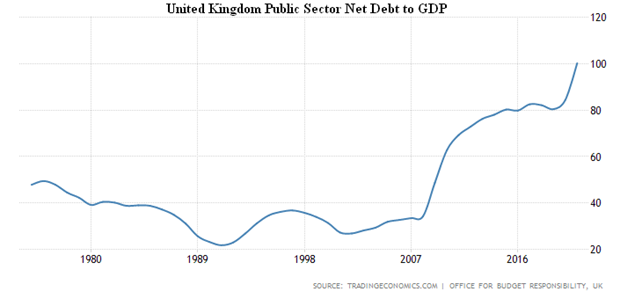
Why the national debt reached 100% of GDP, the worst since 1962:
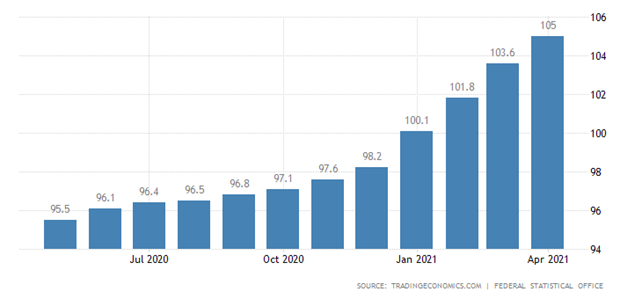
Import prices in Germany in April + 10.3% per year – the highest since 2010:
PPI (Producer Price Index) of Spain + 12.8% per year – a record since 1984:
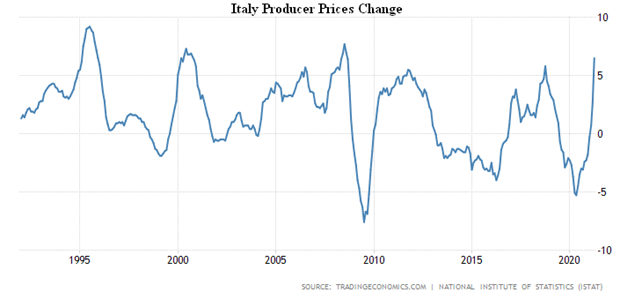
Italian PPI + 6.5% per year – peak since 2008:
South African PPI + 6.7% per year – the highest since 2018.
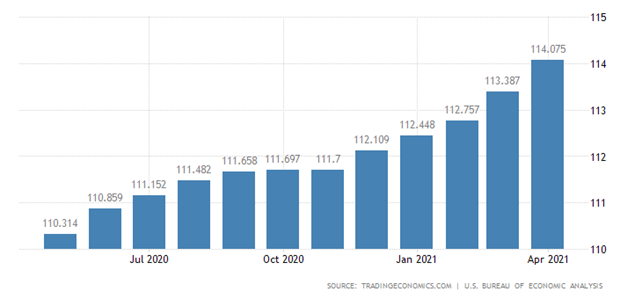
United States Personal Consumption Expenditure Price Index (PCE) in the US + 3.6% per year –the highest since 2008. And what in reality, see in the first section.
But the Fed uses a different measure (the so-called “core”, which does not take into account “high volatility” of food and fuel costs), which rose by 3.1% per year – the most since 1992:
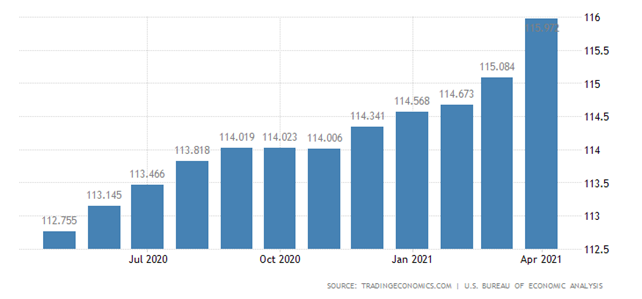
Housing prices in the United States in March, according to official figures, 1.4% per month and 13.9% per year are historic records:
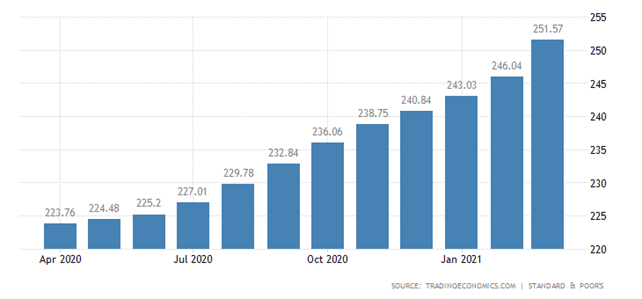
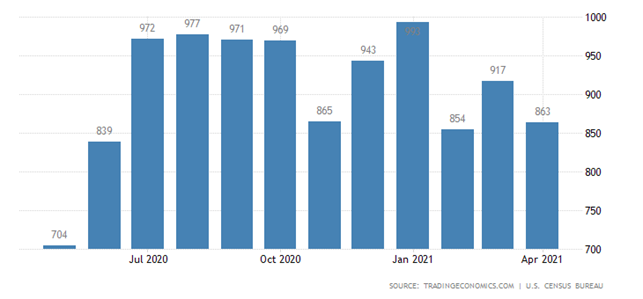
Even more expensive are the new buildings (+20.1% per year), and their sales in April fell by 5.9% per month:
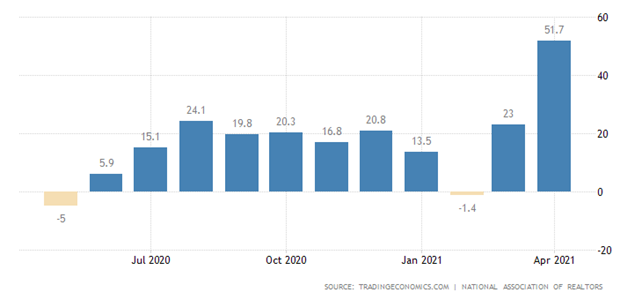
Unfinished secondary housing sales fell by 4.4% per month:
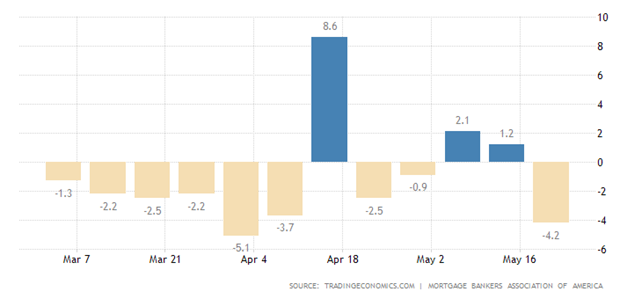
For the same reason, mortgage applications are declining:
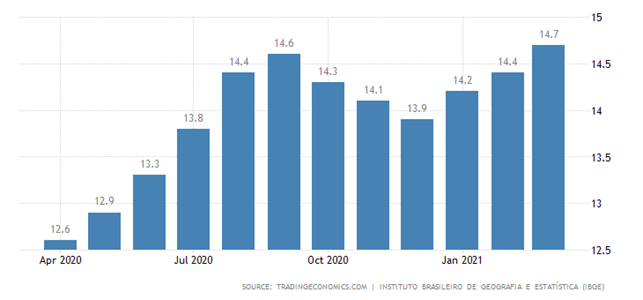
Unemployment in Mexico peaked at 7 months (4.7%) and in Brazil at a record 14.7%:
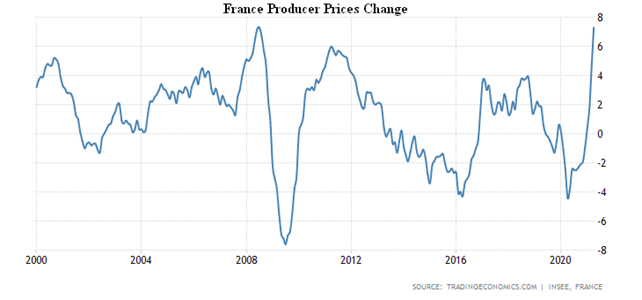
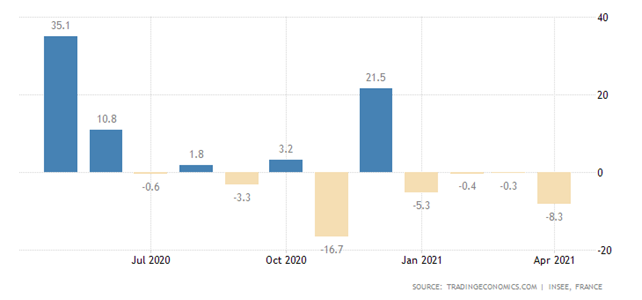
Consumption of French households in April -8.3% per month – 4th consecutive minus and -9.5% of the peak level of late 2019:
The Central Bank of Indonesia left the monetary policy unchanged, as did the Central Bank of South Korea.
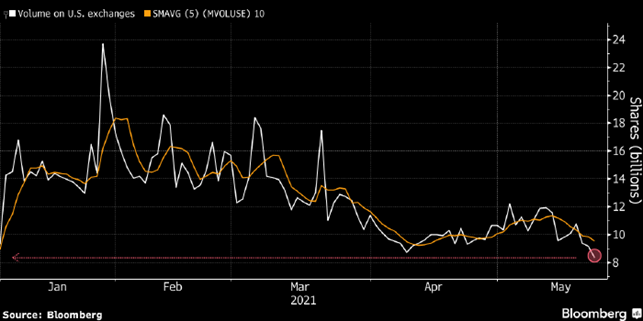
Summary. As stated in the first section, the inflation wave is getting stronger. And, judging by the rise in industrial inflation, the situation for consumers will be seriously worsening by the fall, which means a drop in GDP and a deterioration in living standards. As inflation rises beyond all reasonable limits, the overall stability of the dollar’s financial system is beginning to decline significantly. In the absence of similar experiences – in the 1970s and the 1930s, the economic model was very different – it is difficult to quantify this, but we can show these changes in graphs.
In particular, the volume of trading in the US stock market has fallen record-high. This suggests that buyers’ confidence is falling, which increases the likelihood of market failure.
There is a strange correlation between stocks and bonds in the US:
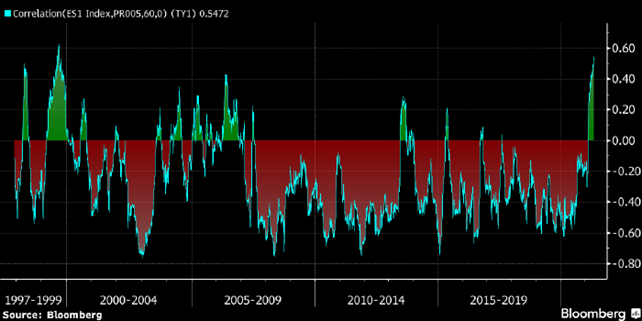
The point is, it’s negative: when capital goes into stocks, it comes out of bonds. And now the rate is 0.55, which has not been the case since 1999 (the pre-crisis Spring 2000).
We wish all readers a happy weekend and congratulations on the summer beginning!