
Time period. April 9-15, 2022
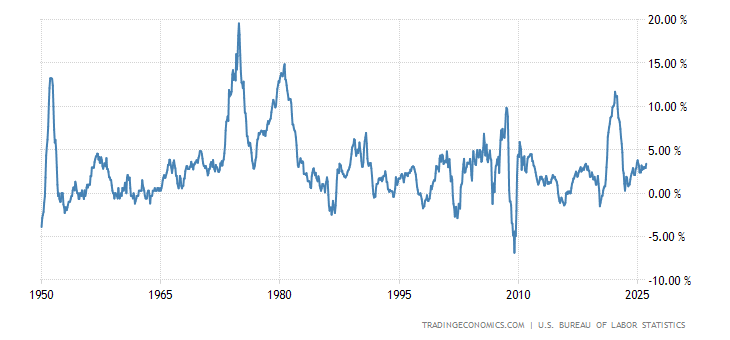
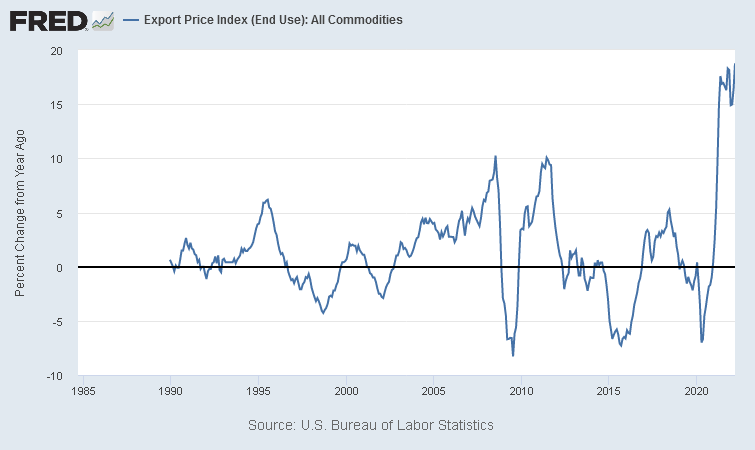
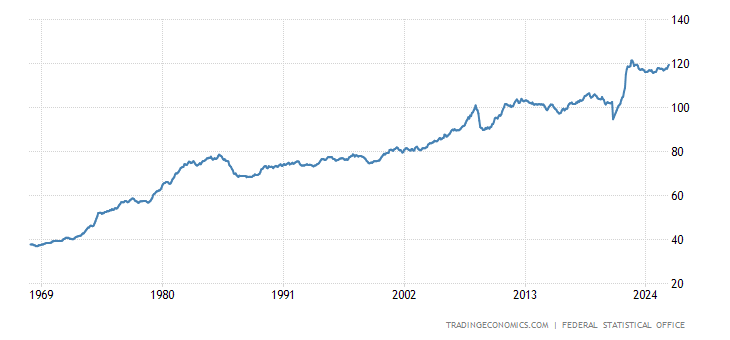
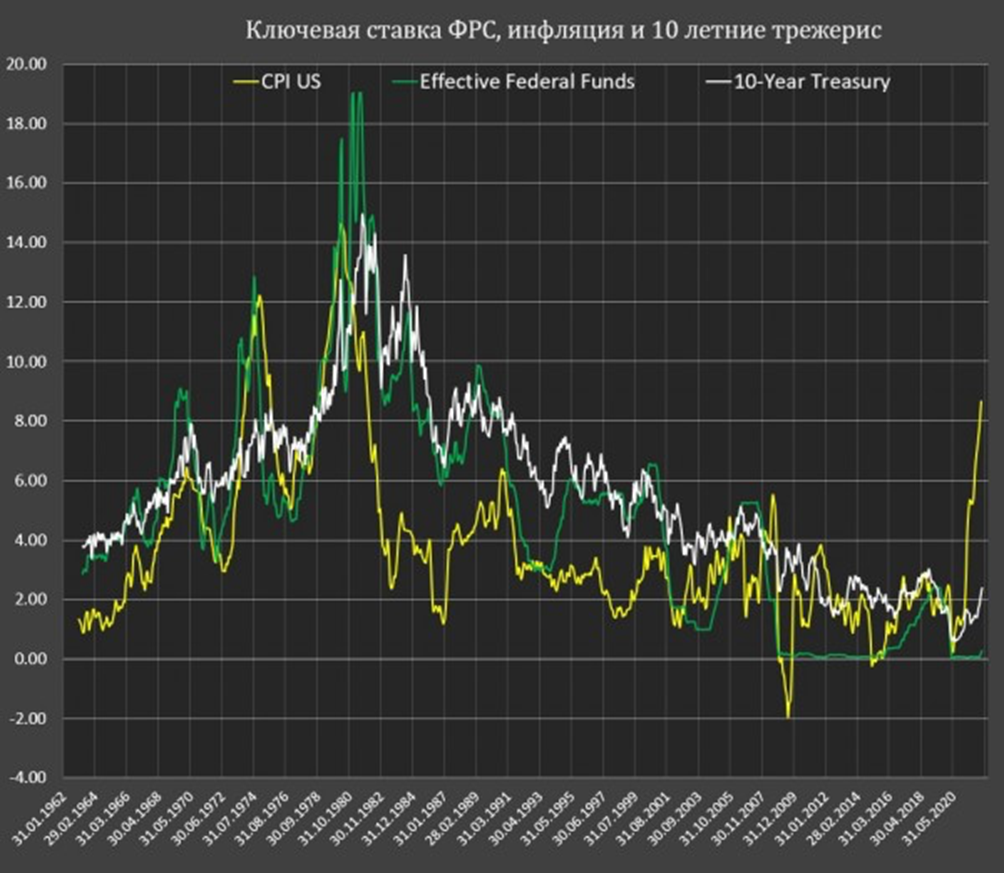
Top news story. The headline news, which was even pointed out by of White House Press Secretary Jennifer Psaki in Washington, D.C., is a huge rise in US inflation. In fact, inflation is rising everywhere (cf. the next section of the Review), but it is the dollar that causes the most interest for quite understandable reasons. There are two main problems with this. The first is that it destroys the ability to plan production over the long term, more precisely, the risks of possible price increases have to be embedded in any economic activity, which only makes the inflationary processes faster. But there is a second problem, no less important. In order for it to be clarified, it should be recalled that all talk of a fall in US household incomes in the 2000s was countered by a logical arguments about the huge assets they have stored up over many decades. Note that this is also true for corporations. But inflation of 20% means that every year these assets fall by one fifth in value. You ask, where is 20%? Here they are:
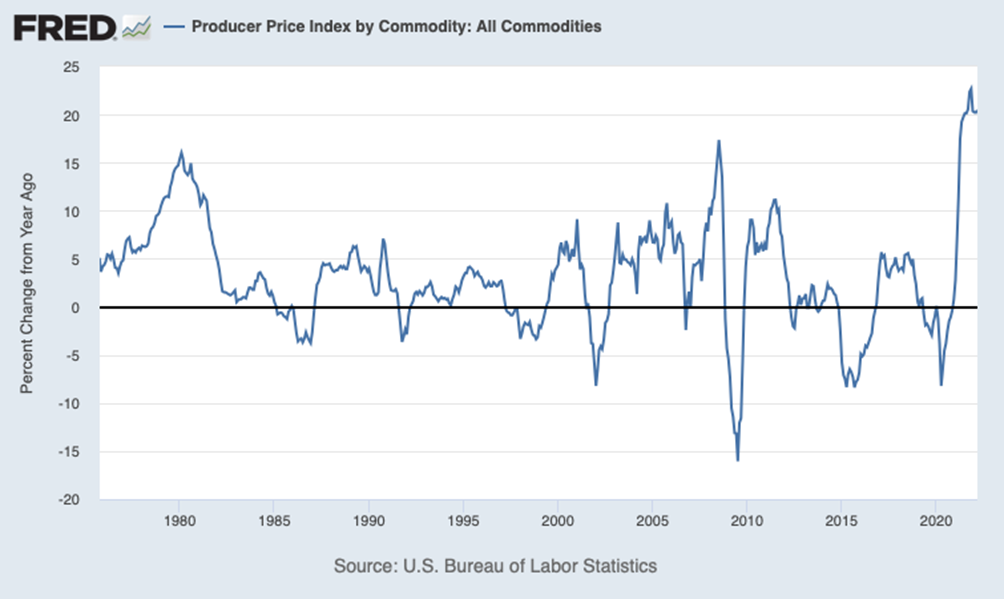
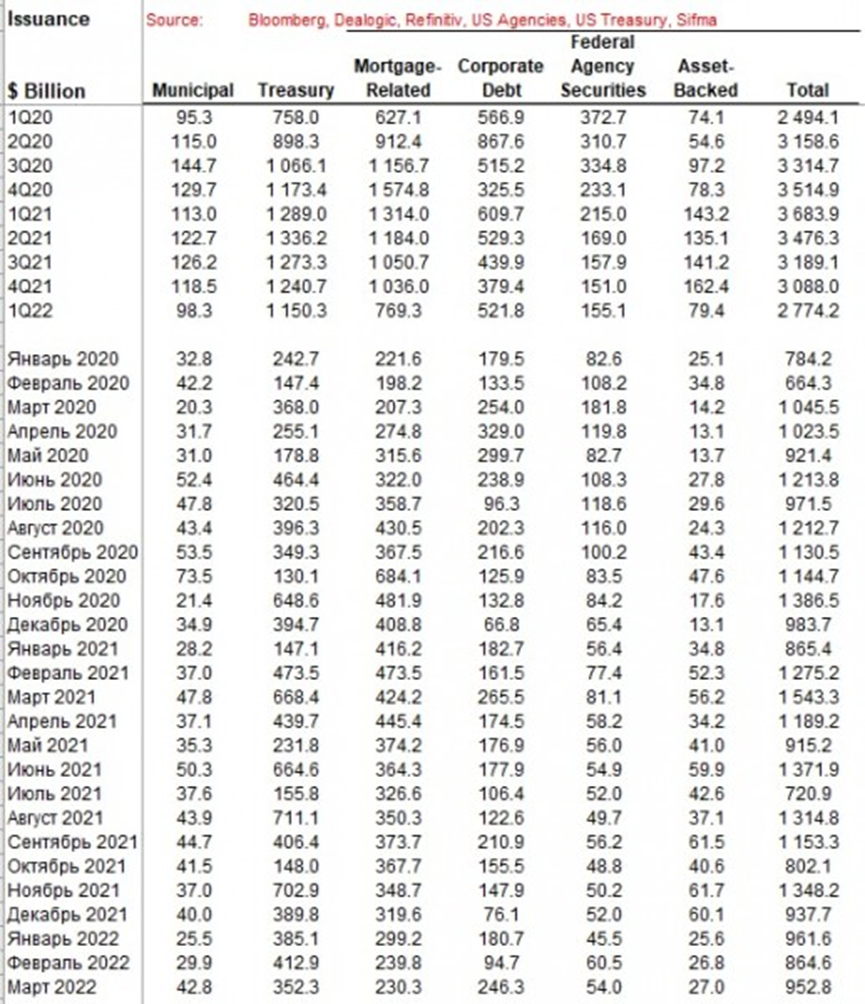
This chart shows the price increases for all commodities sold, including intermediate goods. The narrower inflation figures are given below. It is impossible to refer to intermediate capitalization, since it is obvious to everyone that a terrible bubble has formed there that either bursts or is depreciated by a sharp rise in inflation. And the real income from assets just depreciate. And the question arises whether it is possible to keep their assets and/or savings (if they are sold at the peak of prices). And here is a very interesting table form by Pavel Ryabov:
January 2020
February 2020
March 2020
April 2020
May 2020
June 2020
July 2020
August 2020
September 2020
October 2020
November 2020
December 2020
January 2021
February 2021
March 2021
April 2021
May 2021
June 2021
July 2021
August 2021
September 2021
October 2021
November 2021
December 2021
January 2022
February 2022
March 2022
The table shows the gross position value of all types of securities traded through the American financial system. The base year for comparison is 2021, given the increased needs for refinancing.
Values and structure of positions and repayments of treasuries (bills — up to a year, notes — from two to 10 years including TIPS, bonds — 20-30 year stocks).
The US debt market is showing all signs of weakening demand — the position values of securities is radically declining in the first quarter of 2022. Municipal -13% YOY, Treasury -11%, MBS -42%, Corporate -14%, Federal Agency -28%, Mortgages -45%, and All Bonds -25% Q1 2022.
The reasons for this are clear: who would need assets with returns of no more than 3-4%, with double-digit price increases? If inflation began to decline, it would still make sense, but the US monetary authorities were clearly late in raising the rate (it should have been done at least a year and a half ago). Moreover, the adverse effects of this action, the increase in the cost of debt servicing and the intensification of the degradation of structural changes are likely to negate the positive effects significantly. The trouble is that today the rate hike, recently announced by the US Federal Reserve, will not lead to any positive result at all, and the negative ones will not go away.
Macroeconomics
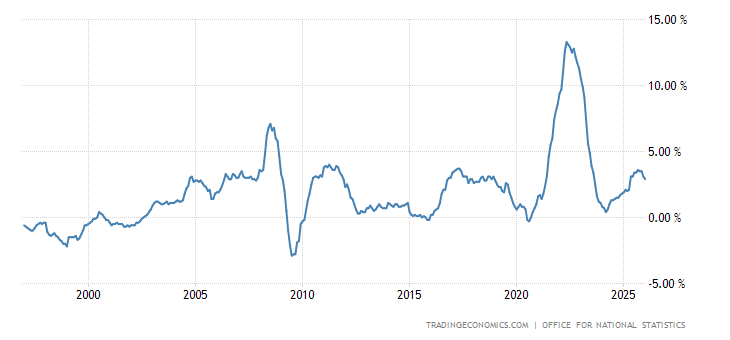
Britain’s GDP growth in February slowed down more than expected (+0.1% per month instead of +0.3%):
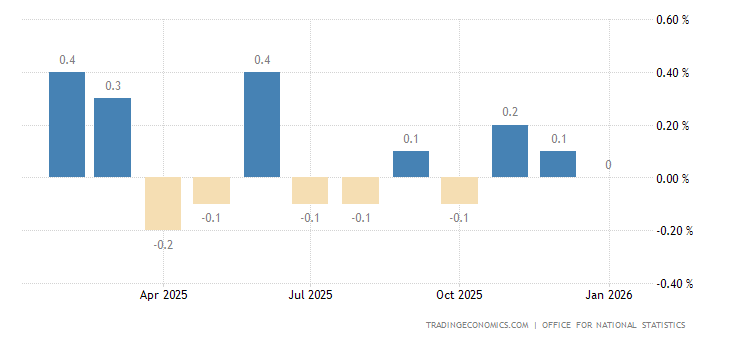
Note that this growth is against the backdrop of downplaying of inflation, and if we calculate it honestly, most likely, the economy is already in downturn, not recession!
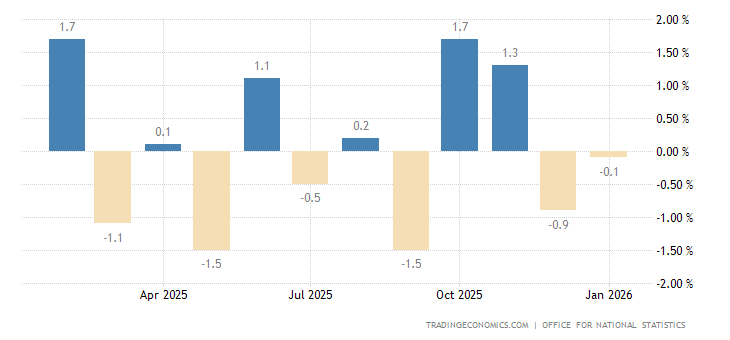
Industrial production in Britain -0.6% per month instead of the expected +0.3%:
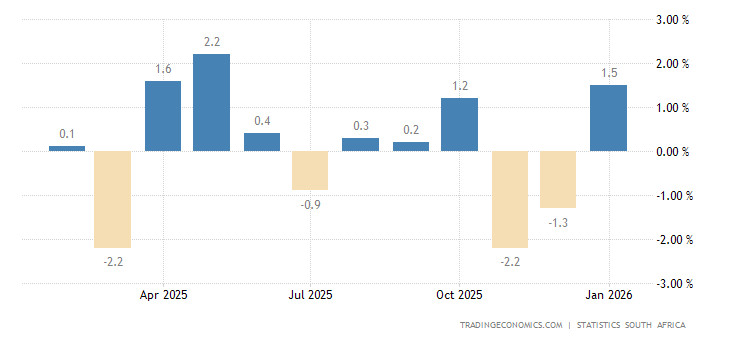
South African manufacturing output is -1.1% per month:
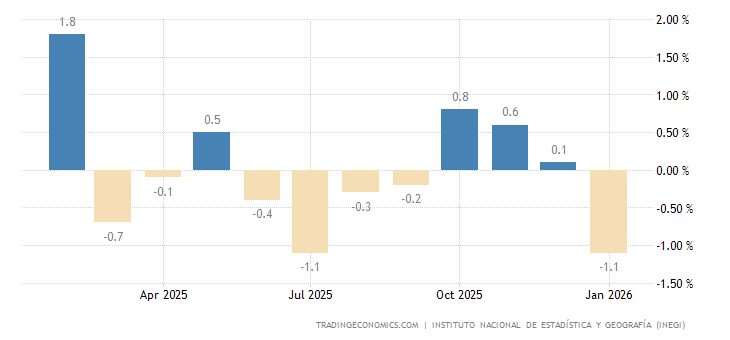
Industrial production in Mexico is -1.0% per month:
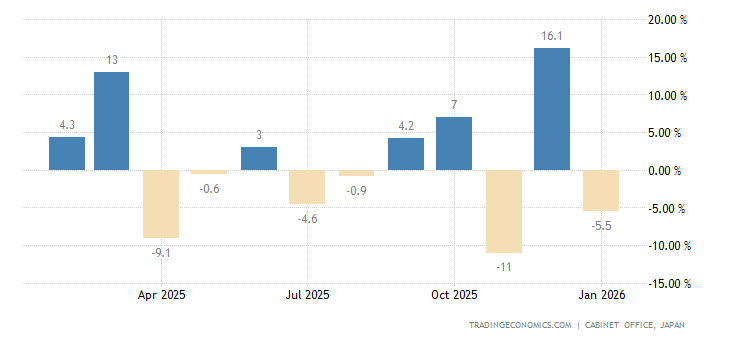
Machinery orders in Japan -9.8% per month, 2nd consecutive negative and the worst performance in 2 years:
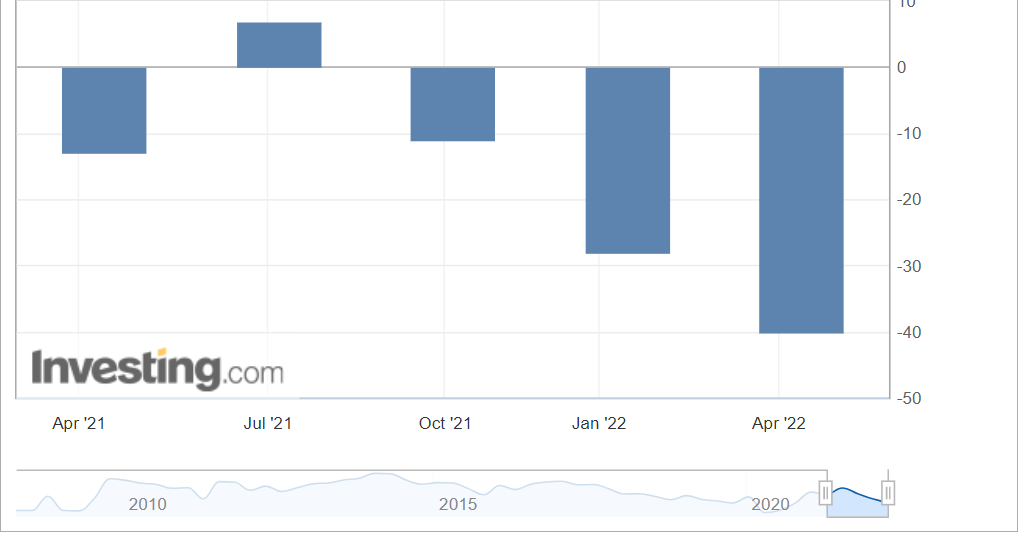
Germany ZEW Economic Sentiment Index is about a 10-year low set in March 2020:
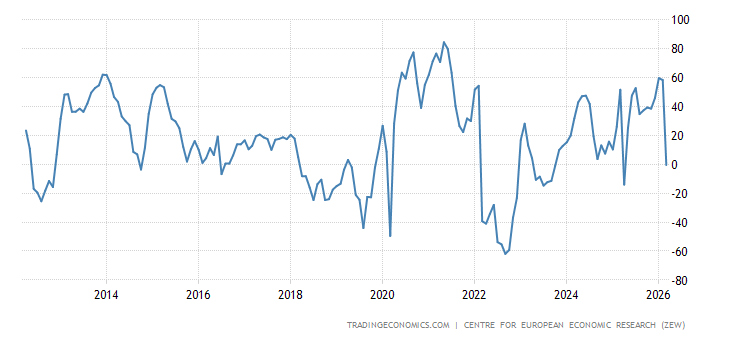
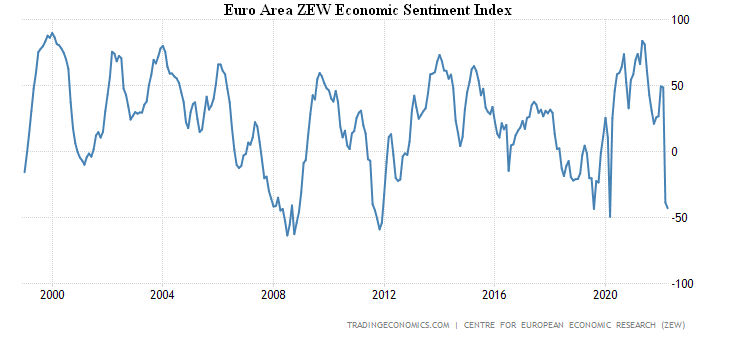
The same is true for the Euro Area as a whole:
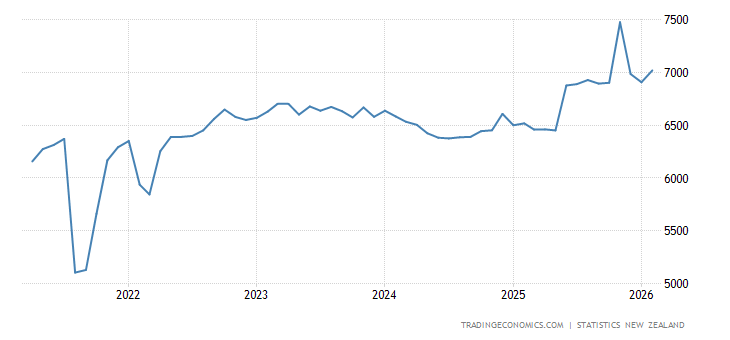
Business confidence in New Zealand at its lowest in 7 months:
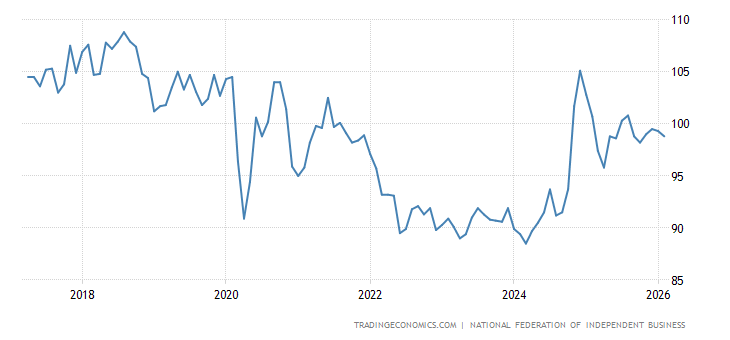
Small business optimism in the US is the worst in two years, with the largest share of businesses fearing inflation since 1981:
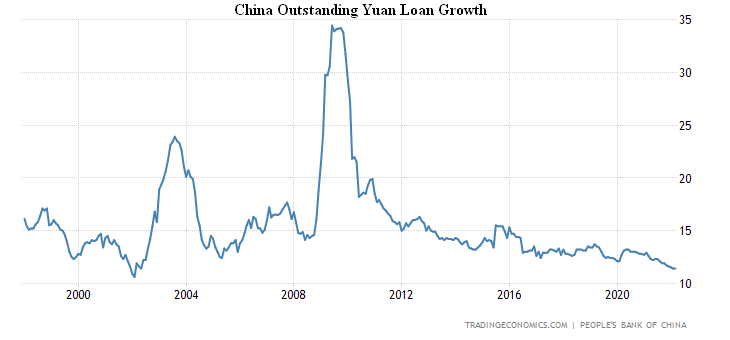
Outstanding yuan loan growth in China was +11.4% per year and reached a 20-year low:
Mortgage applications in the US were -1.3% w/w, the 5th negative in a row:
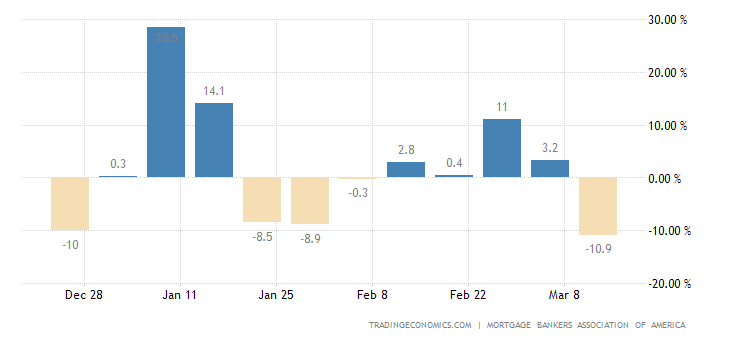
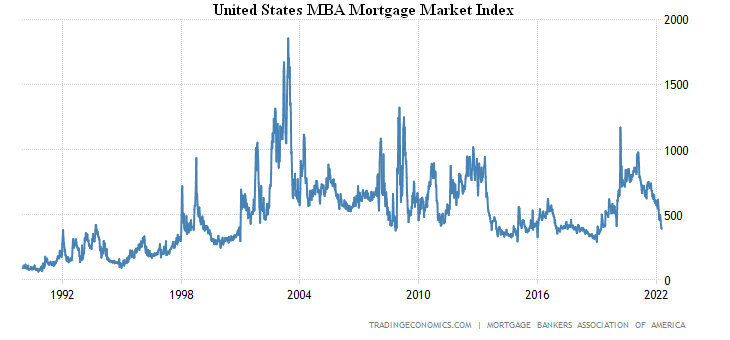
Untied States MBA Mortgage Market Index dropped to 3-year low:
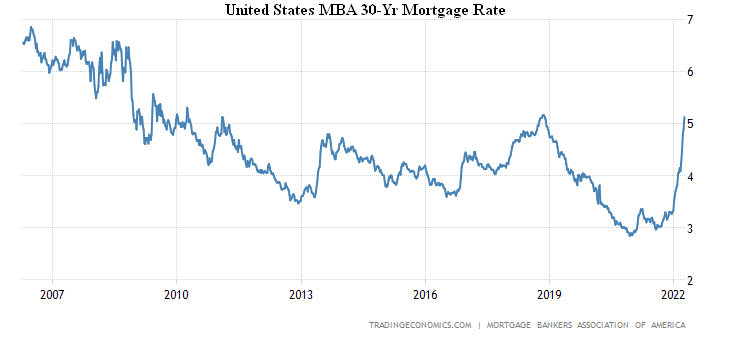
The mortgage rate has come close to the peak of 2018, followed by the values of 2010:
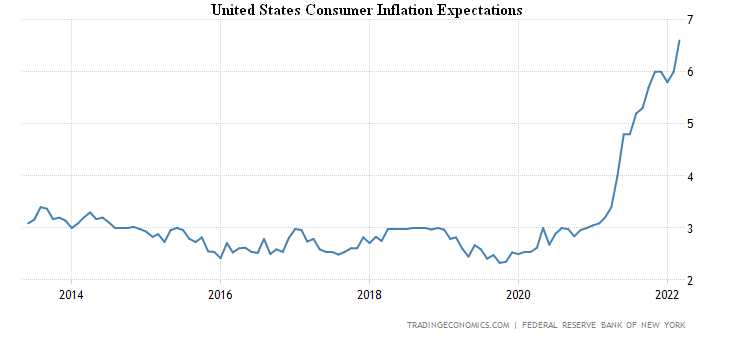
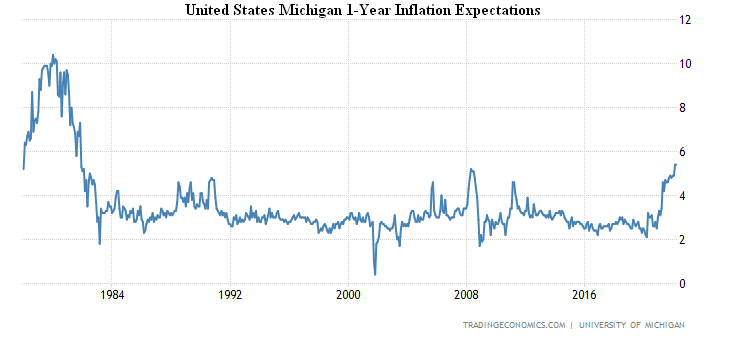
According to the New York Federal Reserve Bank, inflation expectations in the US were +6.6% per year and reached a record high:
And according to the University of Michigan, +5.4% per year, the highest since 1981:
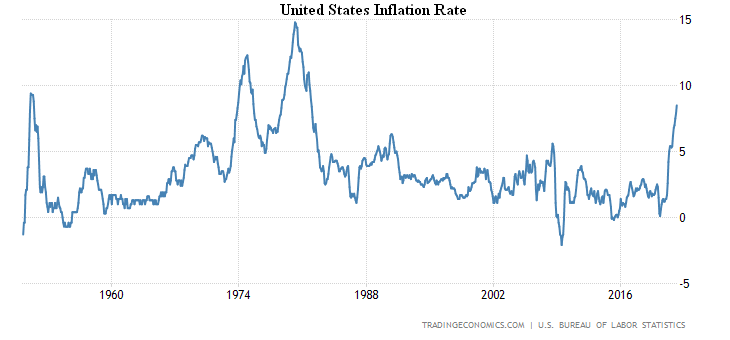
Inflationary indicators routinely break a variety of records.
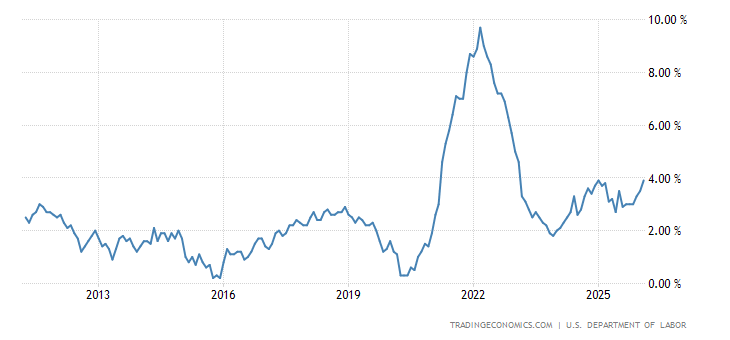
CPI (Consumer Price Index) USA +8.5% per year, peak since the end of 1981:
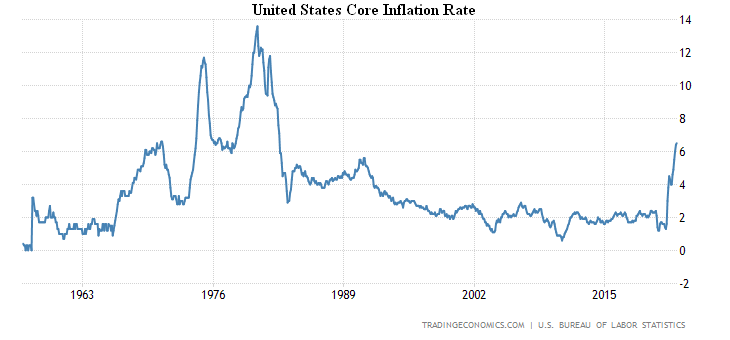
Core inflation rate (excluding food and fuel) is +6.5% per year, has climbed to the top since 1982:
The US PPI (Producer Price Index) is +1.4% monthly, a record surge in 13 years of survey:
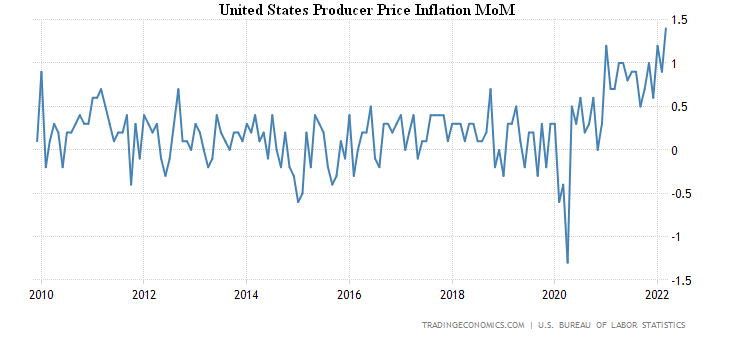
And +11.2% per year, this is a 40-year peak:
Excluding food and energy, this is a record +9.2% per year:
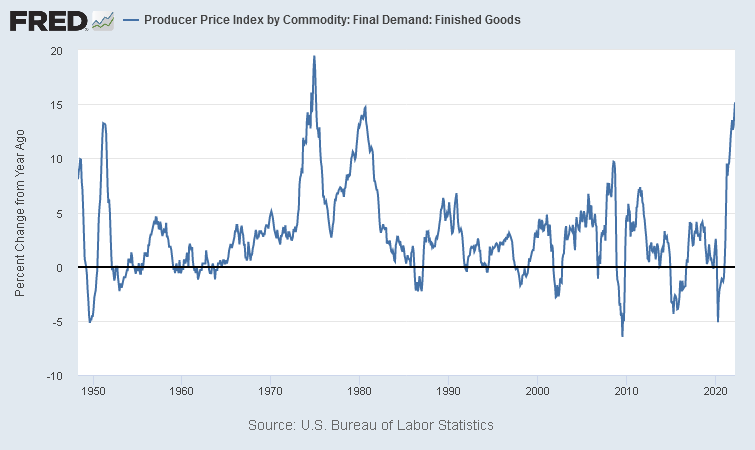
On finished goods, +15.2% per year, broke the peak of 1980, already at most since 1975:
US export prices reached +4.5% m/m, 33-year record:
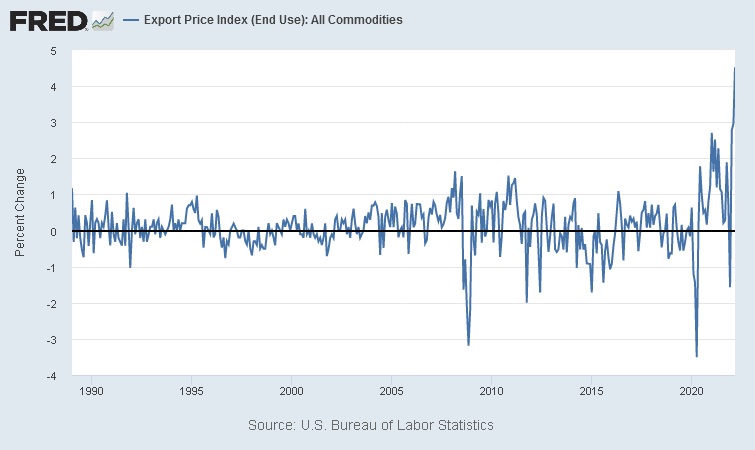
Their annual growth (+18.8%) is also a record one:
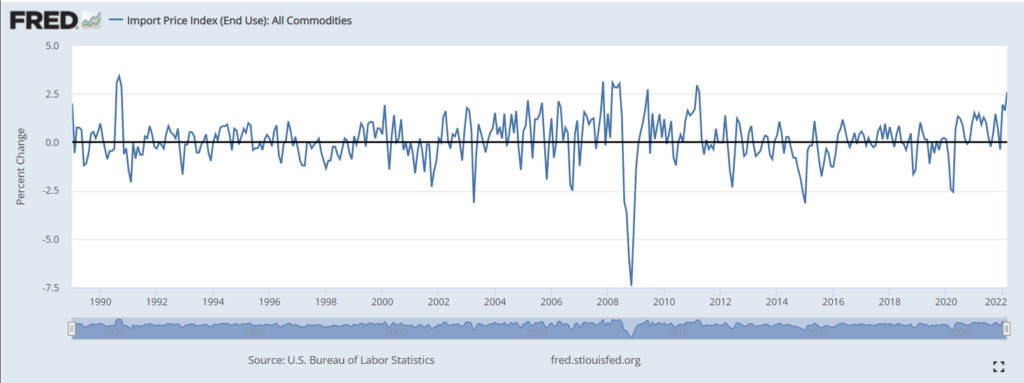
At import prices there is +2.6% per month, 11-year high:
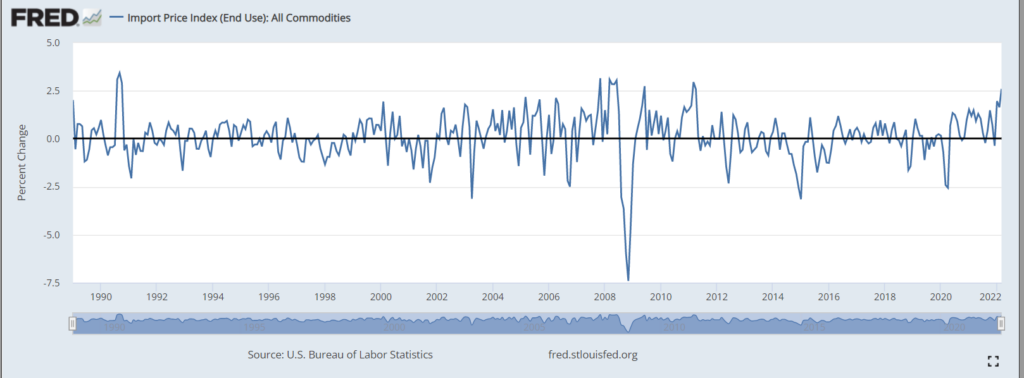
Their annual growth (+12.5%) is the highest since 2011:
And by the way, recall that in the early 80s the US discount rate was under 20%, not less than 1, as it is now!
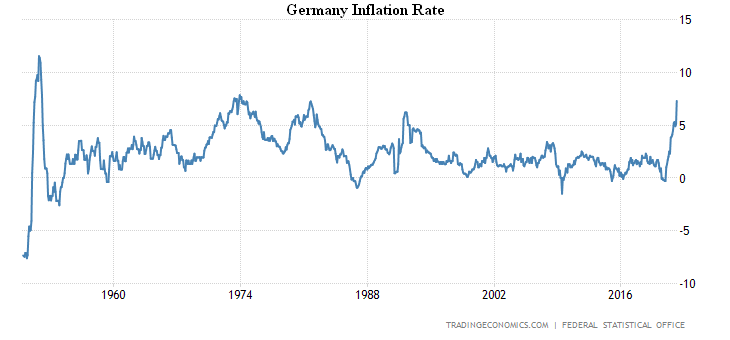
CPI Germany +7.3% per year, it is the highest since 1981:
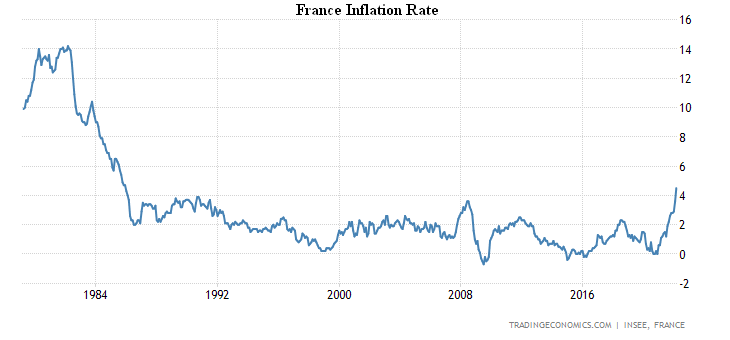
The French CPI is 4.5% per year, at its peak since 1985:
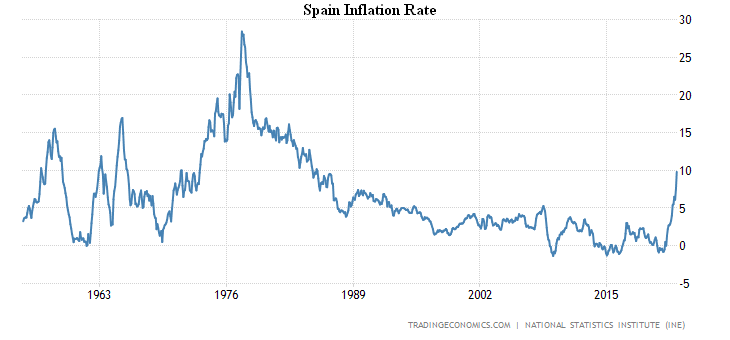
Spanish CPI +9.8% per year, peak since 1985:
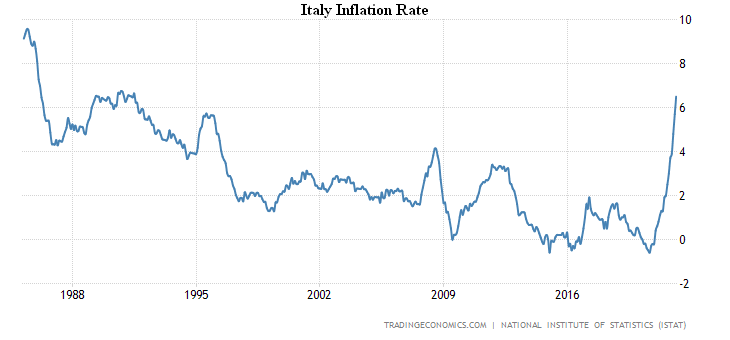
Italy’s CPI is 6.5% per year, the highest since 1991:
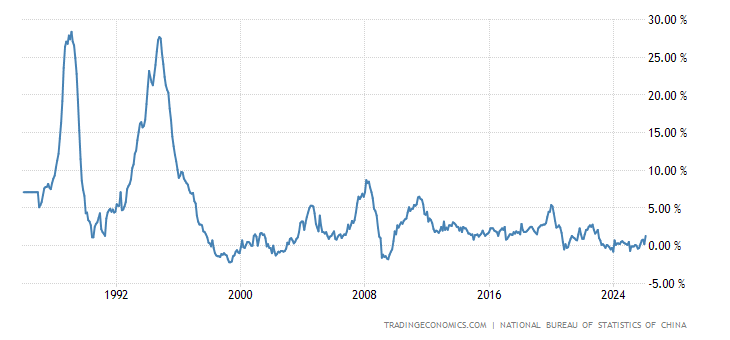
China’s CPI picks up again (+1.5% y/y after +0.9%):
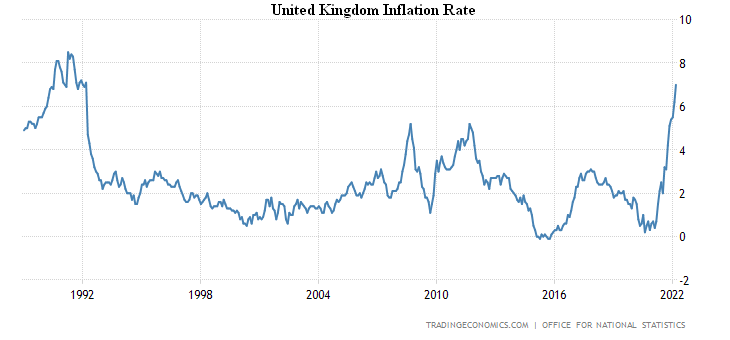
CPI Britain +7.0% per year, this is a 30-year peak:
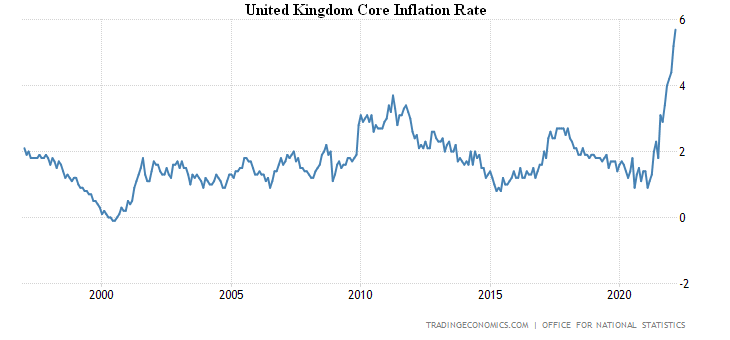
Excluding food, fuel, alcohol and tobacco, +5.7%, which is a 25-year record:
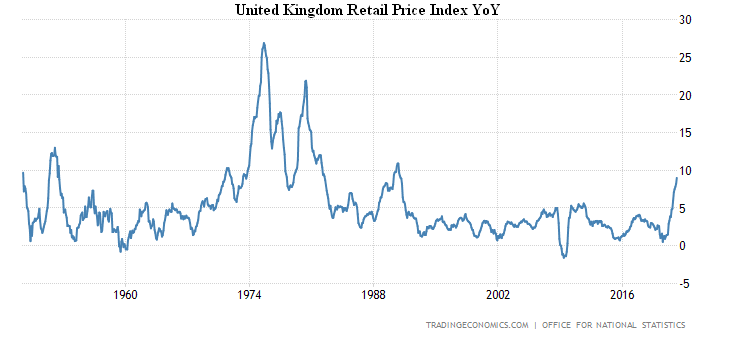
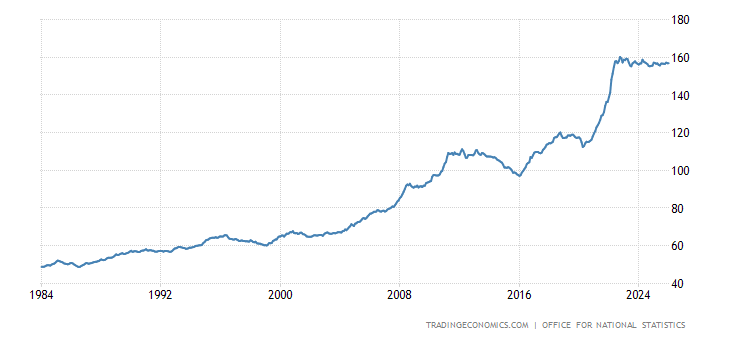
UK Retail Prices Index +9.0% y/y topped since 1991:
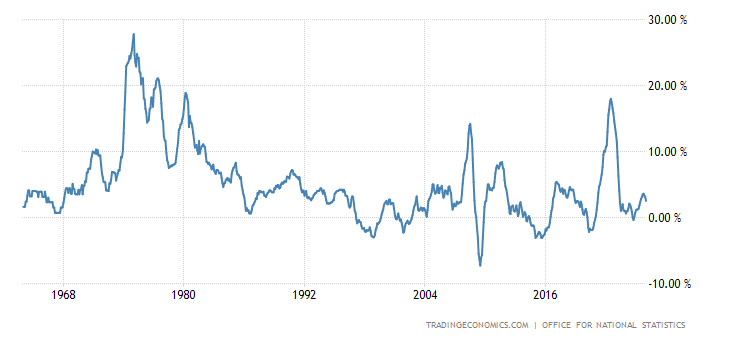
Britain’s PPI showed +11.9% per year and peaked since 2008:
Less food, alcohol, tobacco and energy +12.0% per year, a record high for 25 years of statistics:
Input producer prices +19.2% per year, a record for 26 years of survey:
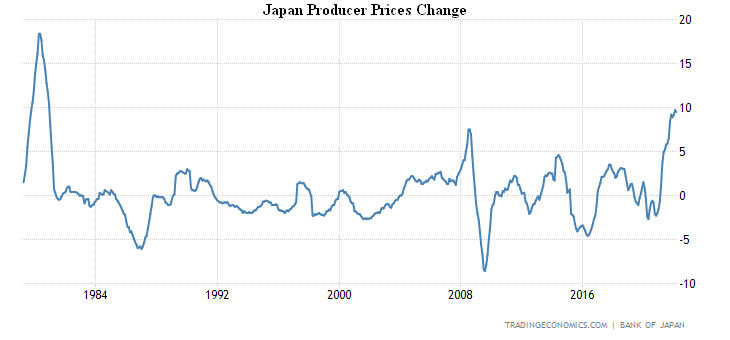
Japan PPI +9.5%, last month revised to 40-year high +9.7%:
Wholesale prices in Germany +22.6% per year, the record for 52 years of observation:
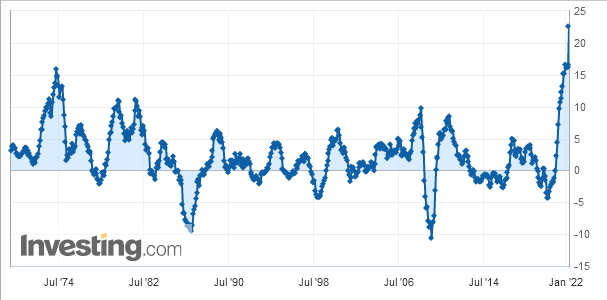
And their monthly surge (+6.9%) is unprecedented in 60 years of statistics:
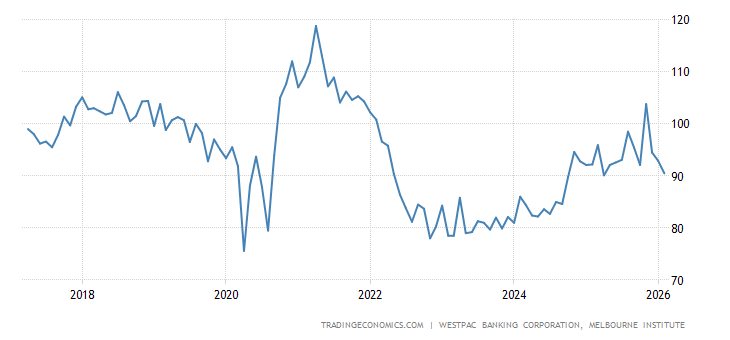
Pessimism of Australians is extreme for 1.5 years:
New Zealand credit card spending -1.3% m/m after -7.8%; -0.5% per year (1st negative in half a year):
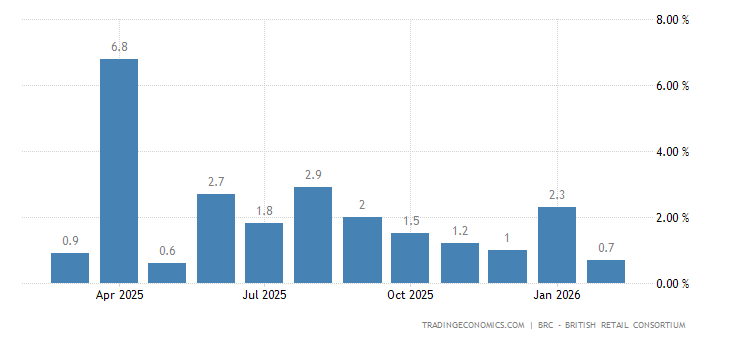
The UK retail sales monitor showed a 0.4% annual decline:
The New Zealand Central Bank raised the rate for the 4th consecutive time (0.5% to 1.5%) and is ready to continue tightening. The Canadian Central Bank also raised the rate by 0.5% to 1.0%. The South Korean Central Bank hiked rates by 0.25% to 1.50%. The Central Bank of Turkey left everything unchanged. The ECB confirmed that it is willing to complete asset purchases in Q3 and to start raising rates shortly thereafter. The Central Bank of China again reduced the norm of reserves: for large banks by 0.25% (to 11.25% — the lowest since 2007), for small ones — by 0.50%.
Summary. The inflation situation has become so acute that monetary authorities cannot but respond to it, any action, even harmful and senseless, is politically preferable to inaction. And the question is what to do? The dollar quickly lost confidence after the confiscation of Russian reserves, international trade is stagnating, both because of the sanctions war and because of the inability to predict the prices of both goods and insurance. At the same time, the US monetary authorities are extremely late with any activities:
As already noted in the first section, it is absolutely impossible to raise the rate to levels that provide a more or less normal return on debt assets (in reality, at least 10%). If this is not done, assets will depreciate along with household income and expenditure.
In reality, on the timescale of a similar crisis (March 1930 — December 1932), the US remained somewhere in the fall of 1930, a structural crisis with GDP falling by about 8-10% has already begun (compare the difference between inflation and income growth), but there are still illusions that it might run out. But one should not be led astray.
The fall in real spending (i.e., the decline in GDP) will outpace the fall in household income, partly offset by budget support.
The only difference is that 90 years ago the crisis was deflationary, but today it is inflationary, but there is no substantive difference.
Details of this process can be found in M. Khazin’s book “Crisis of capital effectiveness: An idea is useless if it can’t be used to solve a task”. Here it makes sense to note that the development of the crisis surprisingly accurately corresponds to the theoretical constructs of this book and it is certainly a consequence of the fact that the US monetary authorities for many years simply ignored it. Probably because they thought emissions were an absolute panacea for problems.
I do not think that this crisis can be stopped, it will continue until the economy is in equilibrium state relative to household incomes and expenditures, corresponding to US GDP of about 7-7.5 trillion dollars at 2019 prices. This is about three times less than the official US GDP and half less than the real one (this difference between official and real GDP is related to the revaluation of financial assets and attribution of this fictitious value to GDP). But it can be accelerated by sharply increasing the rate.
The rate of decline now stands at 7-8% of GDP (taking into account real inflation), but it can be accelerated once to 15-20%, following the example of Russia in 2015. Let’s see which option the US monetary authorities will prefer. But some certain companies (but they are quite few) may even benefit from this crisis. And the development of appropriate strategies is one of the fields in which the company friendly to the Mikhail Khazin Foundation for Economic Research, the Strategic Forecasting Agency “Ark (Kovcheg)” operates.
We wish our readers a successful working week!