
October 21-28, 2023
Big news. The sharp growth of US GDP (according to previous data) amounted to 4.9% (quarter to quarter, but on an annualized basis). The previous value was 2.1%, the forecast was 4.0%.
Of course, this indicator may decrease in the process of refinement; in addition, let us keep in mind that in the USA they have once again fundamentally changed the calculation methodology (see the last section of the Review). Note that the PMI index data (expert index of the state of the industry; its value below 50 means stagnation and decline) of the USA (see the next section) both in general and in individual areas, industry and services, were on the verge of depression, which means there is no reason that allows growth. And in general, these figures are not informative, since they differ very little from the previous ones.
So, most likely, we are dealing with an artifact of a new technique, aggravated by the situation with money pumping. And not from the side of the emission center, as was the case before, but from the budget side, while it’s deficit is breaking all records. Of course, this situation needs to be examined, in particular, to look at inflation to see if it has begun to grow significantly, but we will see this picture by mid-November. In any case, the deflator index in the third quarter (according to the same preliminary data) increased significantly, to 3.5%, from the previous value of 1.7%.
But at least we see that something in the US economy has begun to change and this situation needs to be carefully controlled. For now, the situation needs to be monitored extremely carefully, since it will be incredibly difficult to more or less adequately assess statistical indicators in the coming months. All the experience accumulated in recent years in assessing US statistics has been nullified and needs to be developed anew.
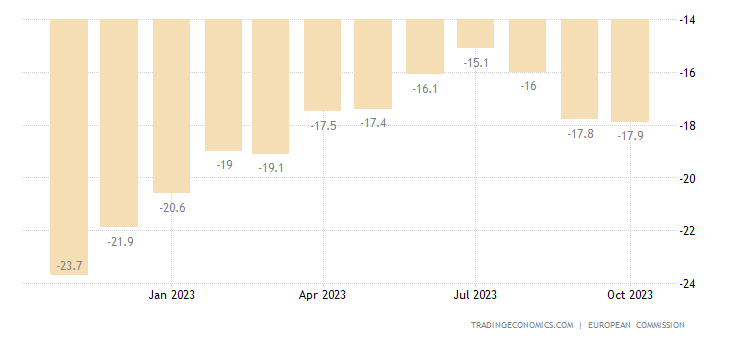
Macroeconomics. Industrial sales in Italy -5.0% per year – the 5th negative in a row and the worst dynamics in 3 years:
Pic. 1
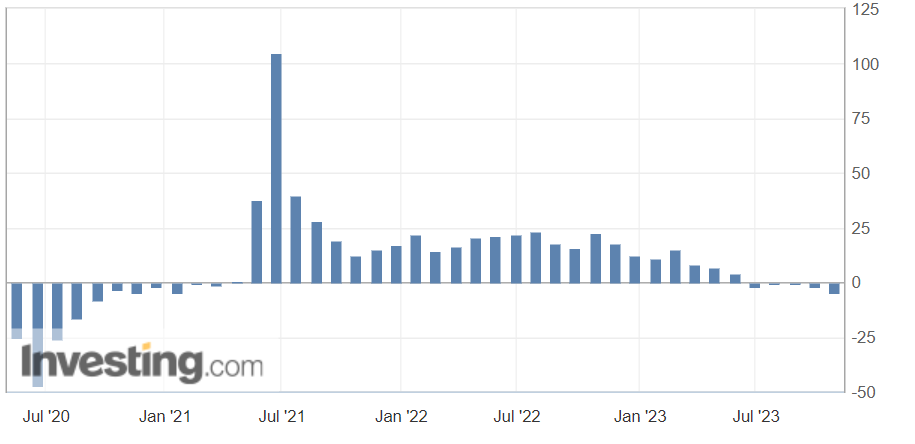
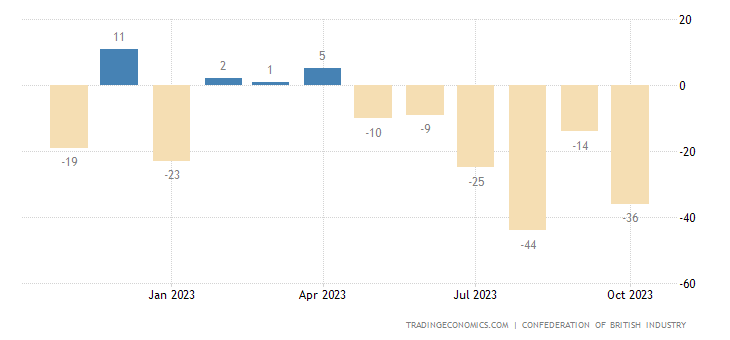
The balance of industrial orders in Britain (-26) is the weakest in almost 3 years:
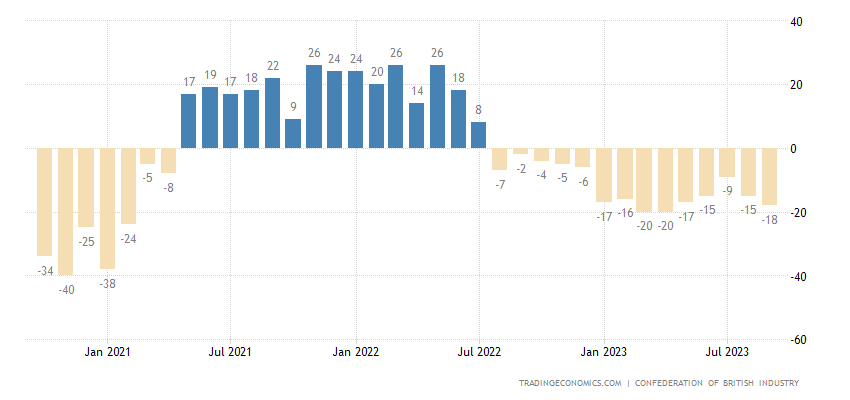
Pic. 2
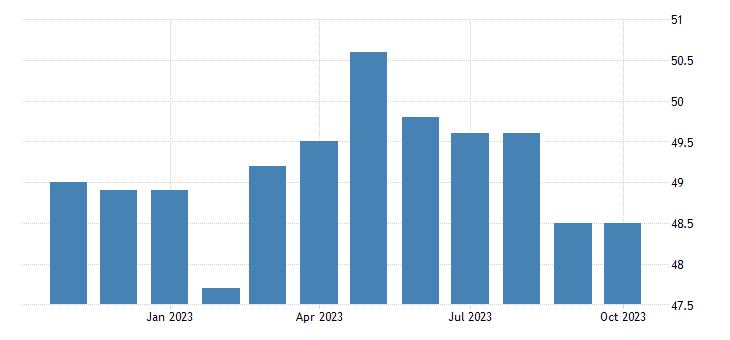
Australia industry PMI worst in 3.5 years:
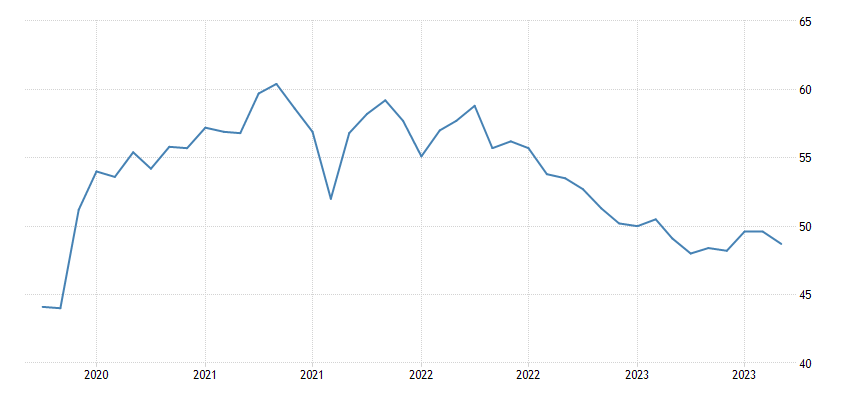
Pic. 3
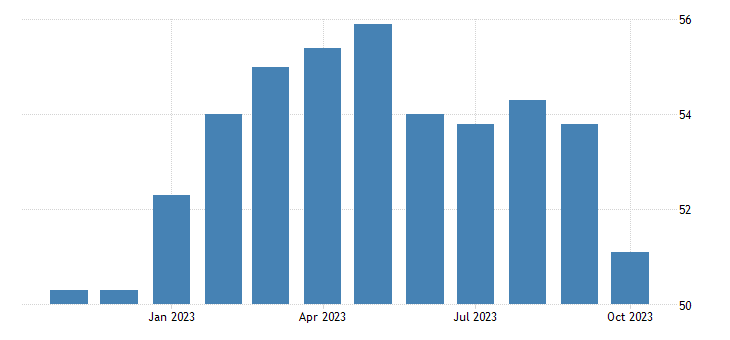
In the service sector – for 10 months:
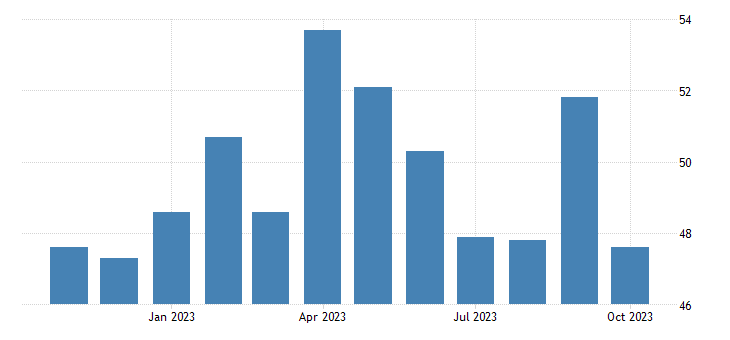
Pic. 4
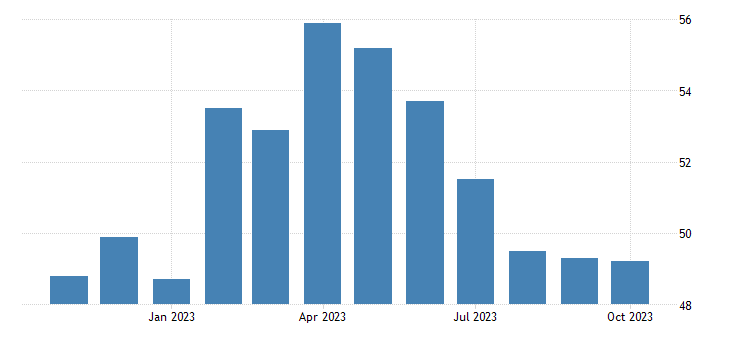
In Japan, the lows for 8 and 10 months, respectively:
Pic. 5
Pic. 6
In France, the manufacturing PMI has been at the bottom for 3.5 years, and without taking into account the Covid dip – for 11 years:
Pic. 7
In the UK services sector, the 9-month minimum:
Pic. 8
In the US, the composite PMI index for October was 51.0 (it was 50.2 in September), the industrial index was 50.0, and was 49.8, the services index was 50.9, and was 50.1. It is pointless to present graphs here, since the data on the basis of which experts made their conclusions has radically changed.
Business trust in Turkey minimum for 8 months:
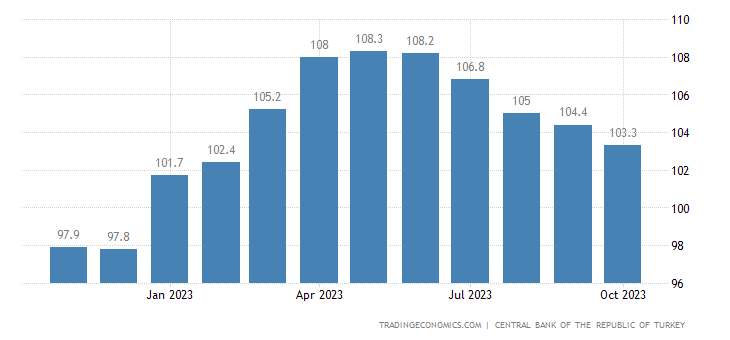
Pic. 9
In Brazil – in 4 months:
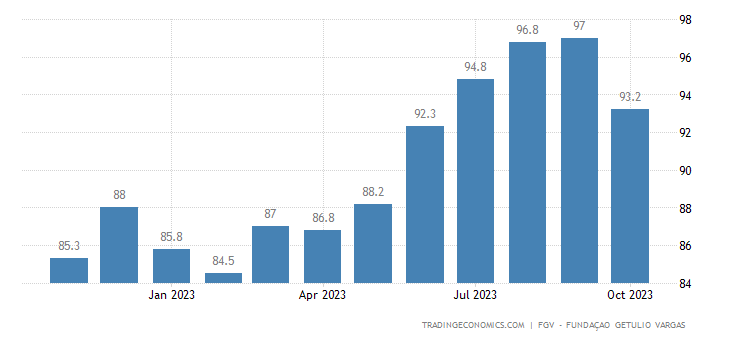
Pic. 10
In Belgium – for 3.5 years, and without taking into account the covid failure – since 2009:
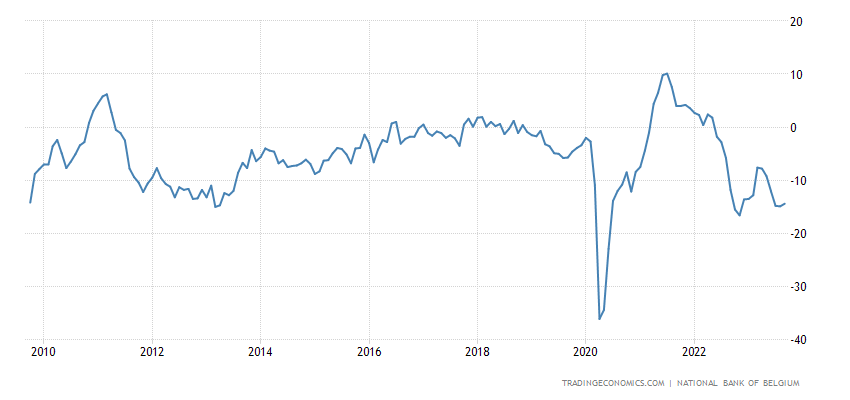
Pic. 11
Same in Canada:
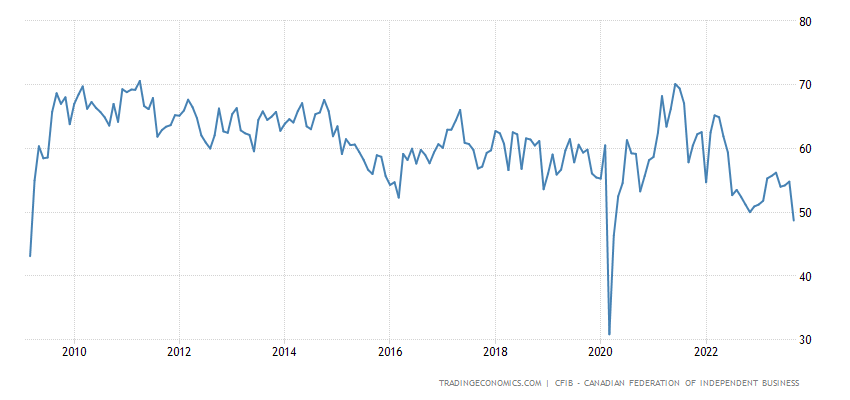
Pic. 12
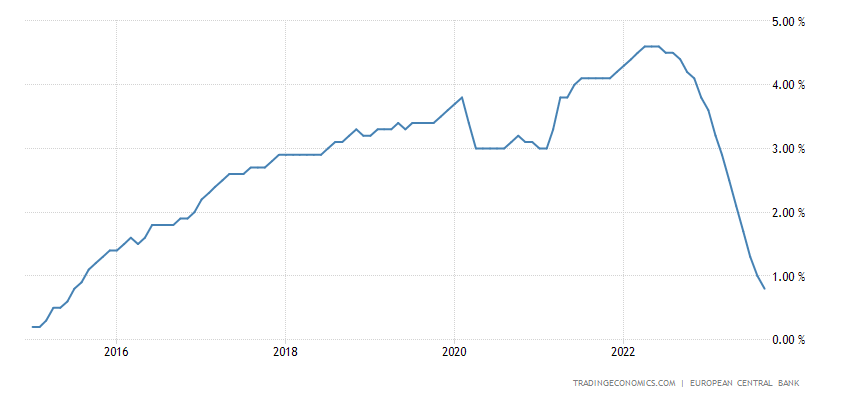
In Sweden – for 3 years, and minus the failure of 2020 – since 2013:
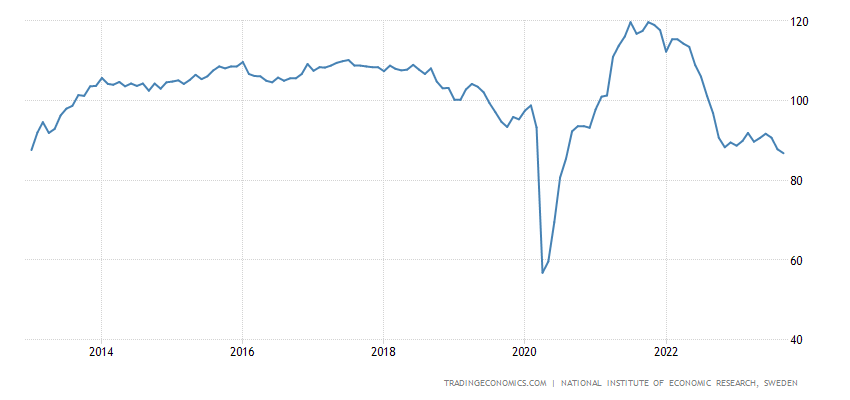
Pic. 13
Same in Italy:
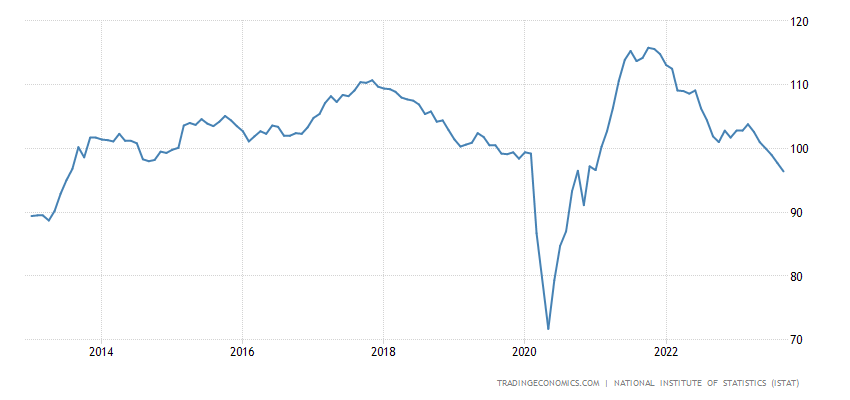
Pic.14
Pending sales of secondary housing in the US -11% per year – the 28th negative in a row:
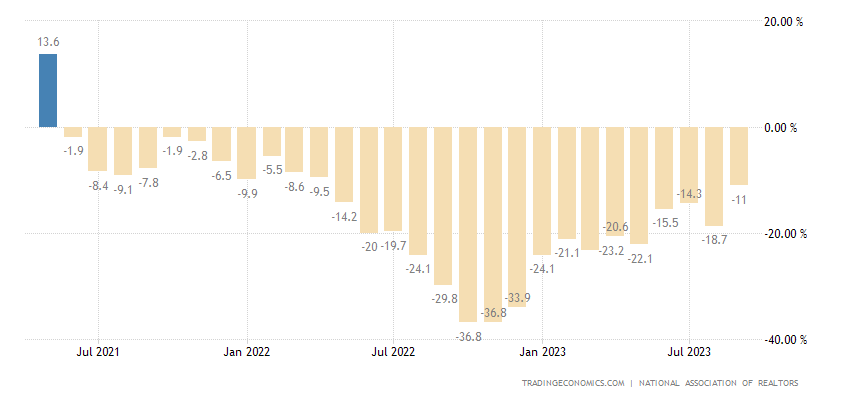
Pic. 15
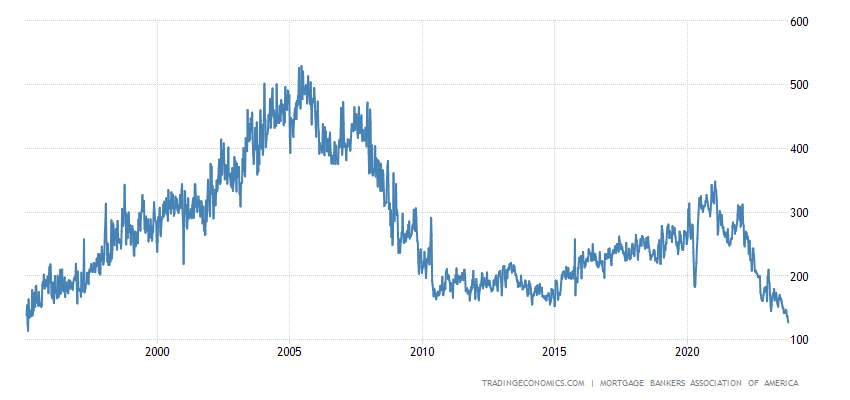
US mortgage applications hit 28-year low:
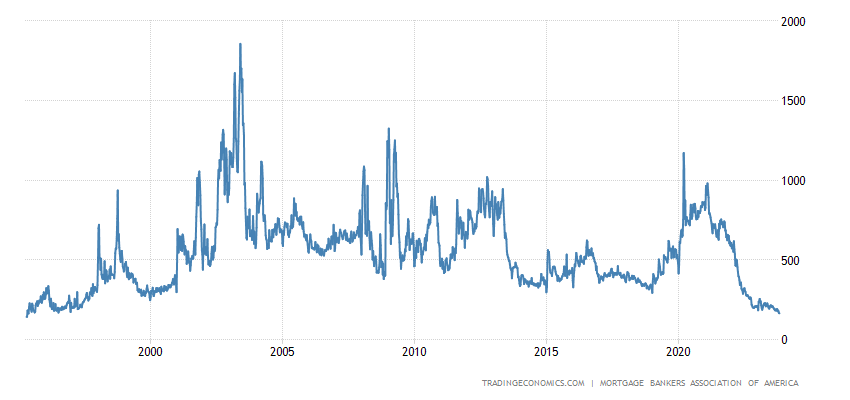
Pic. 16
Including loans for the purchase (not refinancing) of housing:
Pic. 17
The maximum loan rate for 23 years (7.90%):
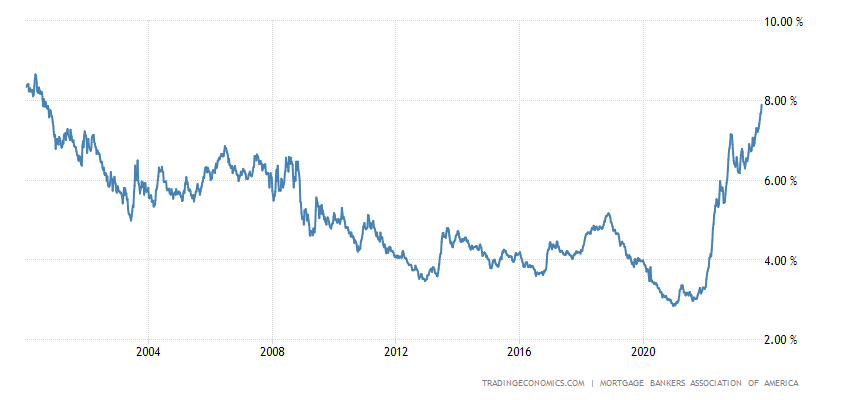
Pic. 18
The same peak was noted in interest rates on loans from Freddie Mac (7.79%):
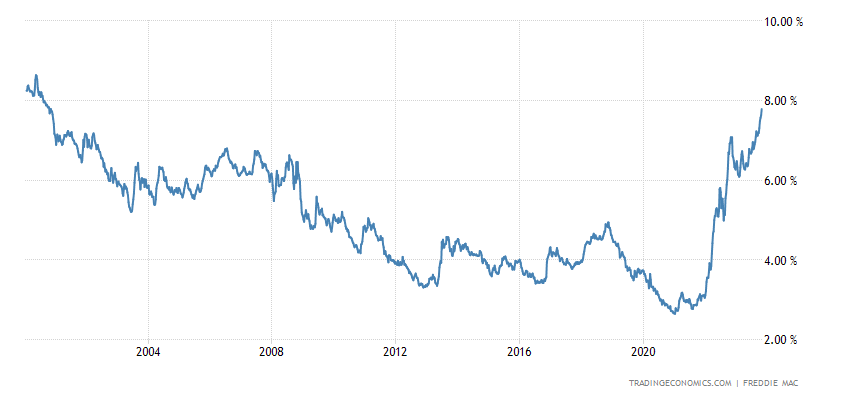
Pic. 19
Its 15-year loans are also the most expensive since 2000 (7.03%):
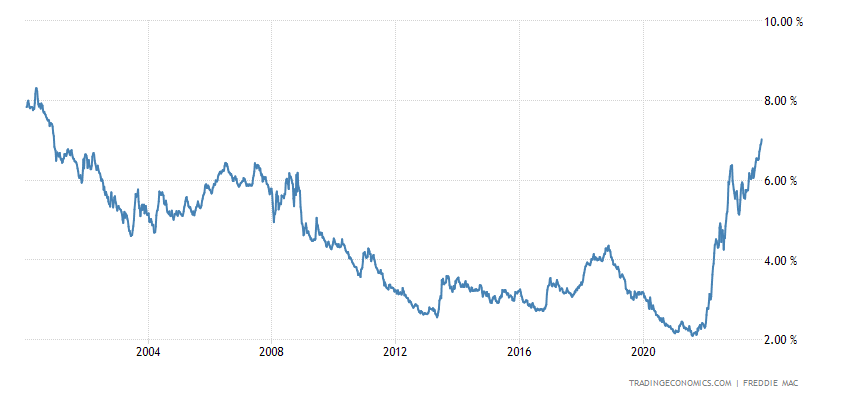
Pic. 20
Loans to households in the eurozone +0.8% per annum – 8-year minimum:
Pic. 21
In Sweden, household loans +0.7% per year – the weakest dynamics since 1996:
Pic. 22
Tokyo Prefecture CPI (Consumer Inflation Index) in Japan +2.7% per year – 34-year high:
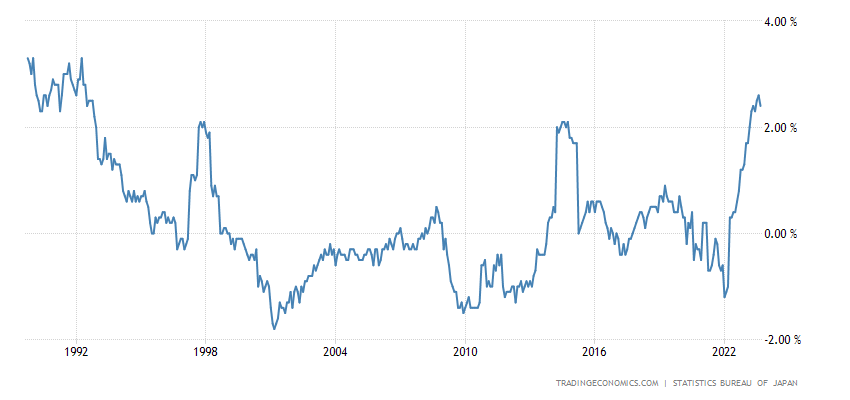
Pic. 23
Inflation expectations in the US at a six-month peak (+4.2% per year):
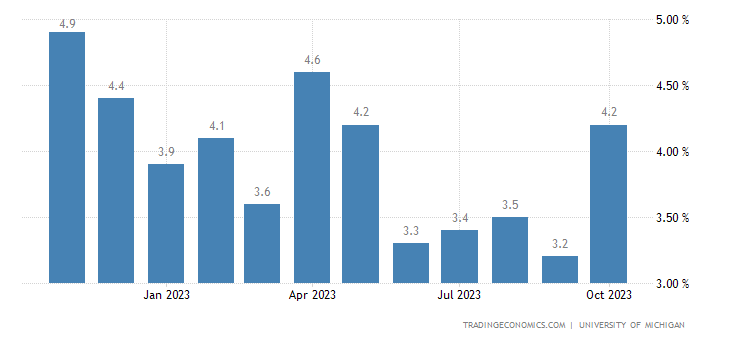
Pic. 24
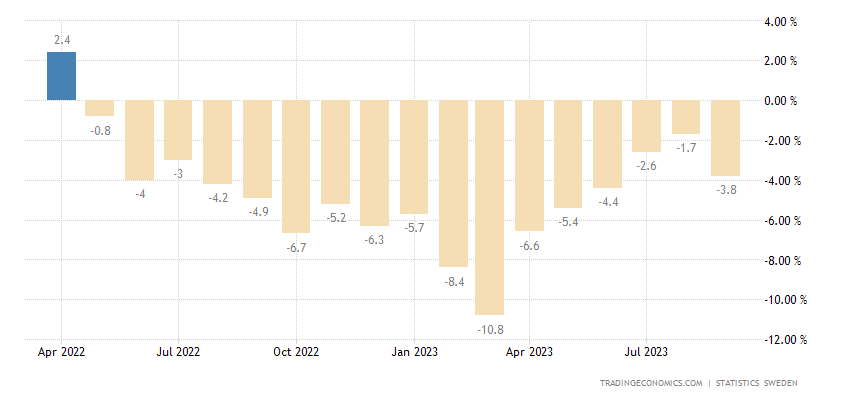
Swedish retail sales volume -3.8% per year – 17th negative in a row:
Pic. 25
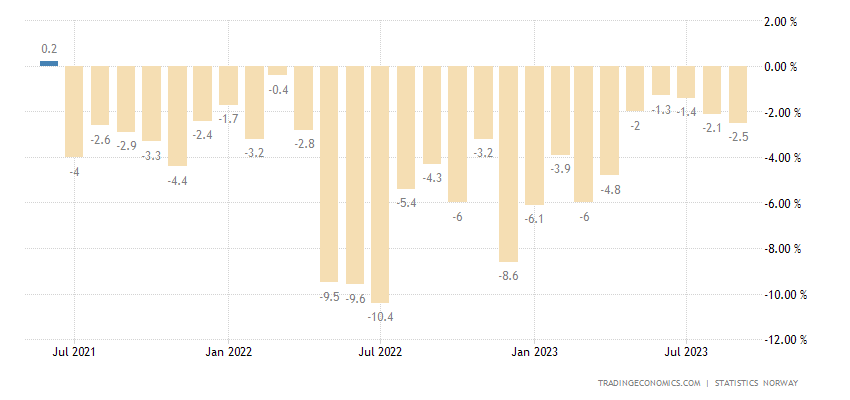
Retail in Norway -2.5% per year – 27th negative in a row:
Pic. 26
The retail balance in Britain has been in the red for 6 months in a row:
Pic. 27
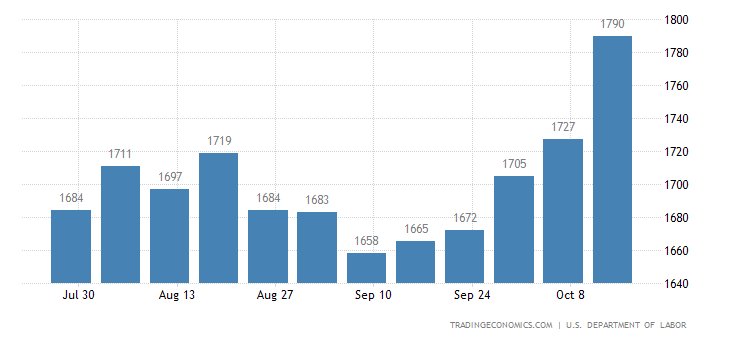
The number of recipients of unemployment benefits in the United States is the highest in six months:
Pic. 28
Eurozone consumers are pessimistic at their highest in 7 months:
Pic. 29
In Italy – in 9 months:
Pic. 30
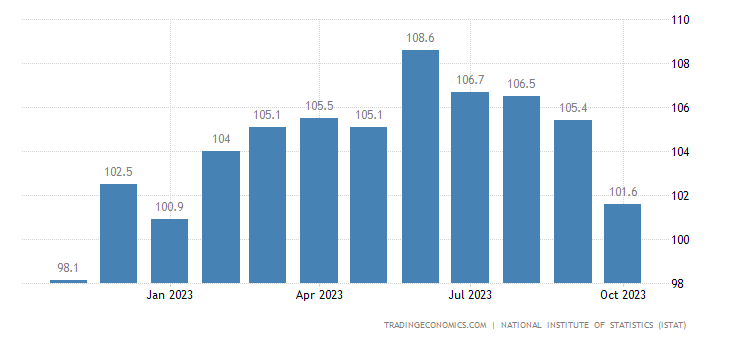
In South Korea – in 5 months:
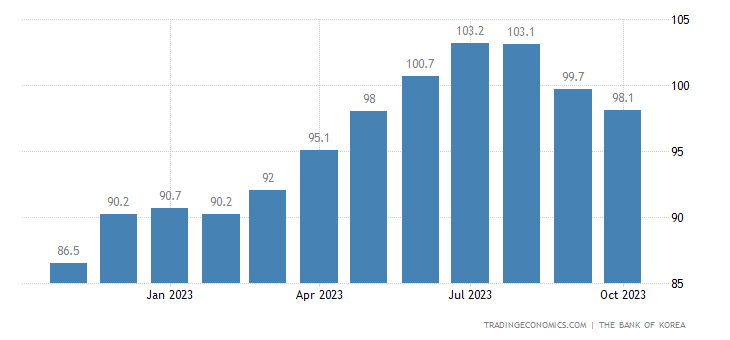
Pic. 31
Turkey’s central bank raised rates by 5% to a 20-year high of 35%. The Central Bank of Canada left monetary policy the same, as did the ECB.
Main conclusions. First of all, let us note that Treasury Secretary Janet Yellen said third-quarter growth data shows the U.S. economy is doing very well and that there is evidence of a soft landing, with inflation falling without causing a recession. She also said the rise in long-term bond yields was a reflection of the strong U.S. economy, not a jump in government borrowing.
Her statements about inflation do not even correspond to official data (although, perhaps, she said this before the corresponding indicators appeared in the public domain). But here is the picture of the American stock market at the time of this statement:

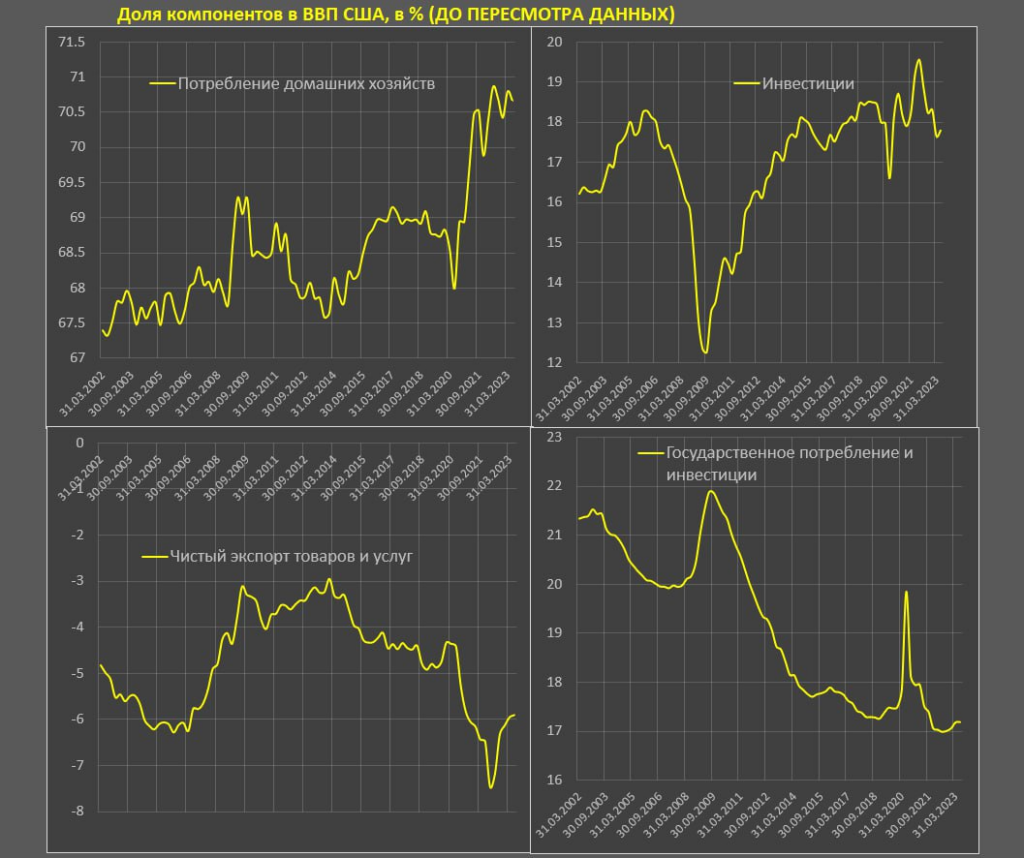
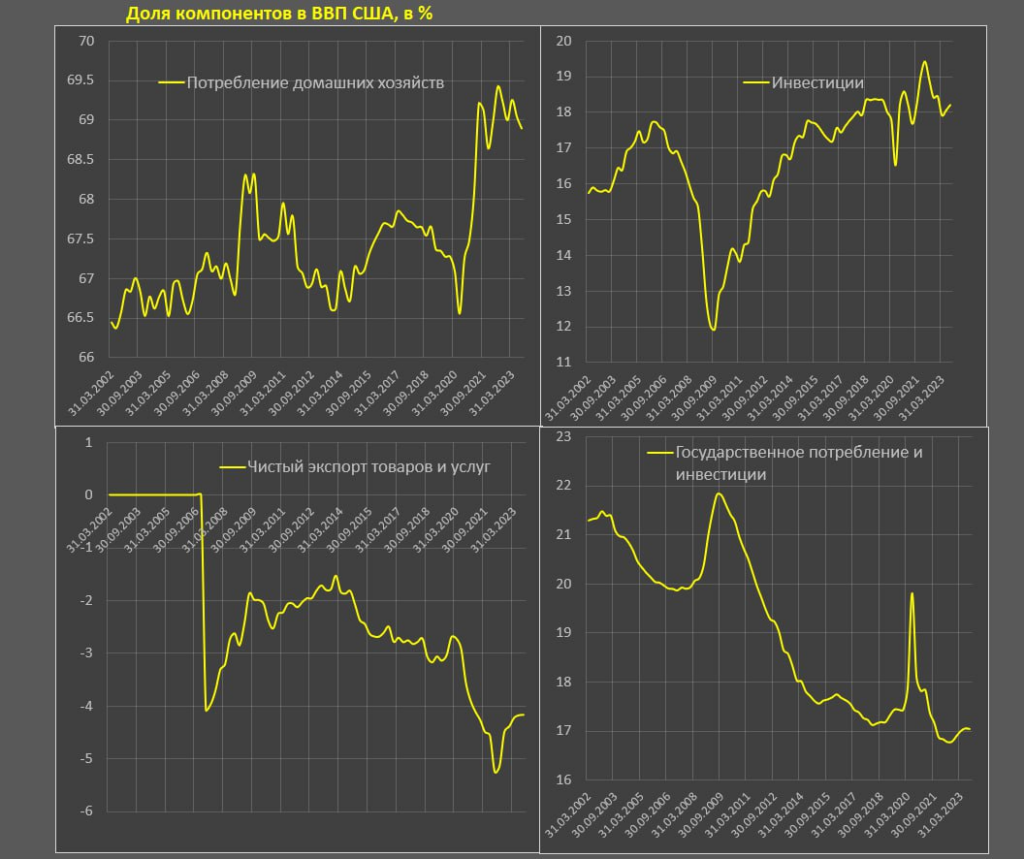
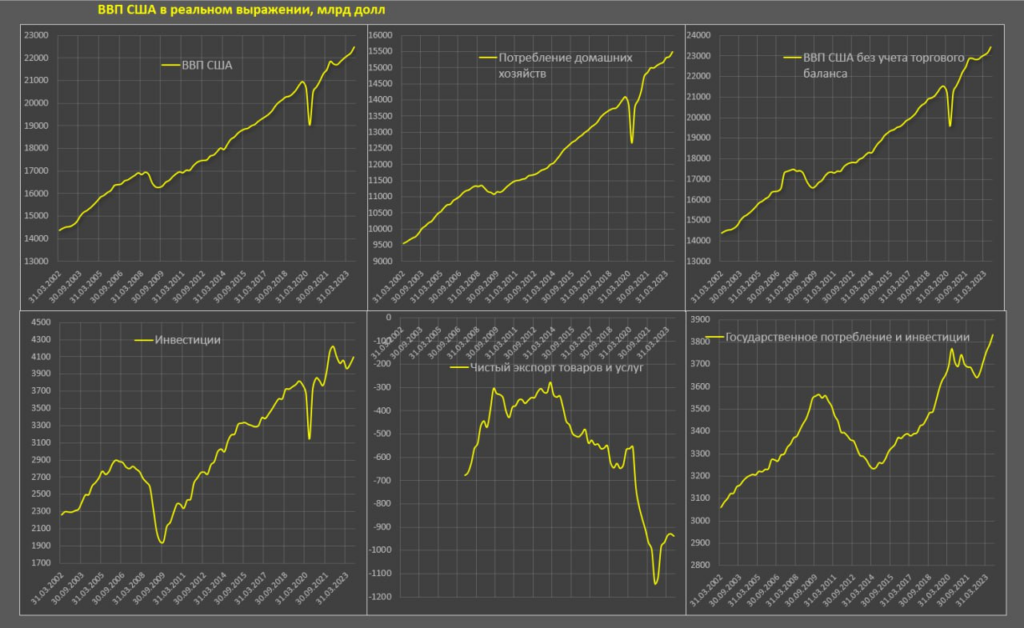
By the way, our assertion that the United States is not able to pull out its industry at the expense of domestic demand received additional confirmation:
So something is not working out for Yellen…
And, in conclusion, about the revision of statistical data (commentary by Pavel Ryabov).

“Once again, there has been a massive revision of American statistics… since 1947!
This could have been expected based on a large-scale revision of data on the incomes and expenses of Americans, but now there has been a revision of all key macroeconomic indicators for the entire history of the United States! However, the main transformation of data began in 2013 (before that there were “cosmetic” changes).
The scale of the “sabotage” has yet to be assessed, but, as far as the main indicator (GDP) is concerned, both nominal GDP and the deflator have been revised. The discrepancy in nominal GDP was 0.85%, and in the deflator – over 1% (they underestimated overall inflation). In addition to this, the statistics were adjusted to 2017 prices, while previously the comparison was with 2012.
As a result, according to new data, the accumulated growth of the American economy over 10 years turned out to be almost 2% higher than according to old data. The most significant changes in the crisis year of 2020 are now a drop of only 2.2%, whereas previously it was believed that GDP fell by 3.4%.
In 3Q 2023, the US economy was 7.4% higher than the pre-Covid level (4Q19), where household consumption increased by 10%, of which the increase in demand for goods was 18.2% in real terms, and demand for services increased by 6.2%.
Investment in fixed assets increased by 6%, exports grew by only 1.2% (!), and imports soared by 13.2%, increasing the trade deficit. Government consumption and investment grew by 5%.
By trend growth:
- US GDP from 4Q2013 to 4Q 2019 (6 years) had an average quarterly growth rate of 0.63%, from 4Q19 to 3Q23 the average quarterly growth was 0.48%, and from 4Q21 (the beginning of monetary policy tightening) to 3Q23 the growth was 0.44%, i.e. growth is slightly below the pre-crisis trend. Further comparisons will be in the specified order.
- DMX consumption: 0.67%, 0.65%, 0.49%
- Gross investment: 0.92%, 0.56%, minus 0.23% due to inventory effect
- Investments in fixed assets: 1.05%, 0.4%, 0.22%
- Government consumption and investment: 0.49%, 0.33%, 0.59%.
Investments are lagging far behind, but consumer demand is very strong, and government consumption will accelerate from 2022.”
And the point here is not only that this is a change in indicators (and, say, a decrease in inflation automatically increases GDP). The point is that it is now becoming much more difficult to compare data and draw systemic conclusions. However, we hope to overcome these problems, so that our readers can relax on weekends and work during the work week!