
November 26 – December 2, 2022
Big news. The main news was the psychological preparation of the public, and then the recognition of the head of the Fed, Powell, that the rate hike cycle could slow down. Taking into account the fact that just a few weeks ago, the Fed leaders said harshly: we will increase until inflation reaches 2%, whether someone likes it or not.
What does this mean? First of all, we note that the rate of inflation declines, although they are taking place, is clearly inferior to the hopes of the leadership of the US monetary authorities, which they have been talking about for a couple of weeks, and we discussed in the previous review. But there is another important circumstance: raising the rate leads to dangerous consequences, an increase in the cost of servicing the debt that has grown dramatically over the past decades. Aggravated by a sharp decline in the money supply, that is, the potential income of borrowers.
We cannot know the exact figures here, neither inflation nor the burden on borrowers. The official values of inflation indicators show a decrease (see the previous Review), but we do not know their real values. Perhaps the picture is not so optimistic. And certainly, these figures, even in their official form, are more than the leaders of the monetary authorities would like. Accordingly, there are two variants of their logic.
First: they believe that everything is going “as it should”, but a little slower than we would like. And therefore, it makes sense to wait, whether there will be a decrease in inflation “by itself”. Second, they see for sure that the negative consequences of the rate hike and the contraction of the money supply are growing, and they hope that inflation will continue to decline, since raising the rate is already simply dangerous.
Recall that the discussion about the causes of the crisis of 1930-32, which led to the “Great” depression, came to the conclusion (which is generally accepted today) that there was an excessive tightening of monetary policy. Our conclusion is completely different (see M. Khazin, “Memories of the Future”), but in this case it does not play a role, since the US monetary authorities make decisions based on their experience. In other words, at this point, the Khazin Fund can afford to make a forecast that differs from the forecast of the Fed (as was the case in the fall of 2021, when we, unlike the US monetary authorities, predicted inflation growth and turned out to be right).
Its essence is that inflation will not be reduced to the 2% desired by Powell and his associates. Its structural component will remain and, quite possibly, will even increase, since the tightening of monetary policy leads to an acceleration of the structural crisis (as it happened almost 100 years ago).
Today, it is possible to estimate the structural component of inflation at 8 percent, but this is a very general estimate, which, moreover, is based on official figures, which can be seriously underestimated (and no one knows by how much). If the Fed does not raise the rate next week or raise it slightly, by mid-January, when December inflation indicators appear, we will most likely see either a slight increase or a stop in the decline in inflation indicators and the leadership of the US monetary authorities will be forced to return to the issue after the New Year holidays. Well, we can understand which of the two scenarios described above corresponded to reality.
The topic is continued in the final section. For now, we will only note that the general economic processes in the US do not inspire optimism (see the next section of this Review).
Macroeconomics. Turkey’s GDP has gone into negative territory for the first time in 2 years (-0.1% per quarter):
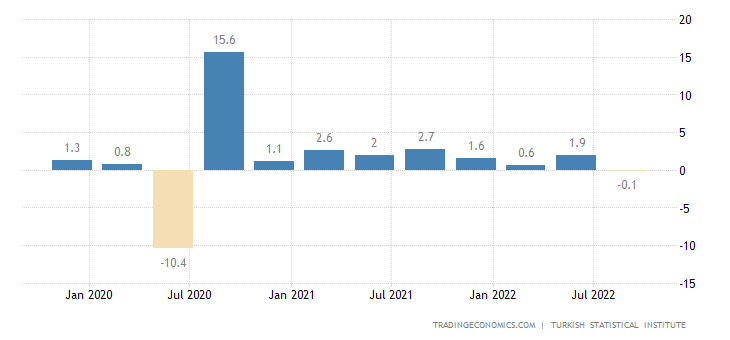
Turkey is an export country and therefore much less dependent on high inflation than the US. But the decline in its GDP suggests that the general degradation processes in the world economy are already beginning to act through world markets.
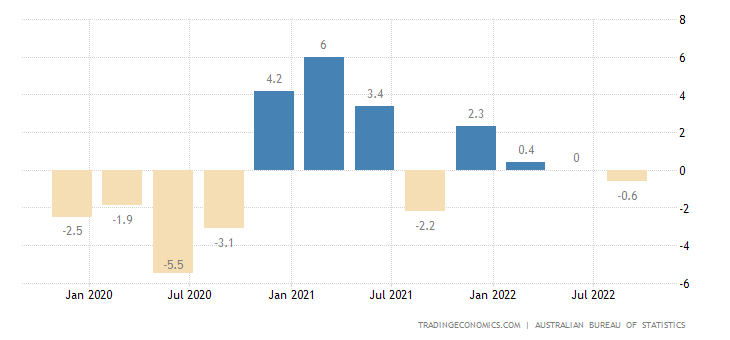
Australian private capital spending -0.6% qoq after 0.0% earlier:
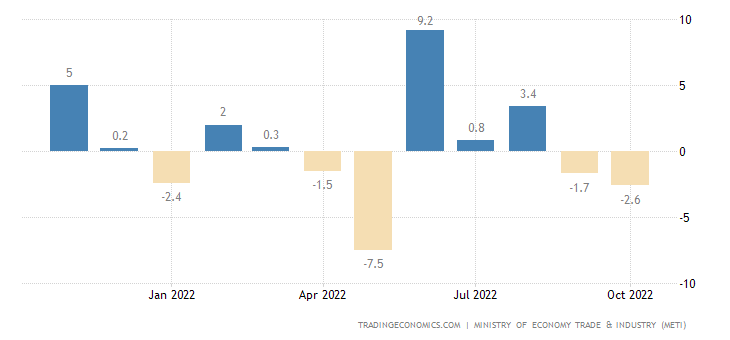
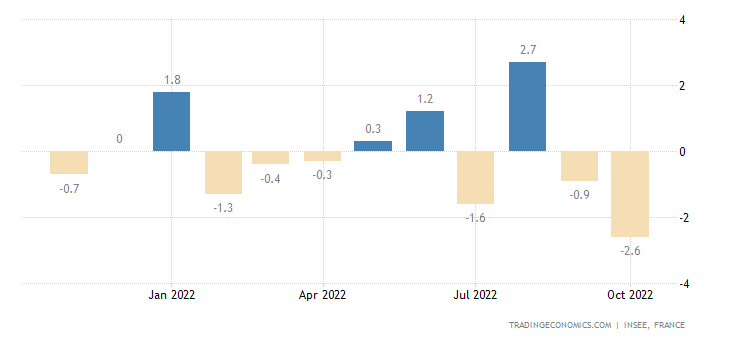
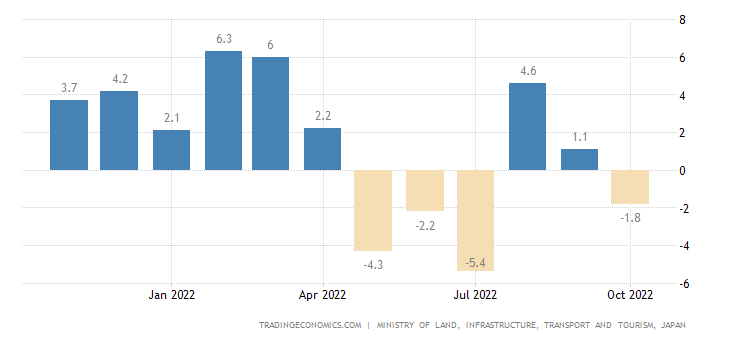
Industrial production in Japan -2.6% m/m – 2nd negative in a row:
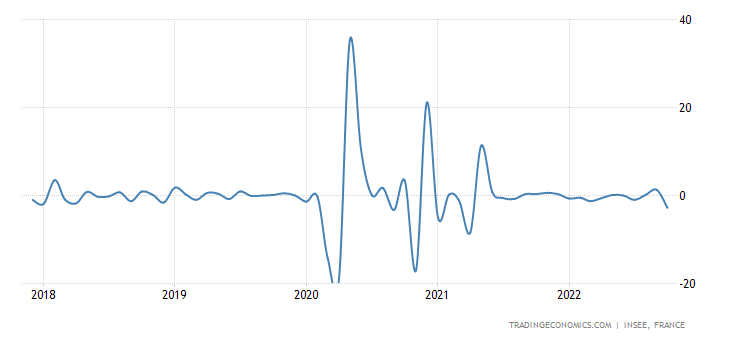
Exactly the same in France:
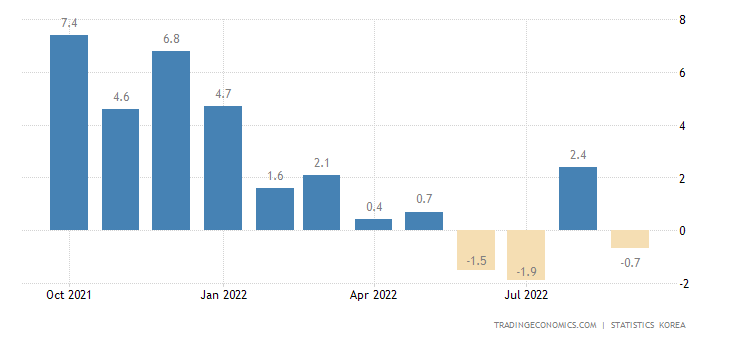
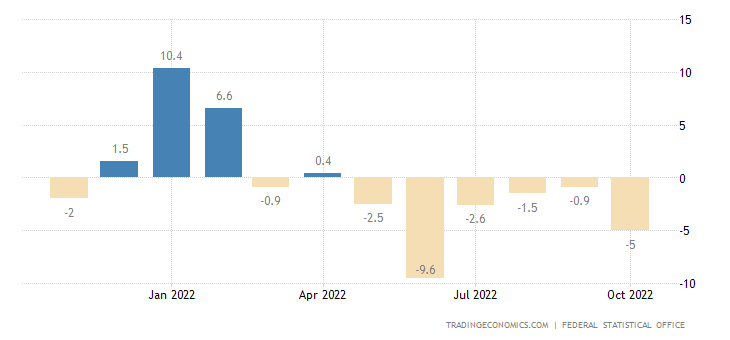
Industrial production in South Korea -3.5% per month – the 4th negative in a row and the worst dynamics since 2020 (and before that – since 2014):
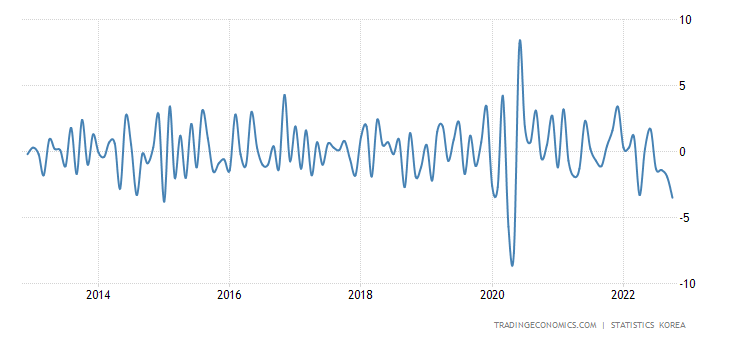
This is why the annual dynamics went negative (-1.1%) for the first time in more than a year:
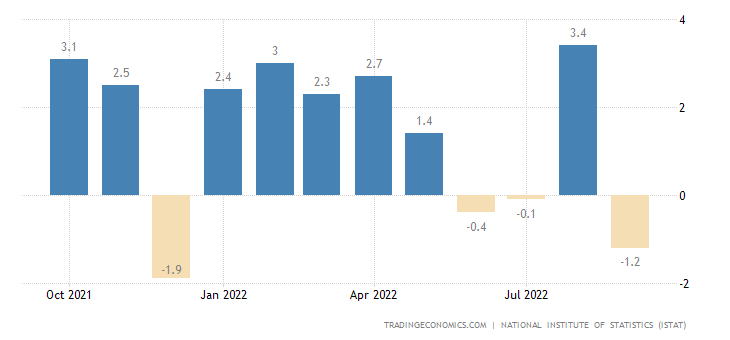
Sales in the manufacturing industry in Italy -1.2% per month – 3rd minus in the last 4 months:
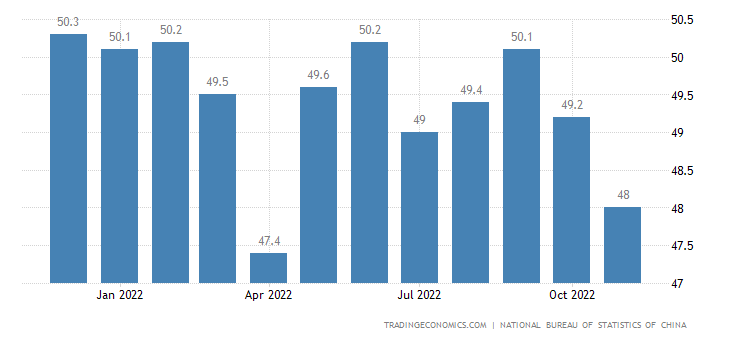
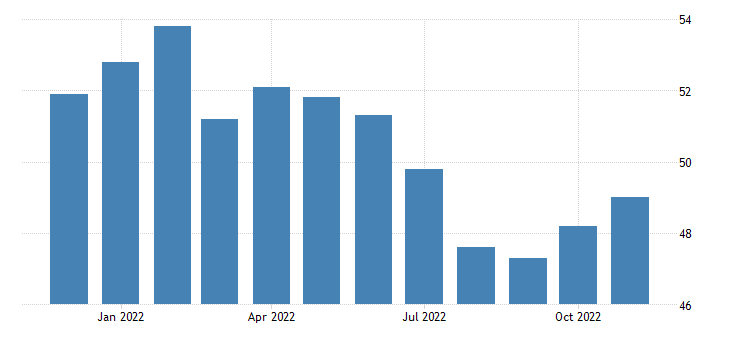
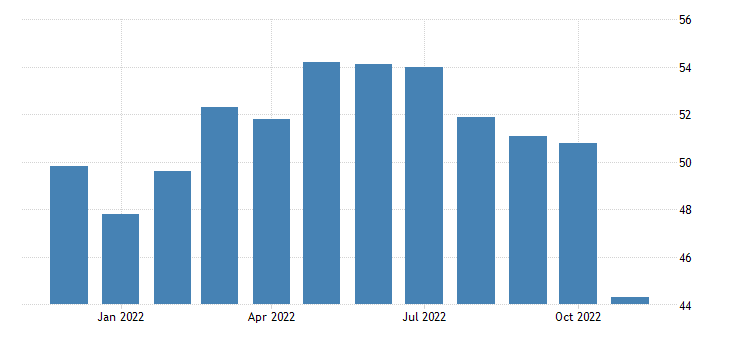
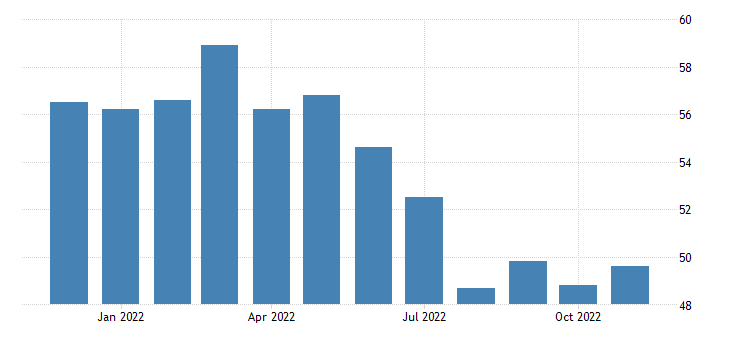
The official PMI (an expert index for assessing the state of the industry; its value below 50 means degradation and decline) of China’s industry is the worst in 7 months and is clearly in the recession zone (48.0):
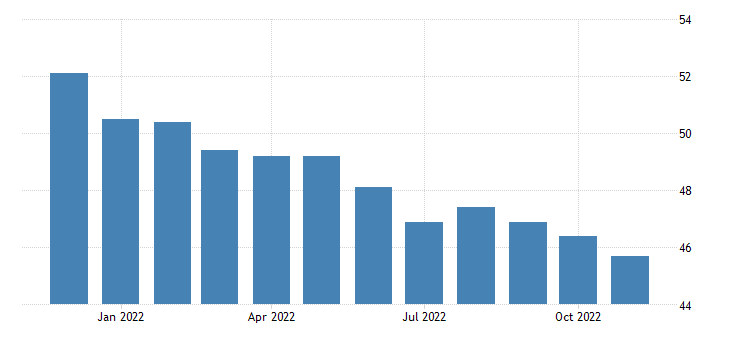
The same is true in the service sector (46.7):
Independent estimates of industrial PMI are slightly more optimistic, they have 49.2:
And there are serious reasons to believe that this is why there are the unrest in China: objective economic indicators require the closure of a number of enterprises, and it is very scary to do this.
Other countries are no better — their production PMI is in a recession zone.
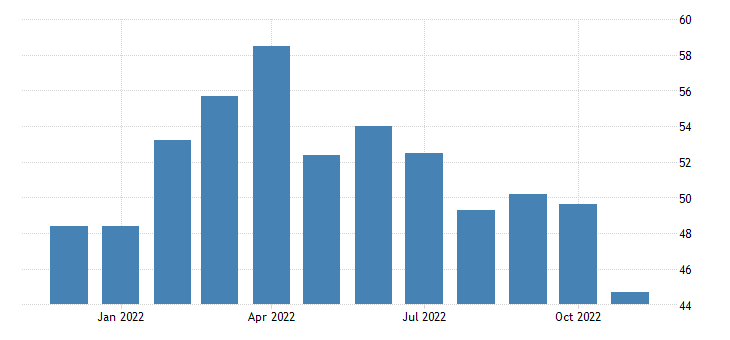
Australia (44.7):
Japan (49.0) :
South Korea (also 49.0):
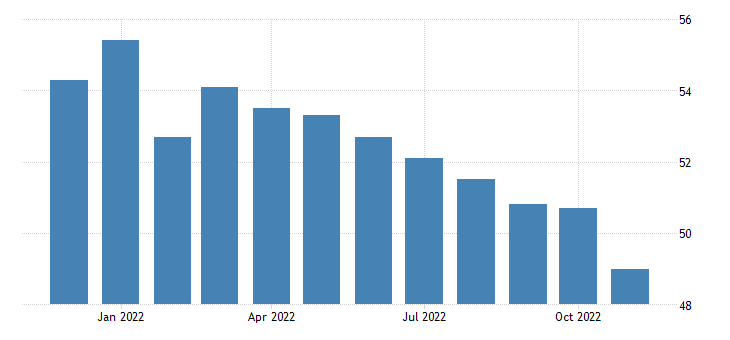
Turkey (45.7):
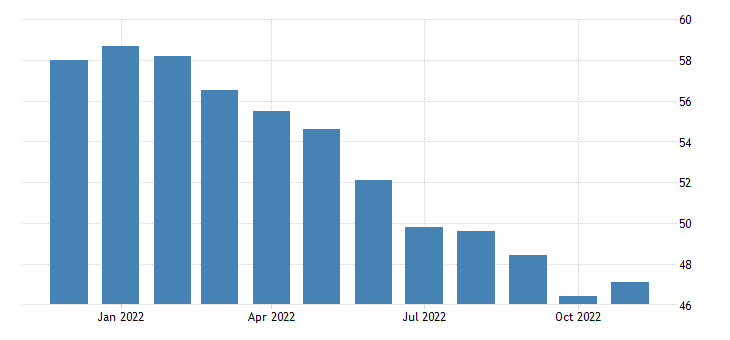
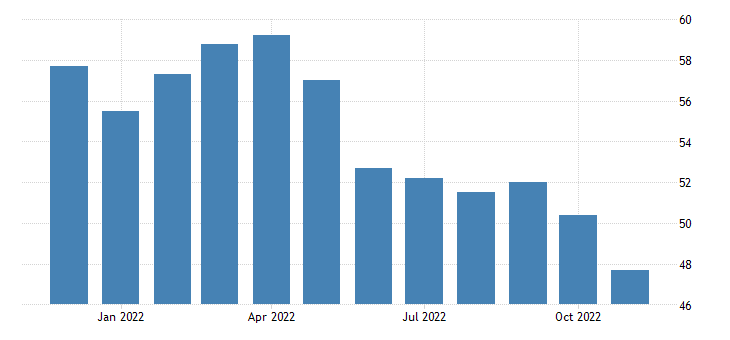
Eurozone (47.1):
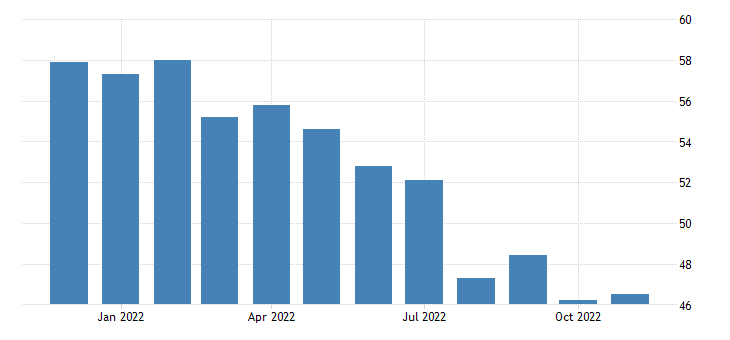
Britain (46.5):
Brazil (44.3):
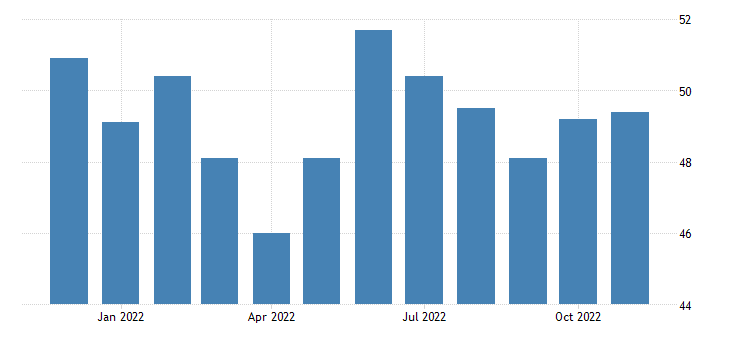
Canada (49.6):
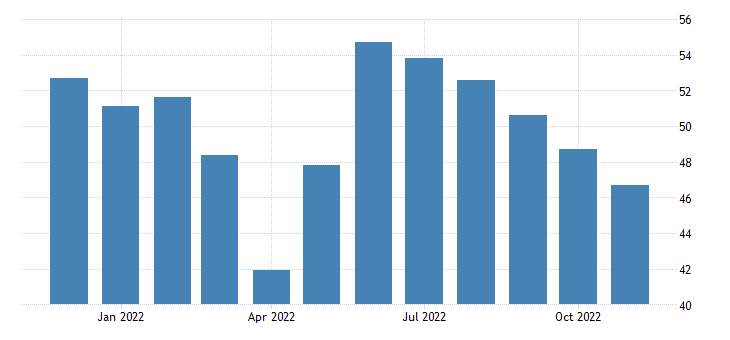
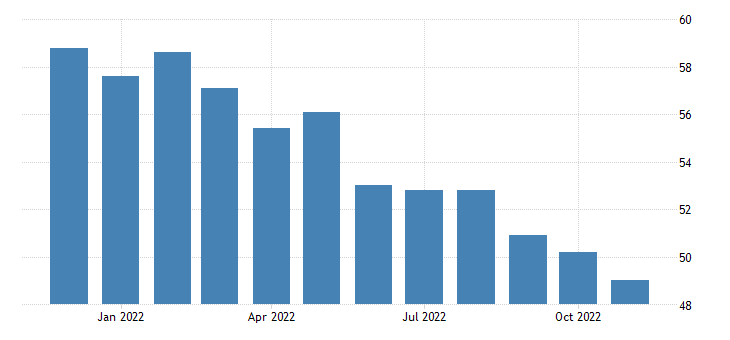
USA (47.7 and 49.0 according to different versions):
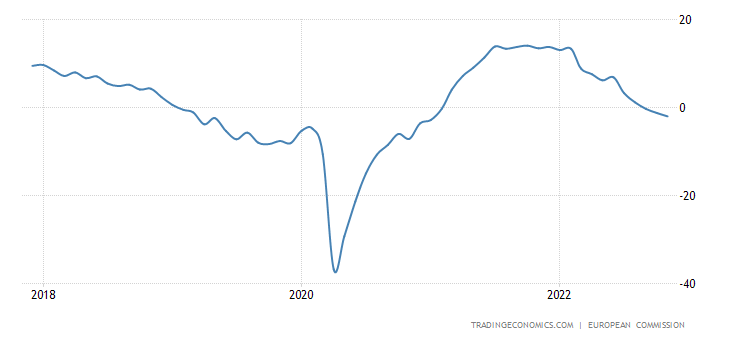
Eurozone industry sentiment is in the red and getting worse – already the worst in 22 months:
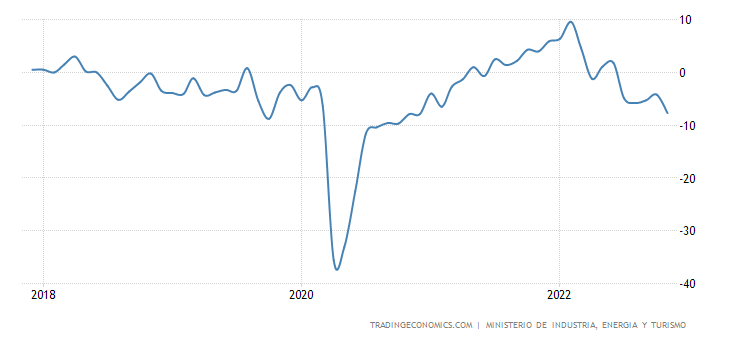
And in Spain – for 23 months:
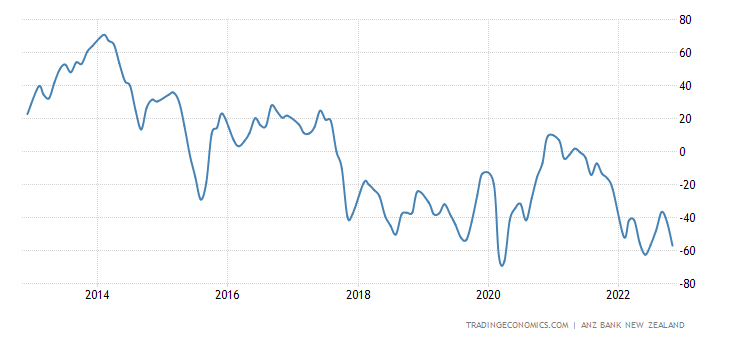
New Zealand business confidence is back in the global lows:
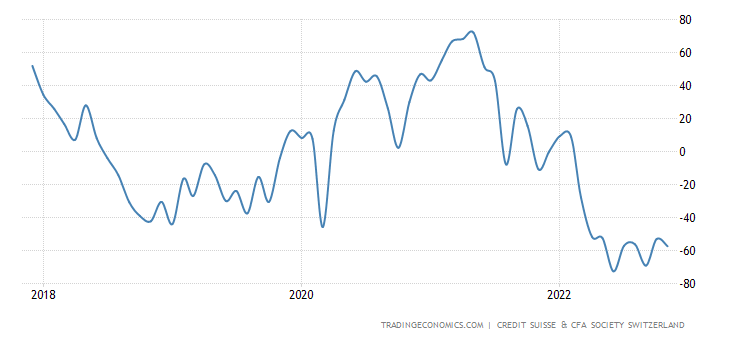
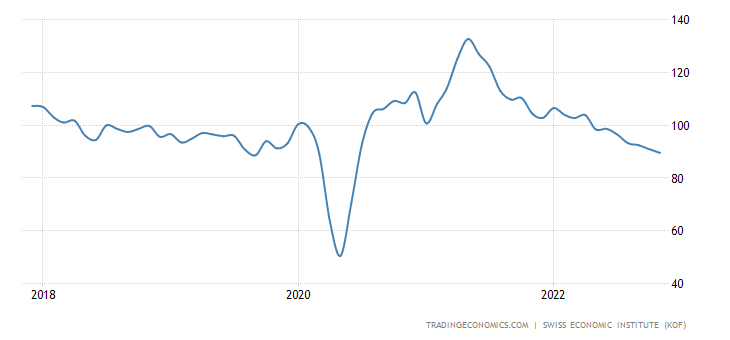
As in Switzerland:
Swiss leading indicators are the worst in 1.5 years, below the long-term average for 6 consecutive months:
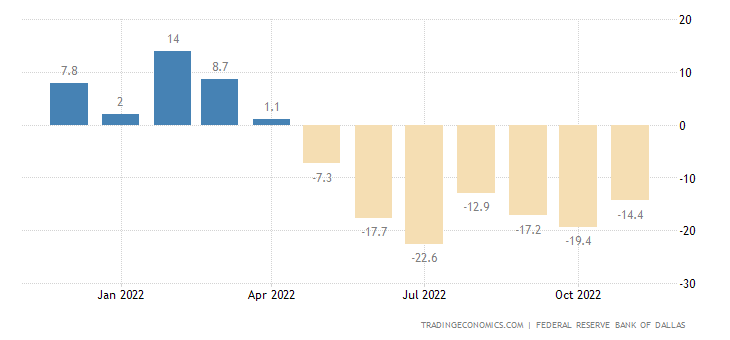
The index of manufacturing activity in the Texas Fed zone in the US has been in the red for 7 months in a row:
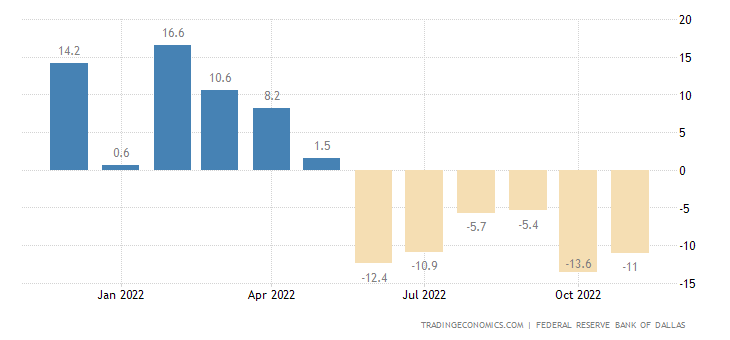
And in the service sector – 6 months in a row:
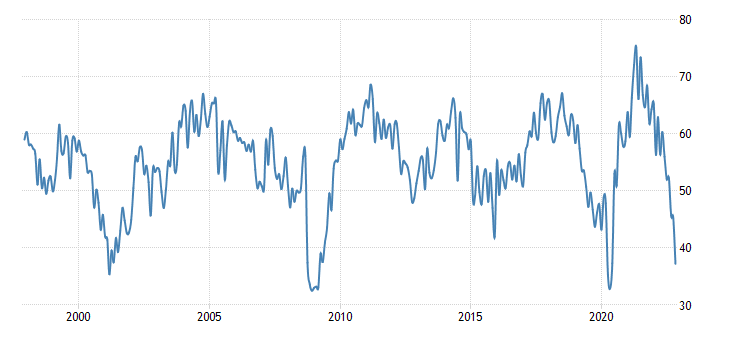
PMI Chicago in the zone of severe depression (37.2) – excluding the covid dip, this is the lowest since 2009:
The number of new buildings in Japan again went into the annual minus (-1.8% per year):
Building permits in Australia -6.0% m/m after -8.1% m/m:
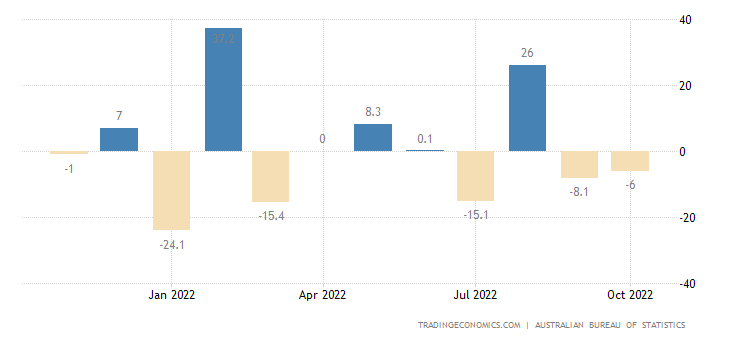
And -6.4% per year — the 13th negative in a row:
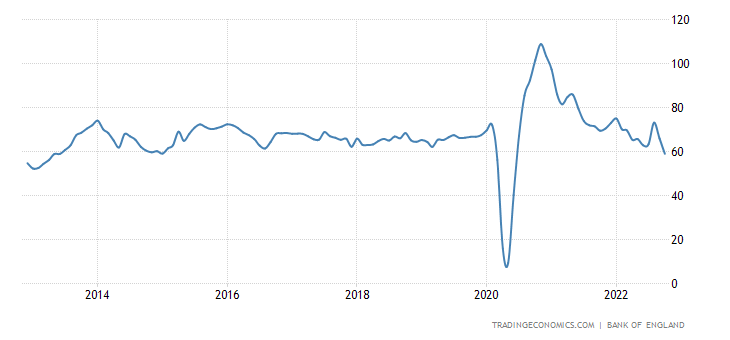
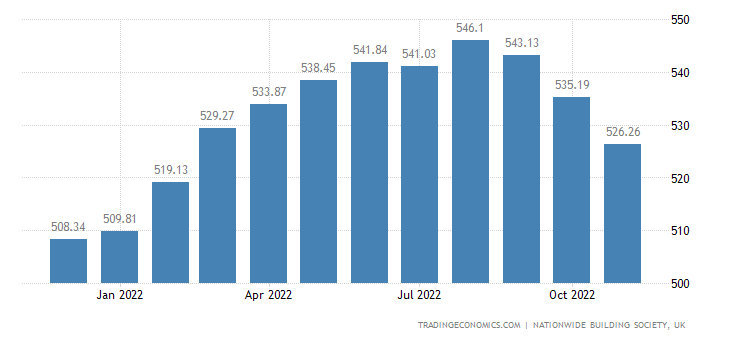
Approved mortgages in the UK at 8-year day (not counting the brief covid dip of 2020):
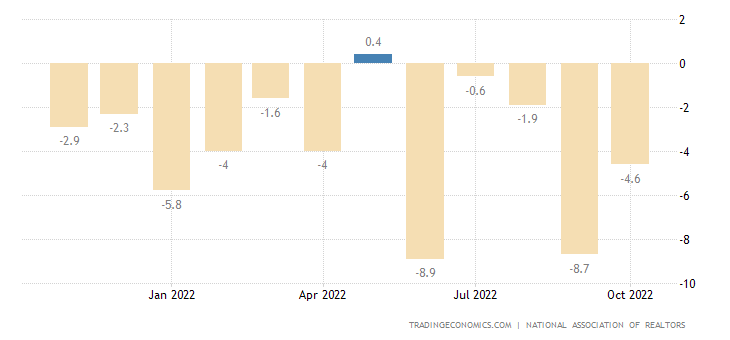
Pending sales of existing homes in the US -4.6% per month – the 11th minus for the last year:
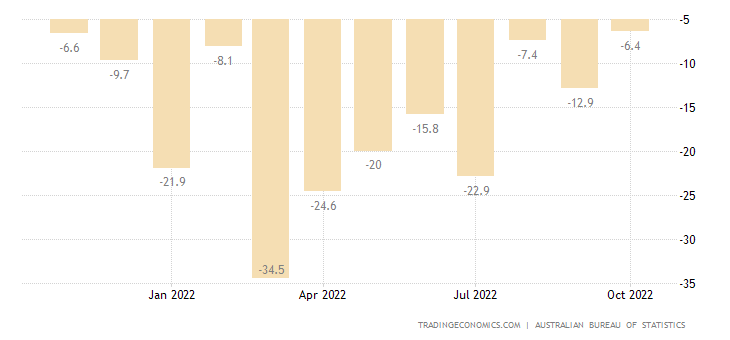
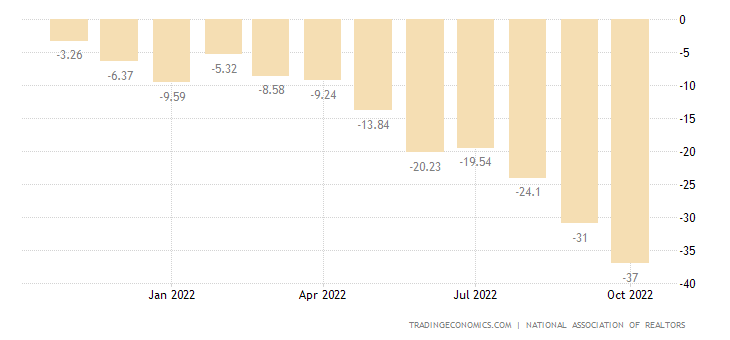
And -37.0% per year – a record drop:
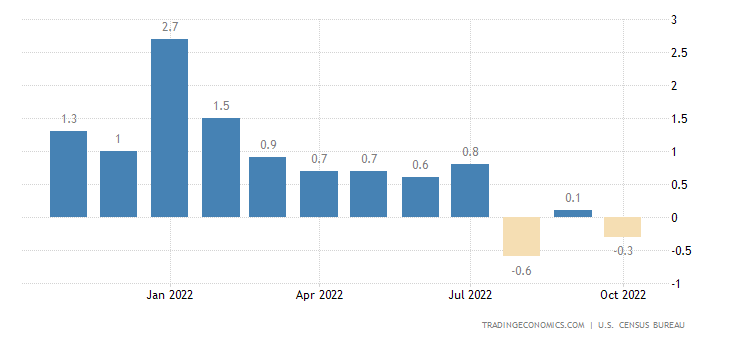
Construction spending in the US -0.3% per month – 2nd minus in the last 3 months:
House prices in the US -1.5% m/m after -1.6% earlier – the worst performance since 2009
A similar picture in Britain (-1.4% per month):
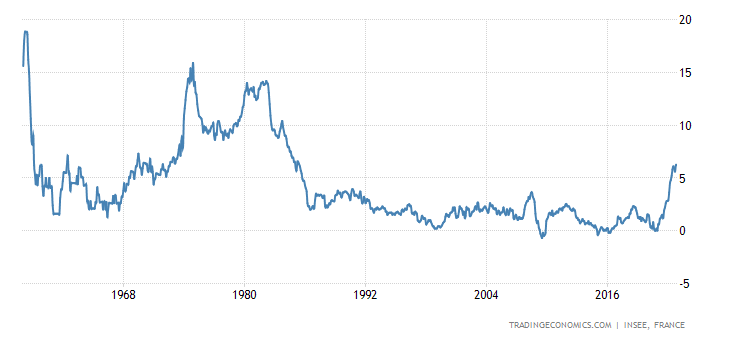
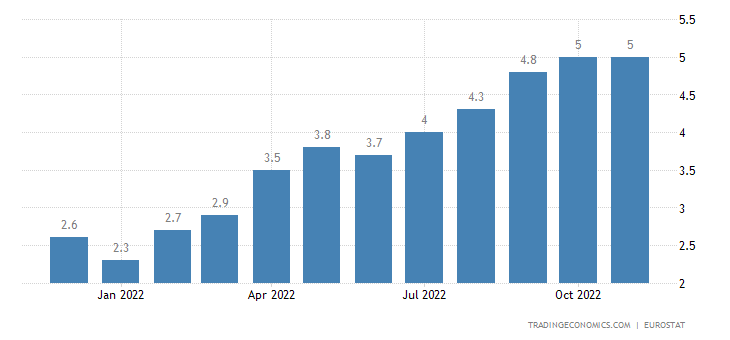
CPI (Consumer Inflation Index) of France remained at the level of a 37-year high (+6.2% per year):
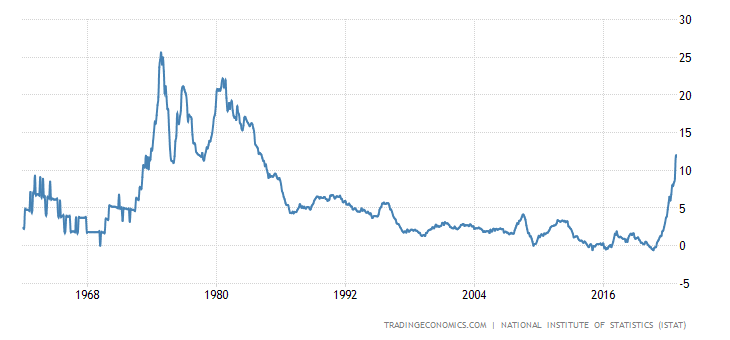
And the CPI of Italy is at a 38-year peak (+11.8% per year):
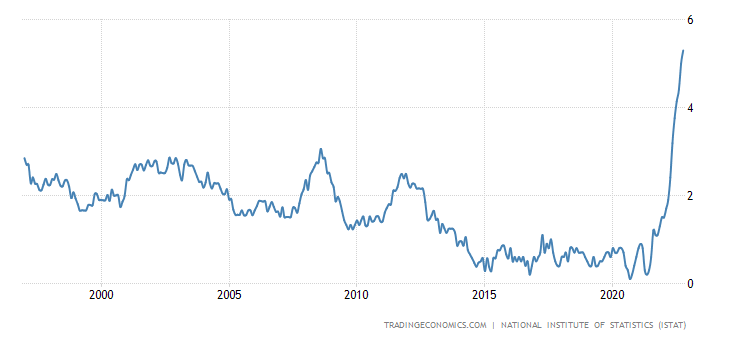
“Net” (excluding highly volatile components of food and fuel) Italy’s CPI is a record for 26 years of observations (+5.3% per year):
The same in the eurozone as a whole (+5.0% per year):
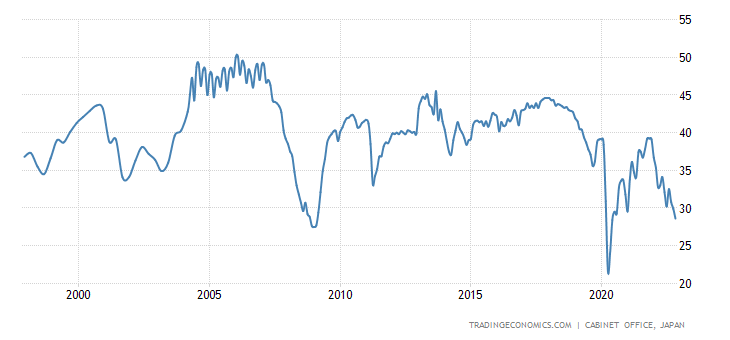
The mood of the Japanese is close to the record (not counting the brief dip in 2020) bottom of 2008:
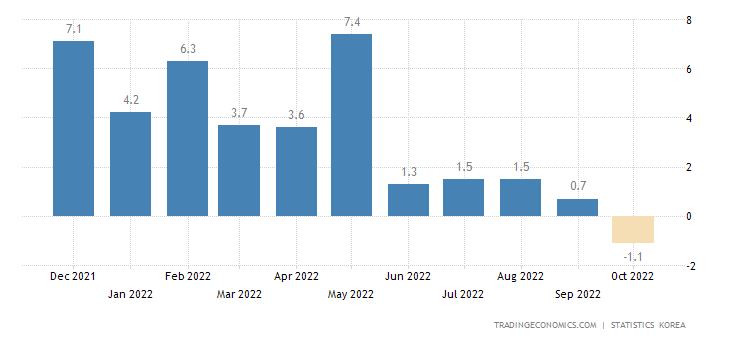
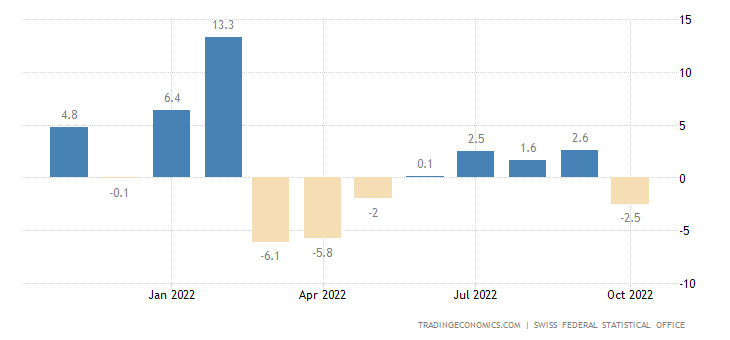
The volume of retail sales in South Korea -0.2% per month is the 10th minus for the last year:
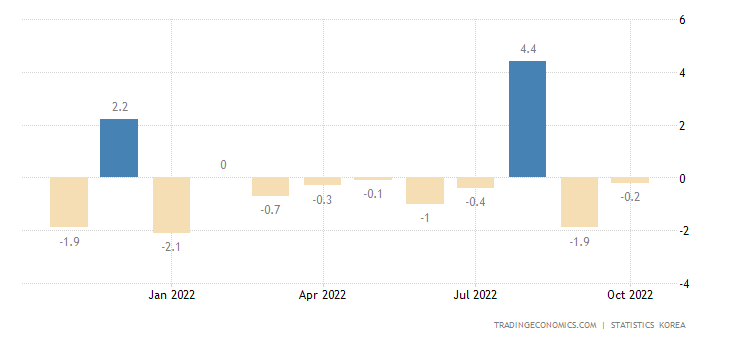
And -0.7% per year – the 3rd minus for the last 4 months:
Retail sales in Switzerland -2.7% per month:
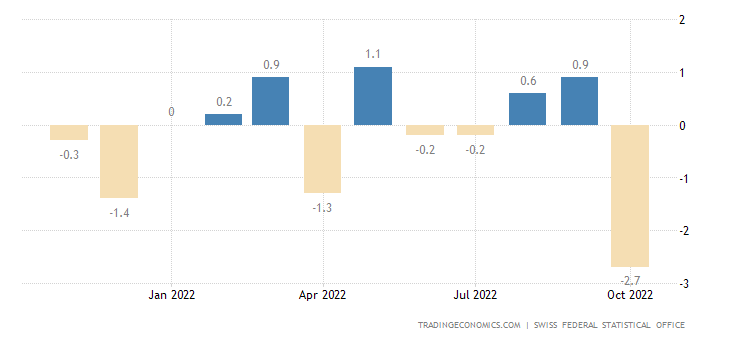
And -2.5% per year:
Retail Germany -2.8% per month:
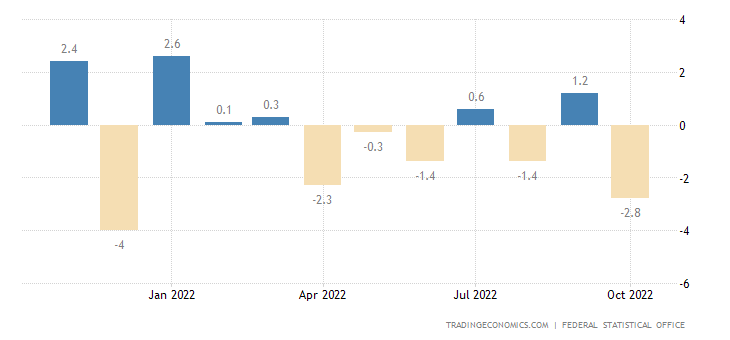
And -5.0% per year — the 6th negative in a row:
The balance of retail sales in Britain has sharply gone into the red:

French spending -2.8% per month – bottom in 1.5 years:
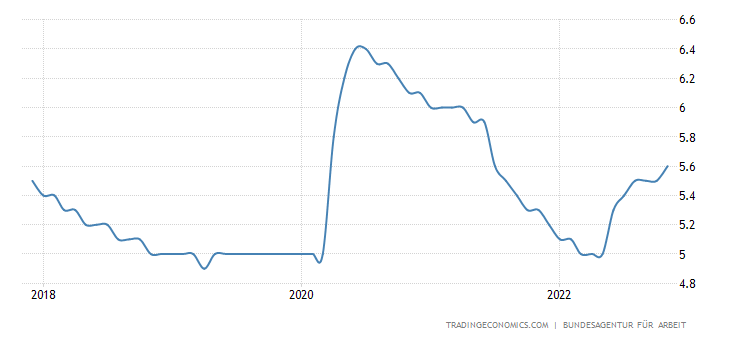
Unemployment in Germany rises for 6 months in a row:
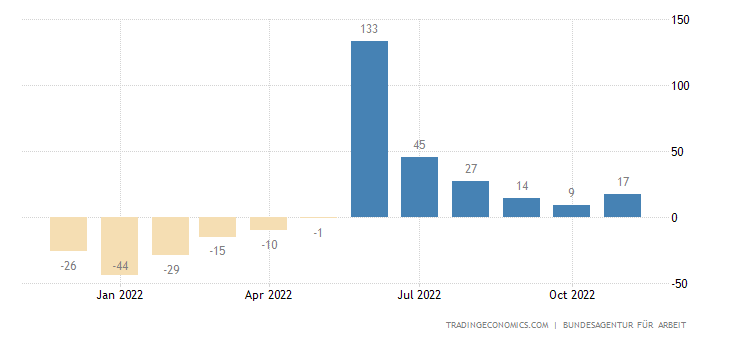
Why its level is at its peak in 16 months:
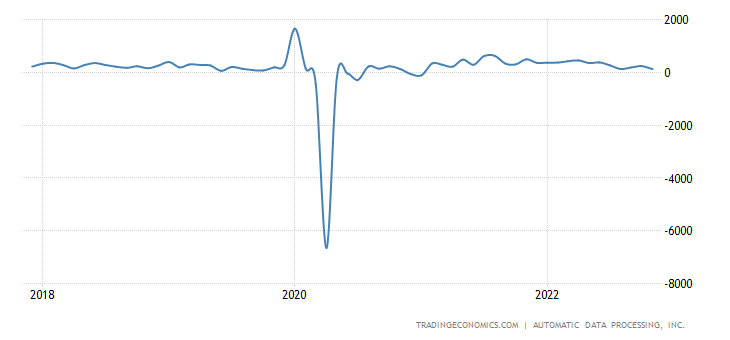
The number of jobs in the US private sector +127 thousand – the worst dynamics in almost 2 years:
The number of recipients of unemployment benefits in the United States for a maximum of 9 months:
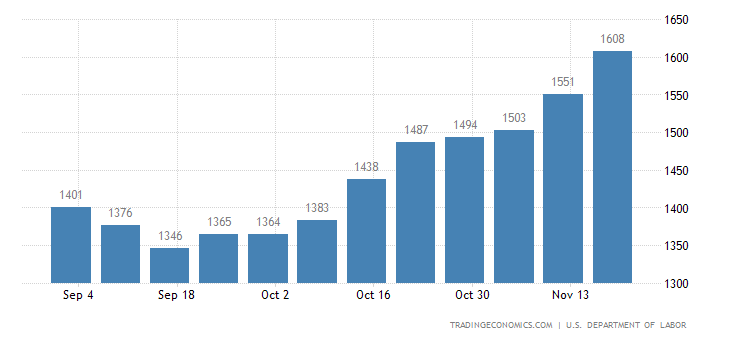
Like the unemployment rate:
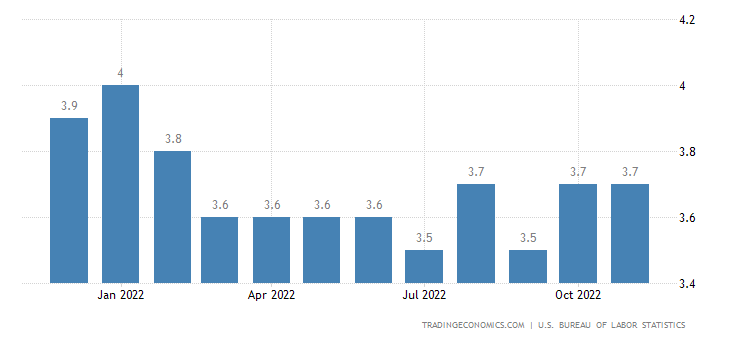
Announcements of future layoffs in the US at the peak of 2 years due to record high-tech numbers for 22 years of observations:
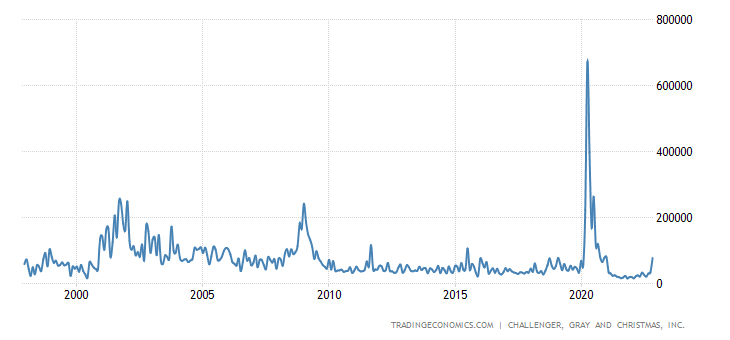
Let us immediately recall that the figures of labor statistics in the United States cannot be trusted at all, but, most likely, the general trend towards a deterioration in the state of affairs is taking place. Indirect confirmation: the duration of the last working week was 34.4 hours, while the previous value was 34.5. Employers are reducing the burden on staff.
Main conclusions. Macroeconomic data show a serious deterioration in the situation throughout the global economy. In the US, this is, first of all, data on construction and expert assessments of the state of the industry, but also labor statistics are suspicious; in the EU, data on sales and inflation. In China, industrial stagnation has clearly begun, not to say “recession”.
In such a situation, “squeezing the brakes” is extremely dangerous (see Pavel Ryabov’s data on the reduction of the money supply in the United States and the discussion in the first section of the Review):
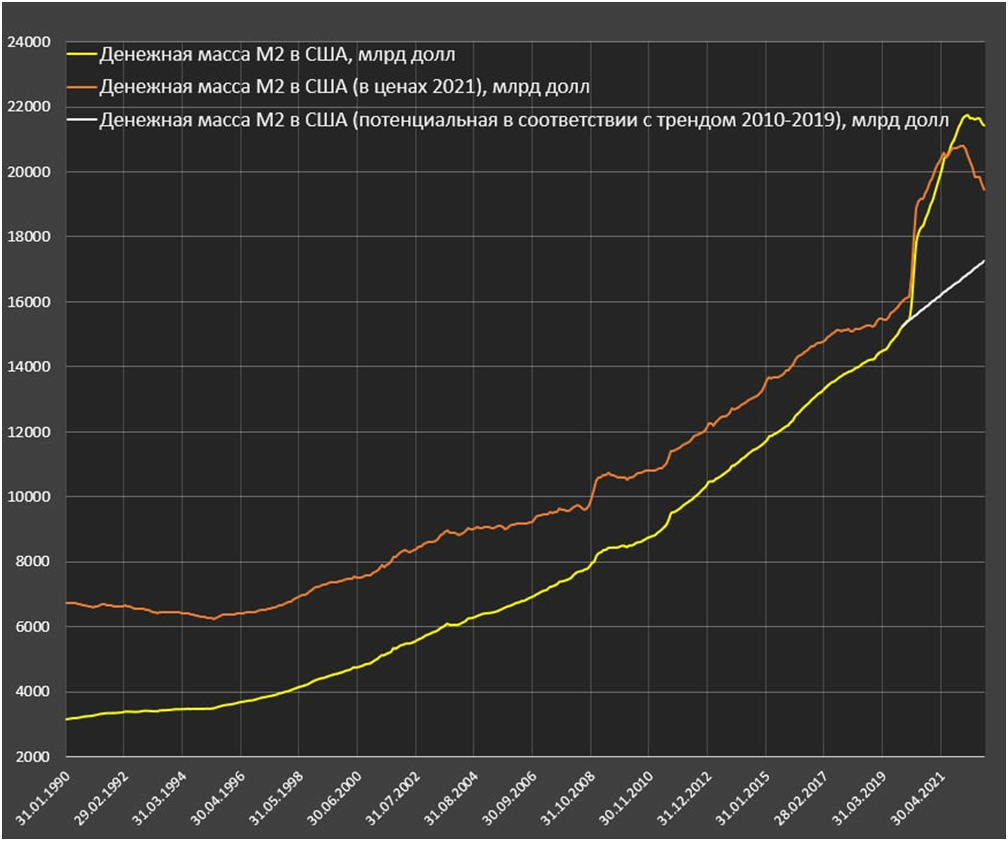
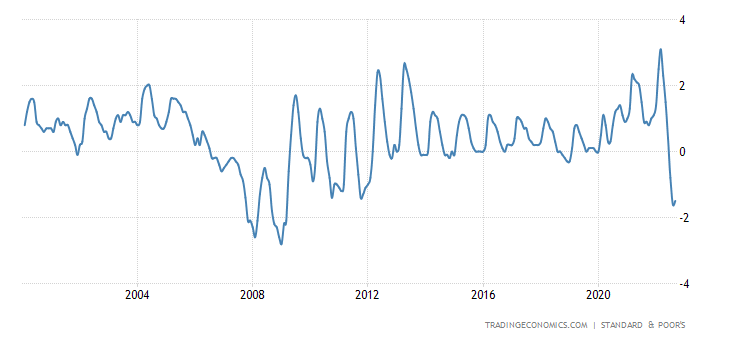
As an example of what the leaders of Germany may be afraid of, we can cite the data on the net negative percentage of the Fed. We will not even decipher the terms, those who wish can look on the Internet, the graph is important here, which shows how far this indicator has come off the long-term averages. This situation inevitably requires some kind of reaction, because it means that something is going completely wrong:
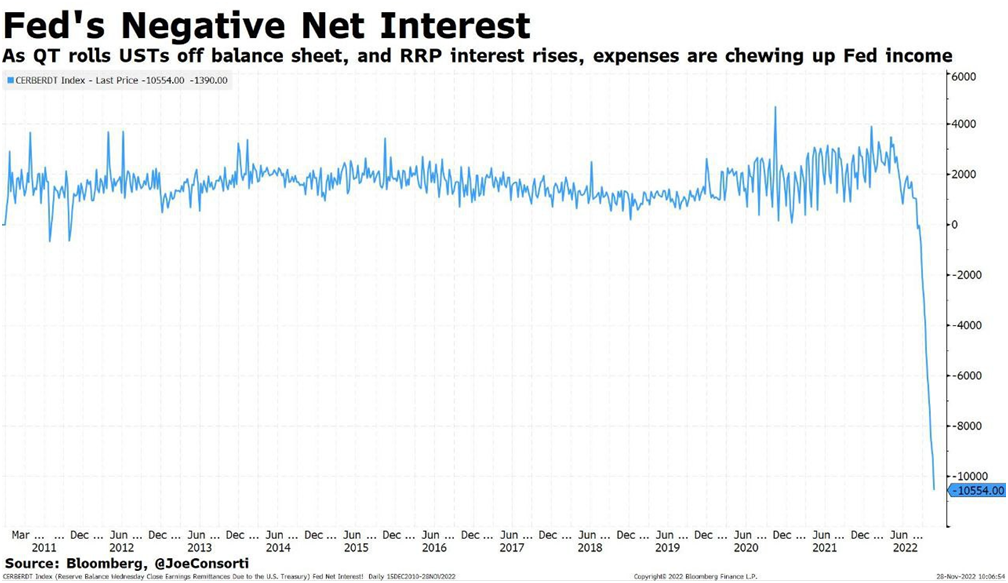
As a matter of fact, this chart just shows what the leaders of the US monetary authorities, whose problems we described in the first section of this Review, may be afraid of. The situation is clearly out of control and it is necessary not only to find the reasons (the most banal one is that the rate cannot be raised anymore!), but also to develop and implement a new model of monetary policy management!
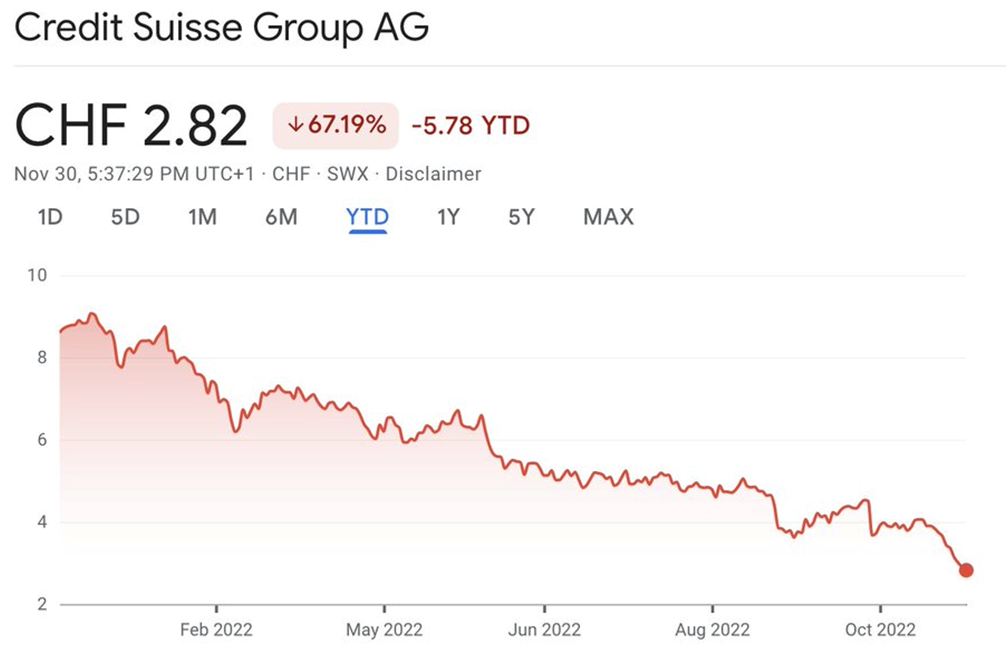
How to do this without a correct theory of the current crisis (which, we recall, we have, but which experts in the United States do not have) is not very clear, so some panic among the US monetary authorities is justified. Another thing is that the deterioration of the economy continues and for this reason it is necessary to act in any case. It is for this reason that there is reason to suspect that the leadership of the Fed may take drastic steps, especially since it is becoming more and more difficult to maintain various pre-bankrupt institutions:
It should be noted that entrepreneurs have less and less time to develop a plan to “get through the crisis”. We remind you that the Strategic Forecasting Agency «Kovcheg” associated with the Khazin Foundation ( https://strategic-ark.com /) just engaged in such work. So the readers of our reviews, if necessary, know where to turn. In the meantime, we wish them a pleasant weekend and a hassle-free working week!