
December 23-29, 2023
Big news. The last week of the year, which includes Catholic Christmas, offers virtually no hope for bright economic events. It passed more or less quietly, nothing new, in general, happened and, perhaps, this is the last quiet week before the start of the turbulent events of the new, leap year.
Macroeconomics. The Richmond Fed’s manufacturing supply index, excluding the failure of 2020, repeated its 14-year low:
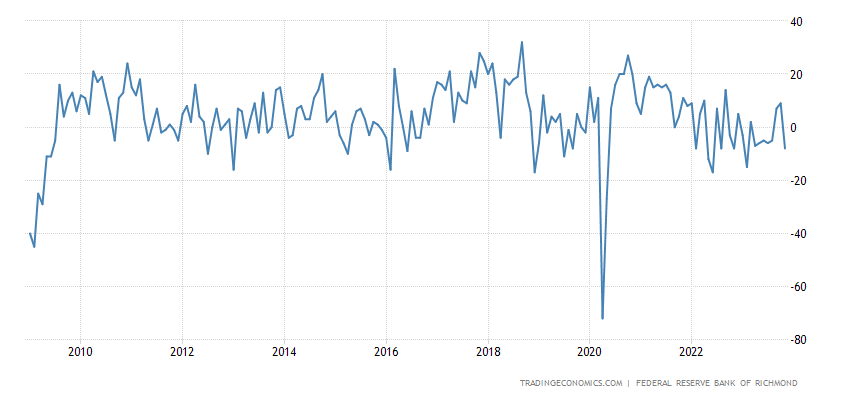
Рис. 1
The index of industrial activity in the Texas Fed zone has been in the red for 20 months in a row:
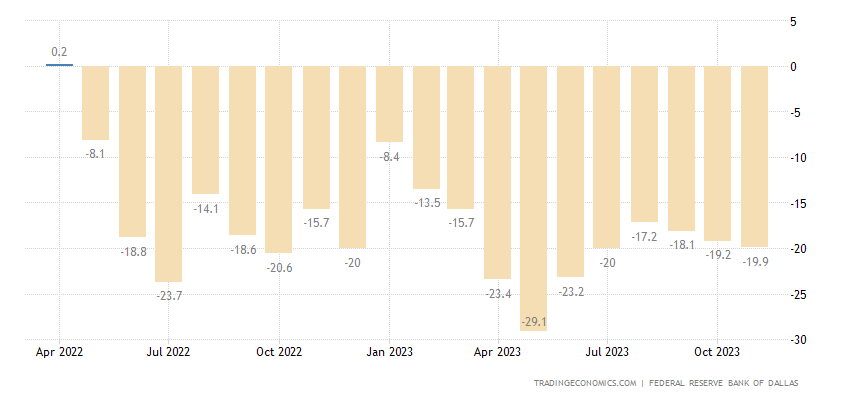
Рис. 2
And the indicator for the service sector in the same region is 19 months in a row:
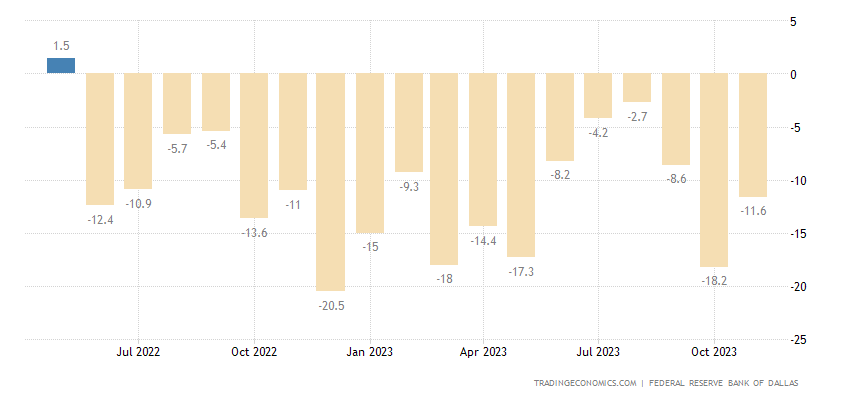
Рис. 3
Let us remind you that this is Texas, where industrial and innovative enterprises are fleeing from California.
Pending sales of existing homes in the US -5.2% per year, 30th monthly minus in a row:
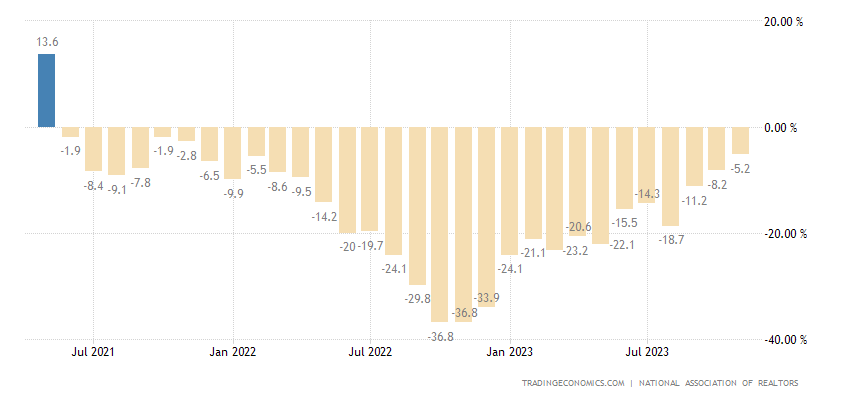
Рис. 4
New buildings in Japan -8.5% per year, twice worse than expected and the 6th minus in a row:
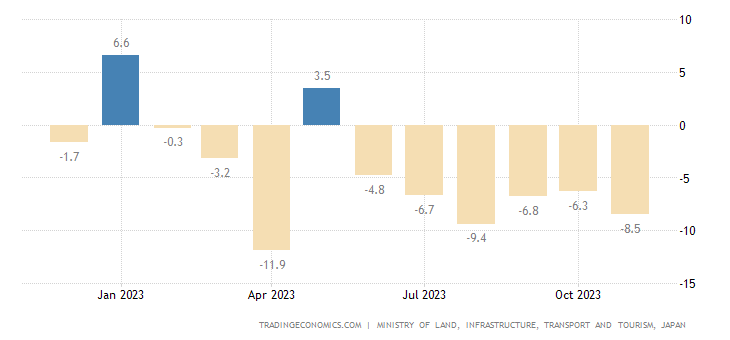
Рис. 5
Deposit growth in India +14.0% per year, maximum since spring 2017:
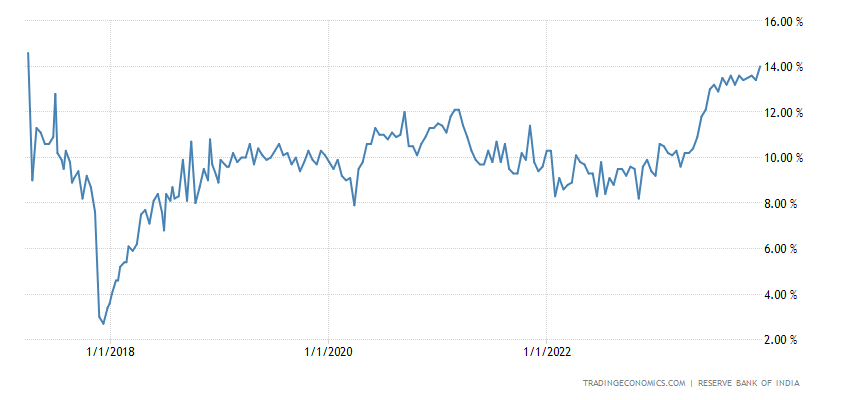
Рис. 6
The volume of retail sales in Norway is -1.5% per year, the 29th minus in a row, this has not happened in the history of observations:
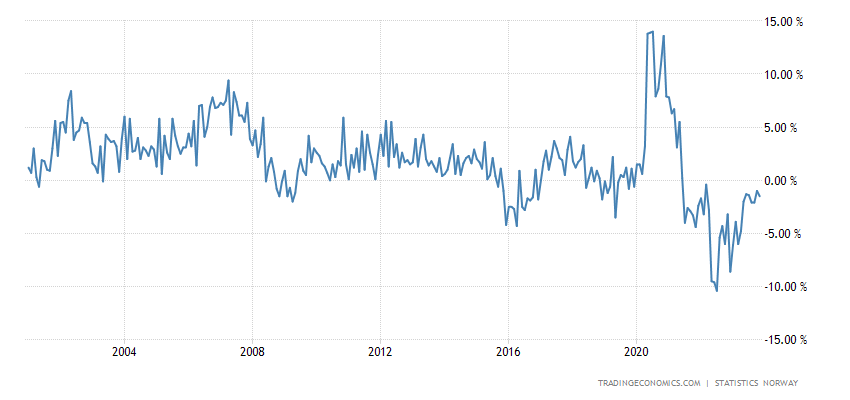
Рис. 7
Main conclusions. Let us repeat once again that it is a classic picture of a structural crisis which is taking place in the world. The recession seems to be small, but, unlike the situation of a cyclical crisis, it does not stop at all, the crisis continues and continues. And this process, which began in the United States in early autumn 2021, will continue around the world for quite a long time.
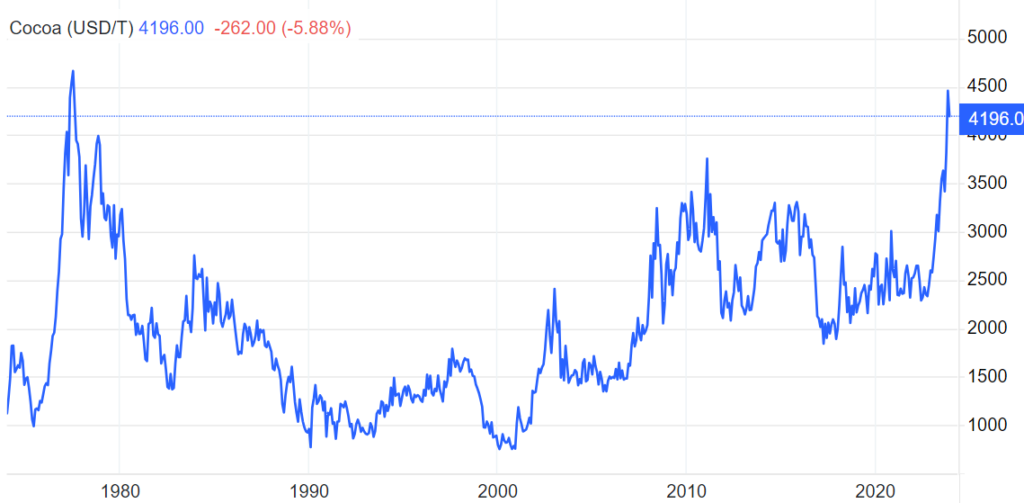
At the same time, according to a number of indicators, there is nothing similar to a “recession”. Cocoa is holding near 46-year-old peaks, but here, however, one can refer to the poor harvest in Africa:
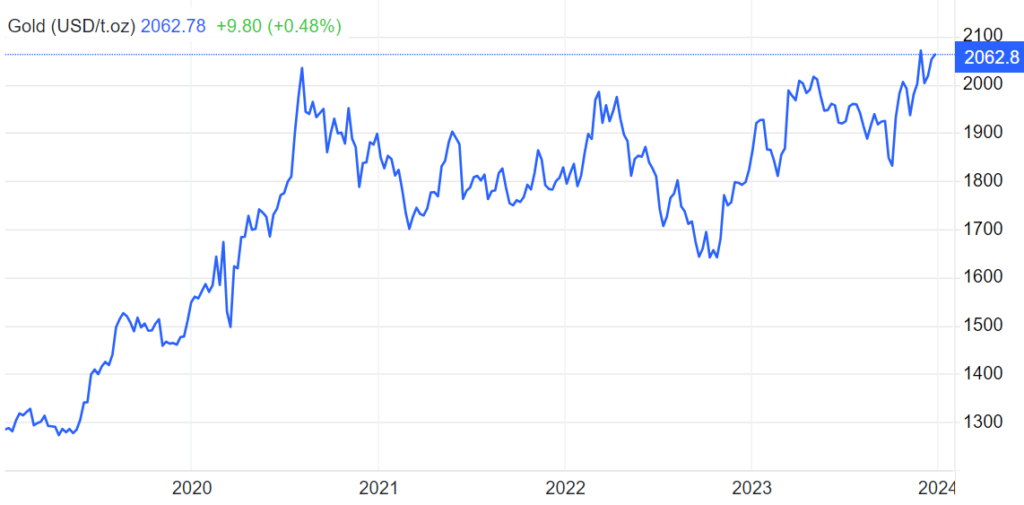
Gold, which is so disliked by the monetary authorities of all countries, is growing:
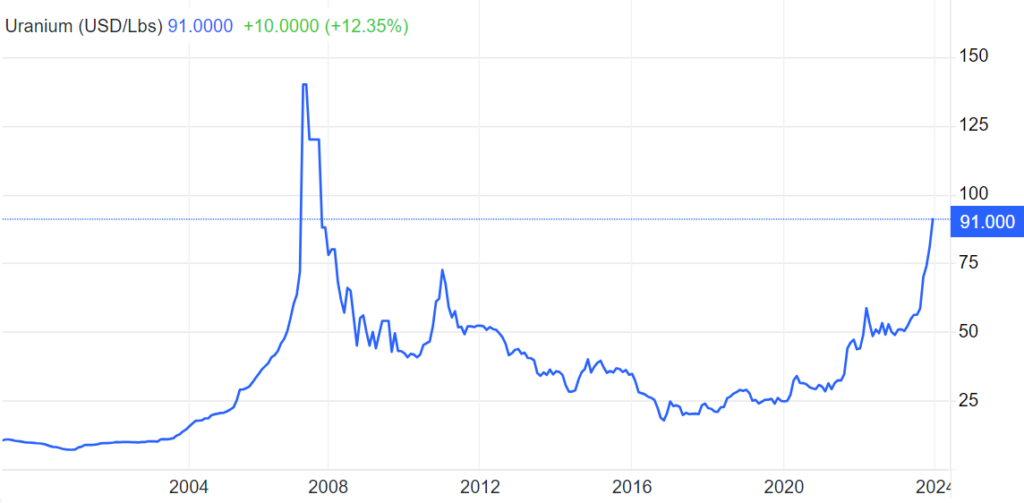
The energy crisis and the already understood inevitability of growing demand for nuclear energy sent uranium prices to 16-year highs:
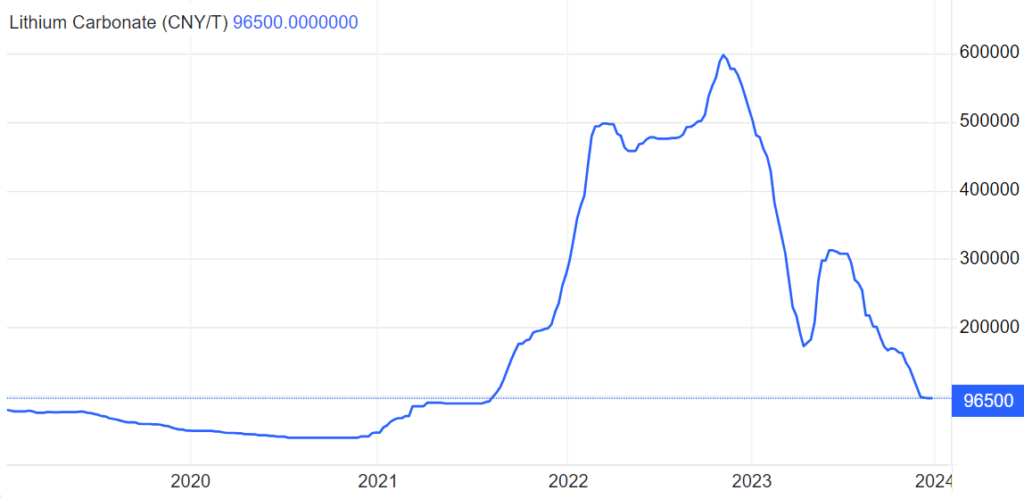
But the demand for electric cars is falling, which is why lithium prices have fallen to Covid lows:
In general, this is a typical picture of a structural crisis, when the old models of certain markets are destroyed and their trends end. I don’t want to say at all that the age of electric vehicles is over before it has even really begun, but it is almost obvious that relevant questions have arisen. In a crisis, creating a new industrial infrastructure for recycling batteries is quite difficult. So with some probability we will have to return to internal combustion engines.
And such stories arise in almost all industries; a new industrial resolution faces objective demand restrictions. And if we also take into account the need to practically restore the entire basic infrastructure of the world economy, then the issue becomes even more acute.
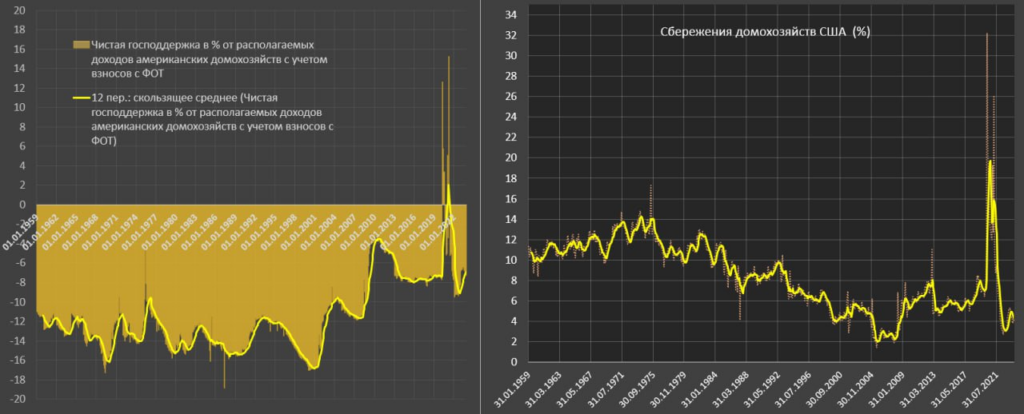
As we often do, we will add Pavel Ryabov’s analysis of one of the important parameters characterizing the American economy, household savings. It is today near the historical minimum – 4.1% in November 2023.
Those who have read The Decline of the Dollar Empire and the End of the Pax Americana or Memories of the Future may note that there were different numbers. We remind you that since these books were written, the statistical methodology has changed several times, so it is impossible to compare those figures with new ones. But within the framework of the new statistics, we have historical minimum indicators.
“The decline in savings is due to faster growth in expenses compared to income. Over the past 6 months, the savings rate has averaged 4.3%. for 12m – 4.5% compared to 7.4% in 2019 and 6.5% from 2017 to 2019.
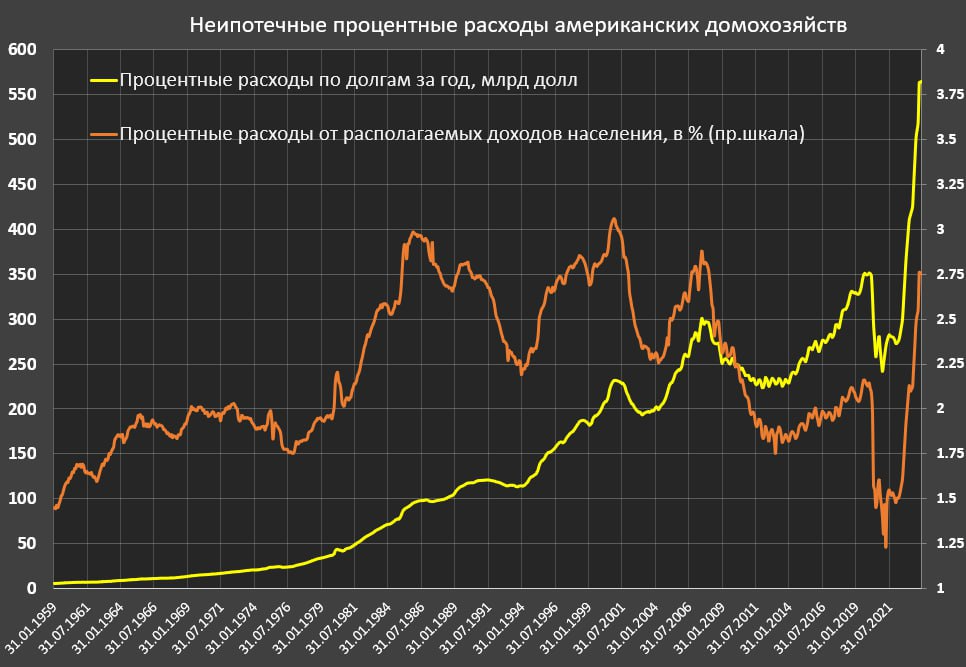
In addition to the inadequate gluttony of Americans (unfunded expenses), interest expenses have a negative impact. So non-mortgage interest is 2.75% (the maximum level since January 2008), for 6 months – 2.6%, for 12 months – 2.4% vs 2.1% in 2019 and a similar level from 2017 to 2019.
If we compare the indicators in November, in the structure of the decline in savings, non-mortgage interest expenses had a negative impact at the level of 0.6 percentage points.
It is important to note that savings have a direct impact on the net distribution capacity of financial assets, which can be allocated to cash assets, stocks, bonds, insurance or pension reserves.
The annual average level of savings is 900 billion, and is now approaching 800 billion. Households were the main providers of liquidity to the bond market, saving the Treasury market.
The liquidity gap is about 1.6-1.7 trillion per year (the rest is covered by pensions, insurance, state funds and direct strategic allies of the United States). Obviously, with savings of 0.8 trillion a year you won’t be able to do much, and yet the biggest bubble in the stock market in a century still needs to be maintained.
What else is interesting here? Net government support as a percentage of disposable income is approximately at the level of 2016-2019. This is the volume of state distribution in favor of the population for all types of targeted state programs minus the volume of withdrawals from the population in favor of all taxes on individuals. A minus means that more is withdrawn than distributed. This allows us to evaluate the measure of incentive support relative to the population.
Net government support is not stimulating, and with a budget deficit of 2 trillion a year, what does this mean? In the event of a crisis, there is NO resource to support the population!”
Actually, this last statement is the most important. Pavel Ryabov writes “in the event of…”, we clain that the crisis will definitely continue. And this means that there will either be an easing of monetary policy (which has actually already been announced) with almost inevitable emissions, or a direct deflationary drop in the standard of living of the population. Since this is almost impossible to imagine in an election year, this means that the dollar issue will be resumed several months before the elections. The timing will be chosen so that the inevitable inflationary wave begins after the elections.
To this we can add another graph, the growth of interest expenses of American households:
Pavel Ryabov comments on it this way: “Fiscal consolidation for the “elect” is excluded; on the contrary, they spend like crazy (the US budget deficit is at its maximum).
What remains is debt monetization through QE and lower servicing costs. This is where the problems lie.
The strong inflationary background and fears of a recurrence of problems in 2022, plus unresolved balance sheet problems due to an overdose of liquidity in 2020-2021, are not allowed to rummage on an unlimited scale. At the same time, high rates are accelerating the cost of debt servicing into the stratosphere.
On the other hand, it is the overdose of liquidity in the phase of monetary frenzy 2020-2021 that is the key and basis for the stability of the system in 2023, when liquidity gaps are compensated by the accumulated stability buffer from 2009 to 2021.
By March, excess liquidity in the US banking system will be depleted; sooner or later the printing press will have to be turned on, otherwise there will be no one to buy back the 2 trillion deficit per year.”
We have already explained this several times in a slightly different context: today support for private demand comes through the budget, against the backdrop of a restrictive monetary policy (the Federal Reserve is reducing its balance sheet, that is, reducing the amount of cash in the economy). The budget receives money by increasing the public debt, but against the backdrop of the need to service the debts accumulated throughout the economy, the resource accumulated in the financial system is running out, which is what Ryabov writes about.
But then, by the end of spring 2024, it will be necessary to begin issuing. There will still be about six months left before the elections, which is a long time, but if we extend the situation until the beginning of summer, then we can count on the fact that inflation will not yet begin by the elections. Therefore, we can make the assumption that in May-June the Fed will begin to actively reduce the rate and adopt new issuance programs. However, the forecast for next year is in the first review for 2024.
And we wish all our readers happy holidays and hope that in the new year you will celebrate the weekend by reading the new Review of the Khazin Foundation!
Happy New Year!