Big news. The failure of the G20 ministerial meeting. Yes, formally, it was not an economic meeting, but a meeting of foreign ministers, but the G20 was created in 2009 as an anti-crisis association. Today, everyone has forgotten about this, only politics is being discussed, and in an extremely narrow aspect, who will condemn Russia and who will not.
Moreover, China’s “12 theses” on the situation in Ukraine are an obvious claim to enter world politics at the level of a “great power”, and it is for this reason that the United States soared. But the point here is that the “unipolar world” is in reality the world of the Bretton Woods system, a world in which the economy is defined within the framework of the dollar system. If the US cannot respond to either Putin (see previous Review) or China, it really means that they do not see the future of this system.
Moreover, the only alternative plan for the United States, legalized in the political field of this country, today is the industrialization of AUKUS. But any industrialization within the framework of the Bretton Woods system is impossible, since the immanent property of this system is the higher profitability of the financial sector compared to the industrial sector. Consequence: in order to implement this plan (and I remind you that there is no other one), it is necessary to destroy B.-V. system.
We have already partially discussed some of the consequences of this scenario, in particular, the destruction of the property legitimization system. And we have no desire to frighten anyone – we simply evaluate the obvious conclusions from the current situation. Theoretically, one can try to save B.-V. system (however, it is not very clear how), you can try to come up with an alternative plan for the industrialization of AUKUS. But so far, such options are not visible.
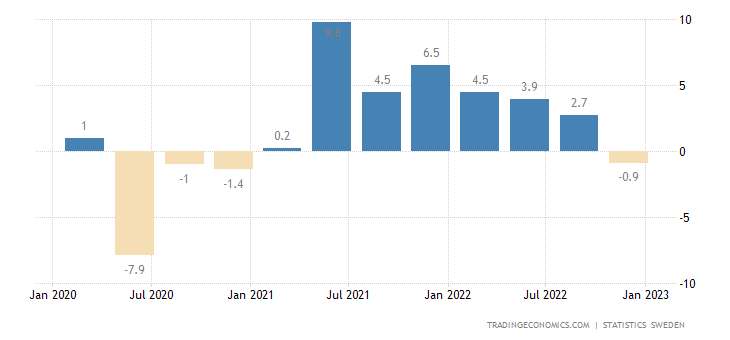
Macroeconomics. Swedish GDP -0.9% per quarter (last quarter of 2022) – excluding the covid failure of 2020, this is the bottom in 10 years:
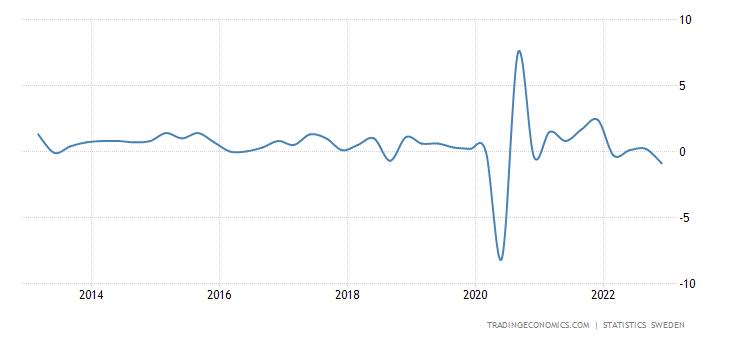
And -0.9% per year – the 1st decline in 2 years:
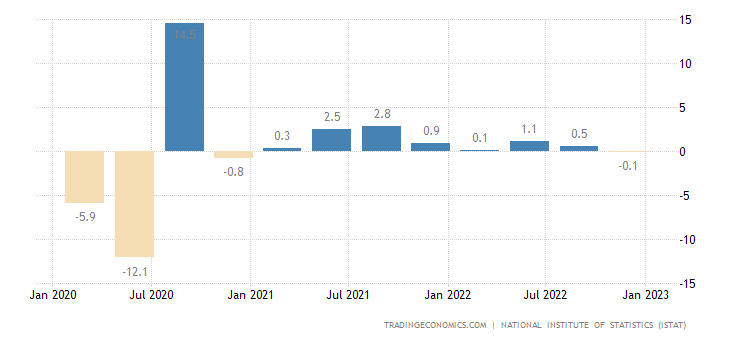
Italian GDP -0.1% per quarter:
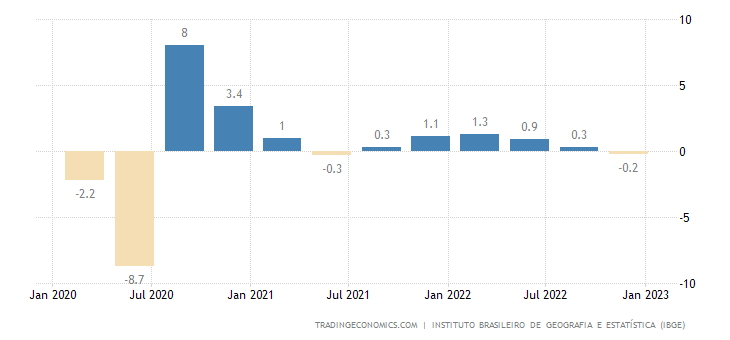
ВВП Бразилии -0.2% в квартал:
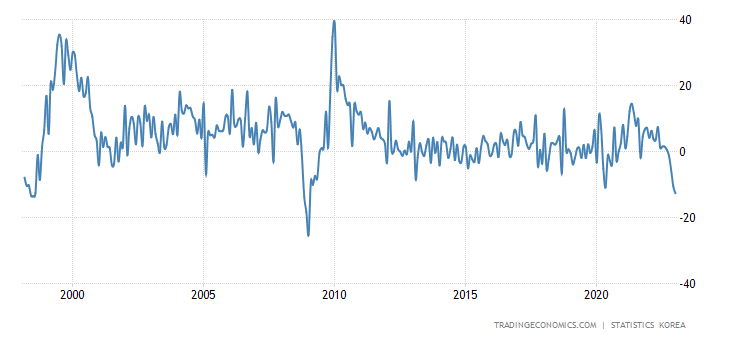
South Korean industrial output -12.7% per year – the worst dynamics in 14 years:
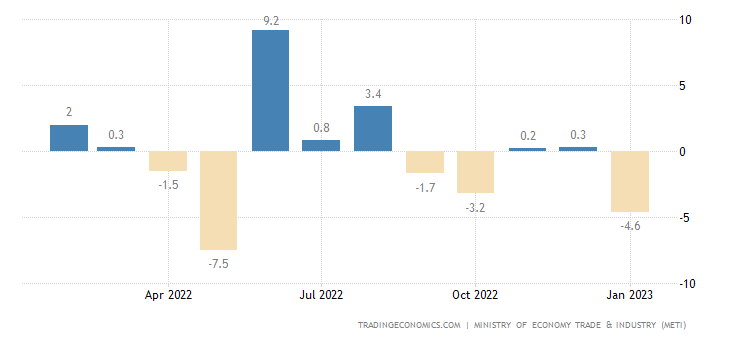
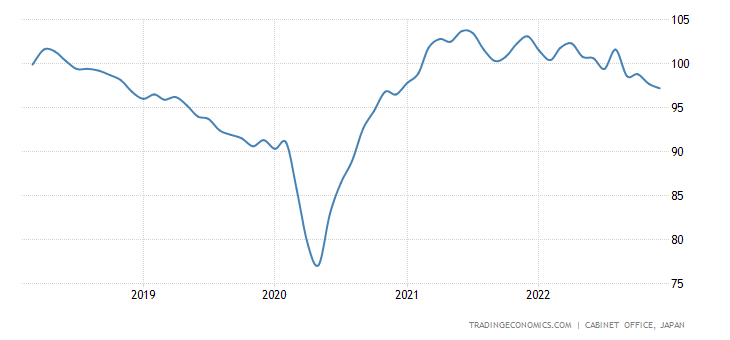
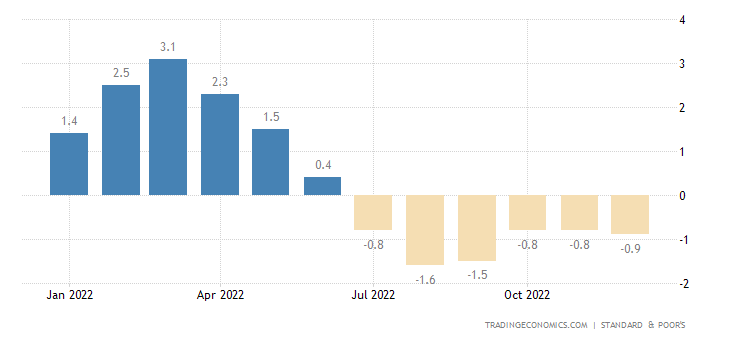
Industrial production in Japan -4.6% per month:
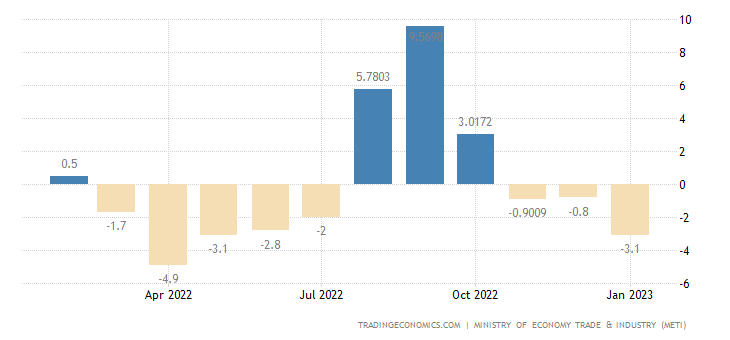
And -3.1% per year — the 3rd negative in a row:
US Durable Goods Orders -4.5% per month – Lowest in almost 3 years:
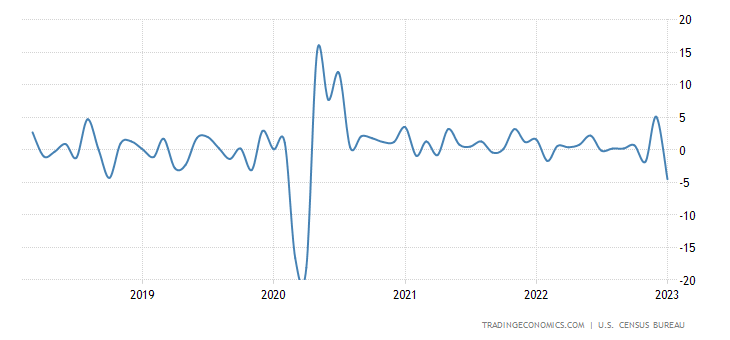
This is a consequence of the rate increase, and if the increase continues, then the US industry will fall even more. And if the rate is not raised, then inflation will rise …
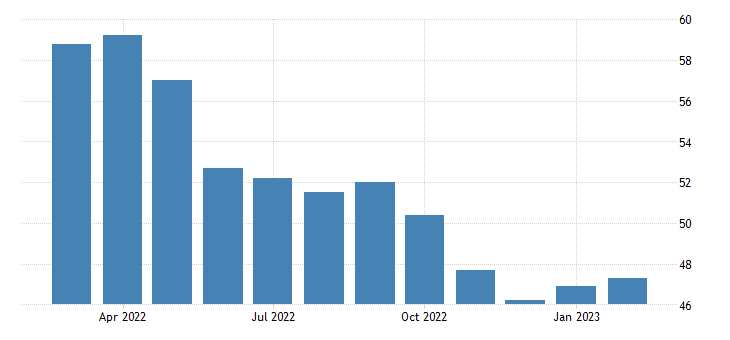
PMI (expert index of the state of the industry; its value below 50 means stagnation and recession) of the eurozone (48.5) has been in the recession zone for 8 months in a row:
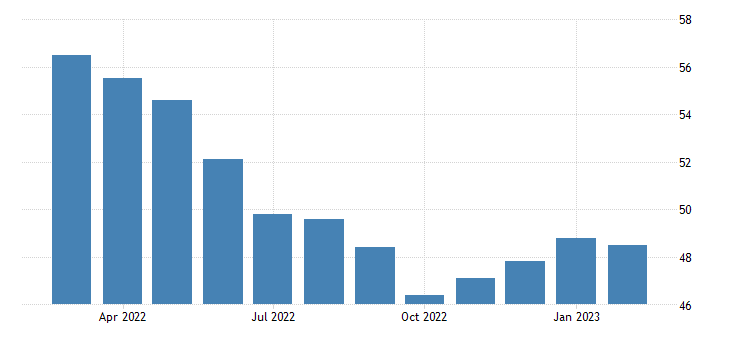
Note that, in fact, from the moment they began to tighten monetary policy …
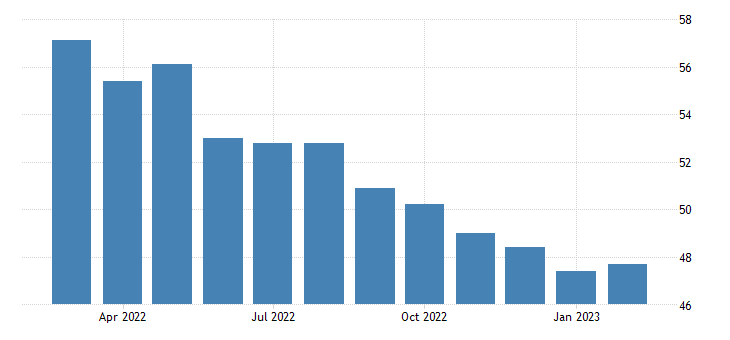
Exactly the same in South Korea:
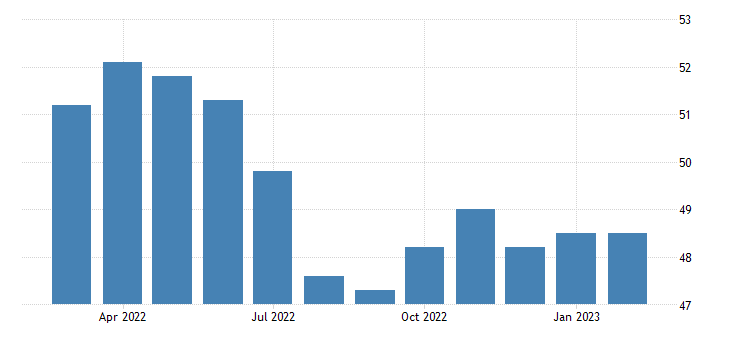
In Britain (49.3) – 7 months:
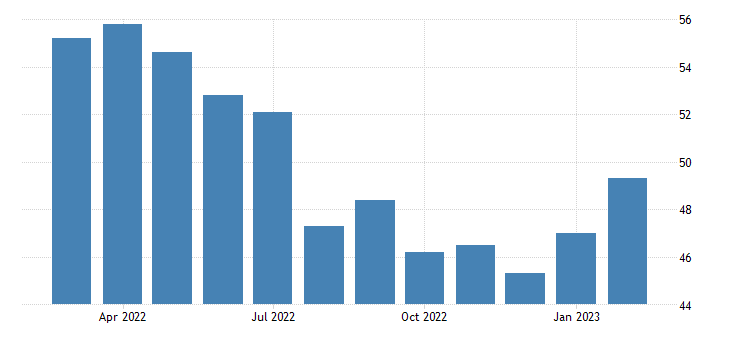
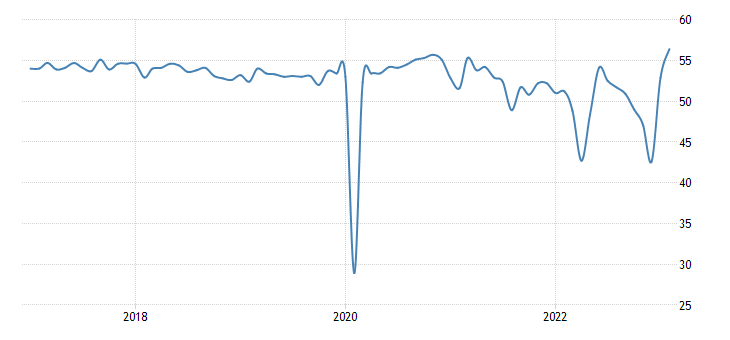
In the USA (47.3) – 4 months:
According to another version, the same (47.4):
But in China, according to official data, an 11-year maximum:
And in the service sector of India, even a 12-year-old:
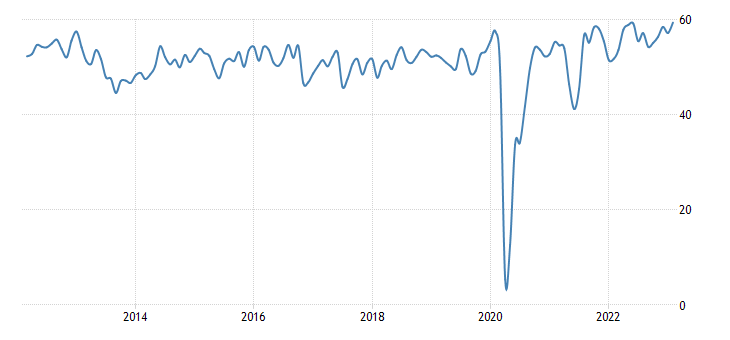
Bubble inflating? We will monitor the situation.
Chicago PMI (43.6) has been in the downtrend zone for 6 months in a row:
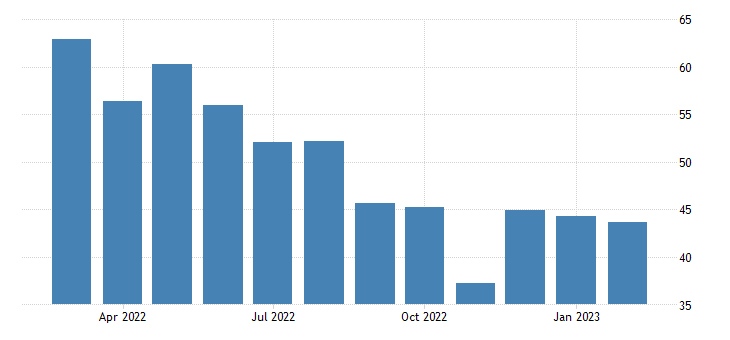
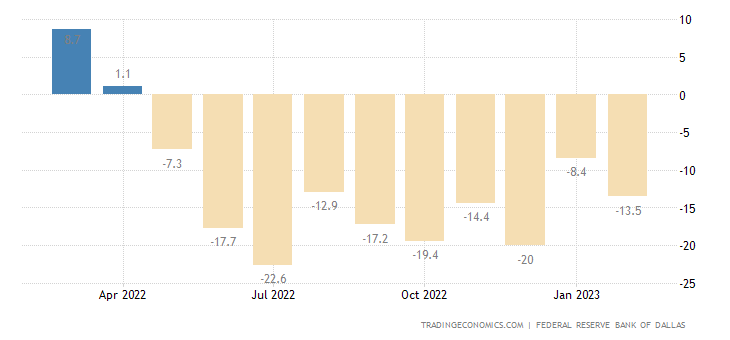
Manufacturing activity in the Texas Fed zone has been declining for 10 consecutive months:
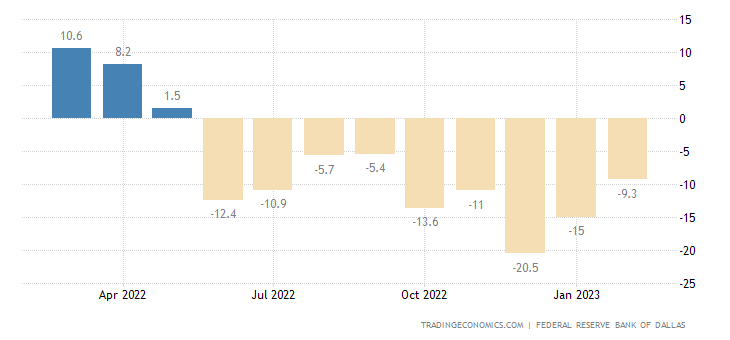
And the service sector of the same zone – 9 months in a row:
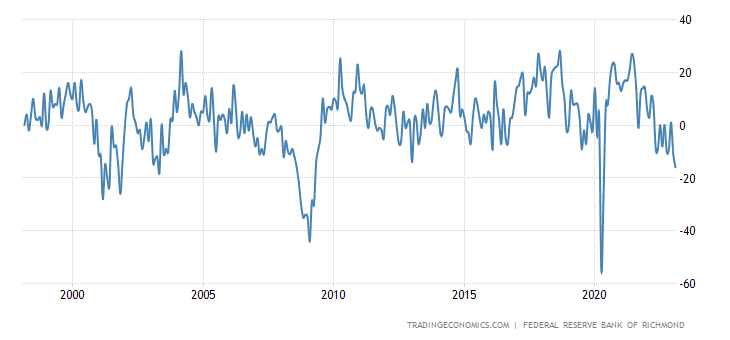
Industry in the Richmond Fed zone is falling at the worst pace since 2009 (excluding the failure of 2020):
Japanese leading indicators at 2-year bottom:
Turkey’s trade deficit is the highest in 71 years of statistics:
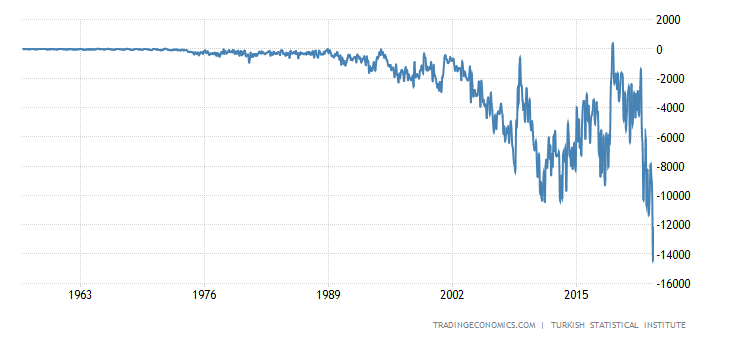
An extremely dangerous situation for an export-oriented economy.
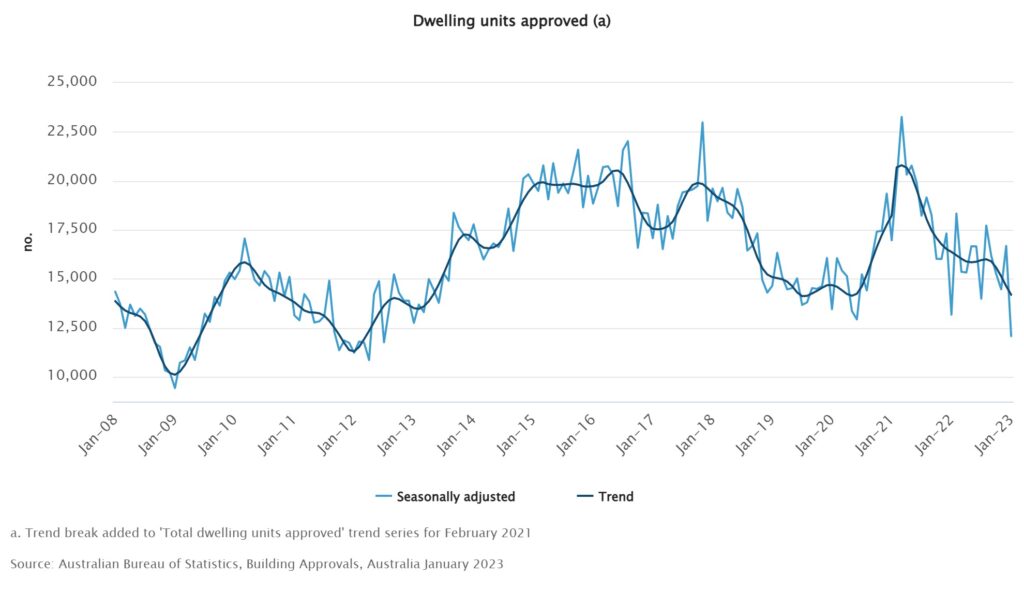
Building permits in Australia -27.6% per month – a record decline in 40 years of observations:
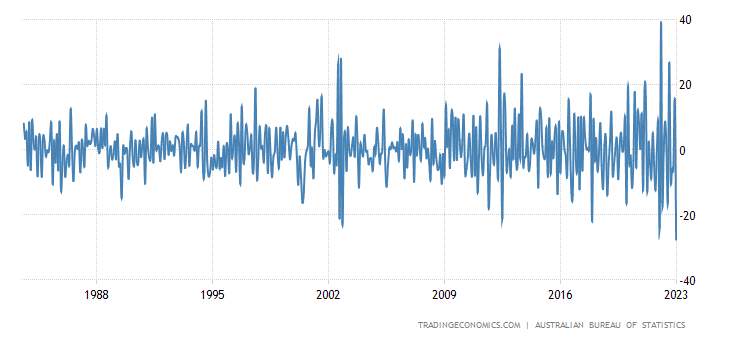
At the same time, their very value has broken through the covid bottoms of 2020 and gone to the levels of 2008/12:
Mortgage loans in Australia -35% per year, declining monthly for 8 months in a row:
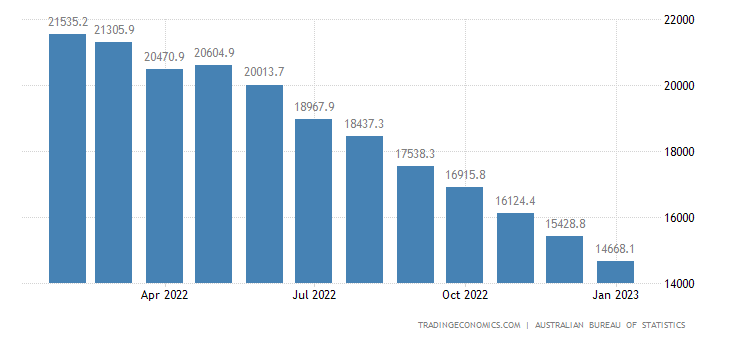
And investment mortgage loans – 10 months in a row:
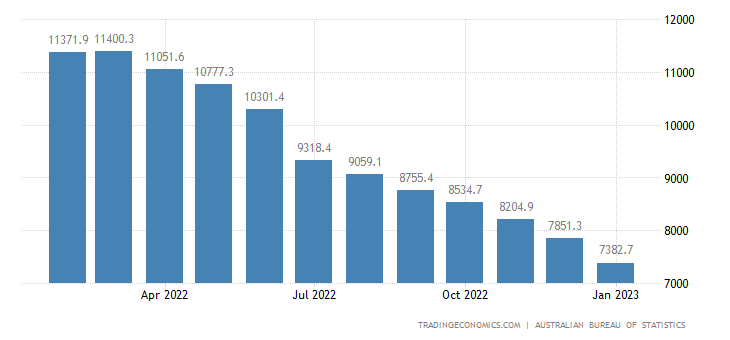
I remind you that Australia is one of the members of the AUKUS.
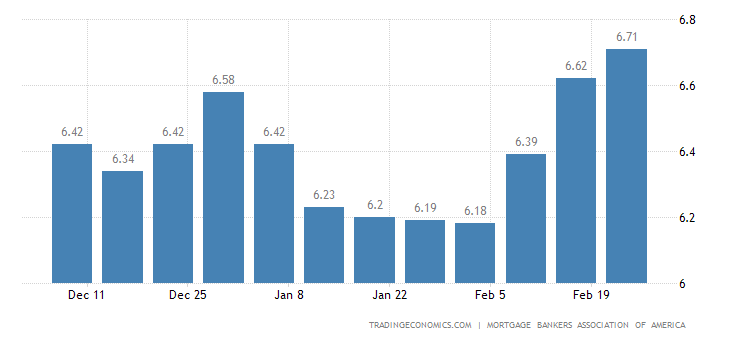
Mortgage applications in the US fell another 5.7% weekly:
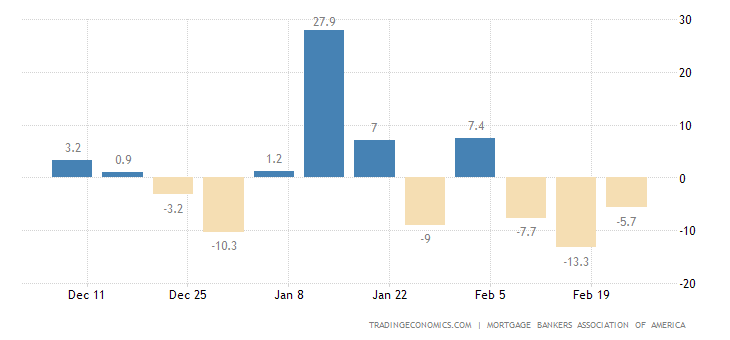
Why the index of loans for purchase (not refinancing) updated the 28-year low:
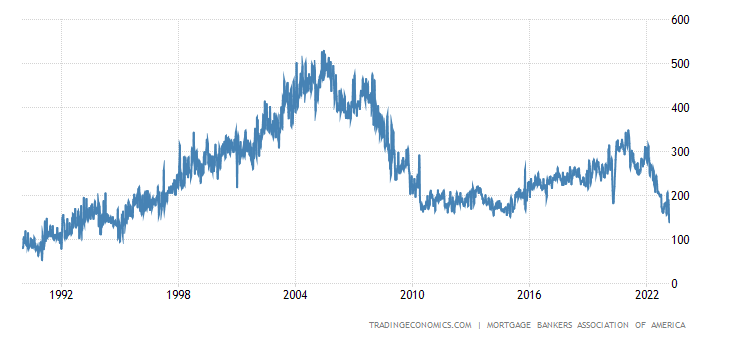
And this despite the fact that the borrowing rate is still clearly below the peaks of 2022:
US housing prices from S&P / Case-Shiller -0.9% per month – 6th negative in a row:
And +4.6% per year – the weakest growth in 2.5 years, the chart repeats the dynamics of 2006/09:
The same question, will we continue to raise the rate?
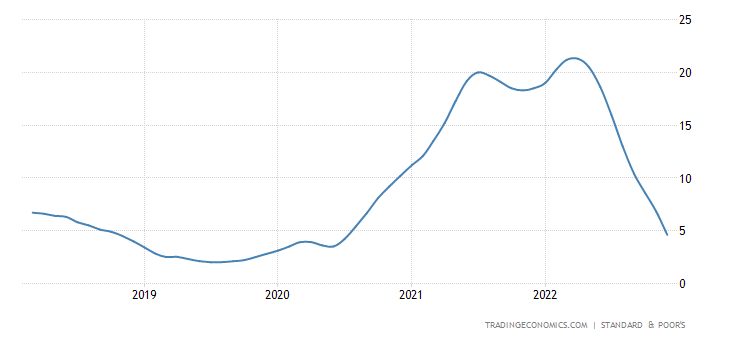
Eurozone net CPI +5.6% per year – a record for all 32 years of observations:
The price of food in the region is also growing at a record high rate (+16.3% per year) –
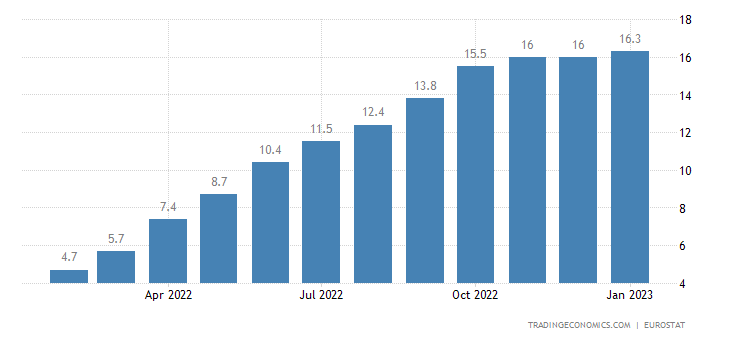
Inflation data, again, like a year ago, we are looking at new records.
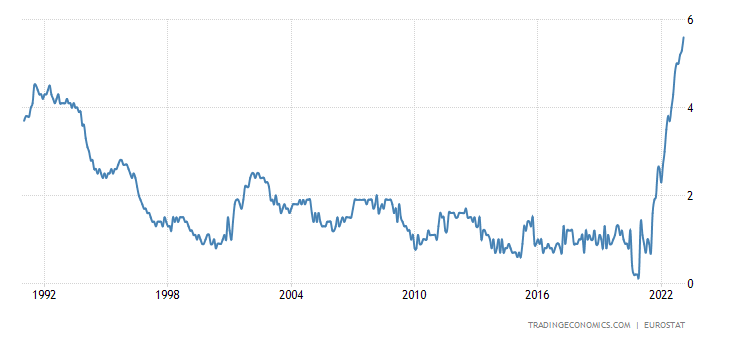
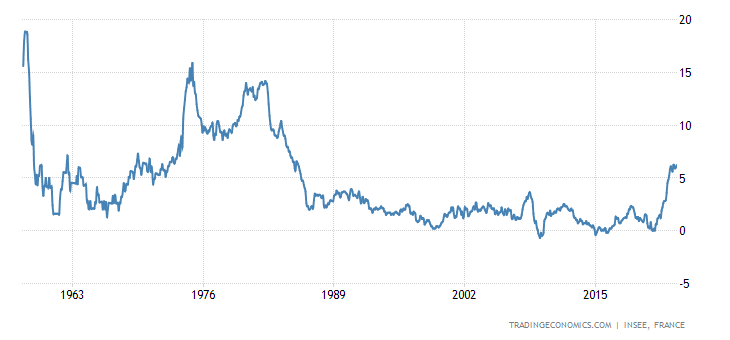
France’s CPI (Consumer Inflation Index) +6.2% per year – a repeat of the top since 1985:
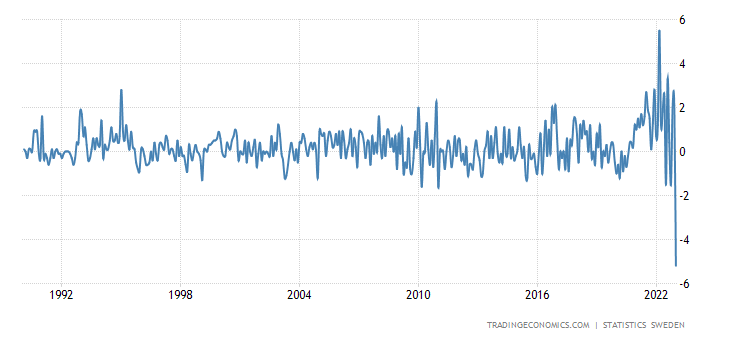
PPI (industrial inflation index) Sweden -5.2% per month – the weakest indicator for all 33 years of data collection:
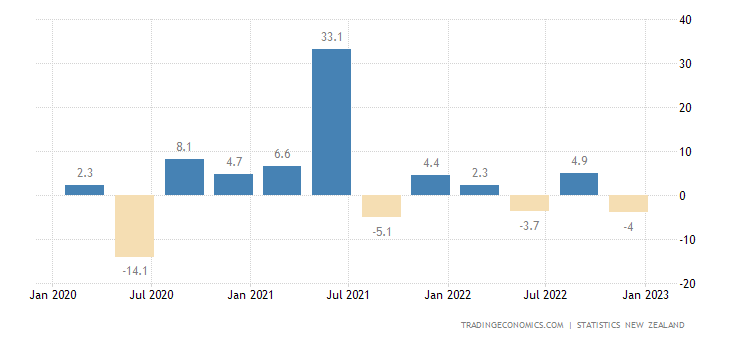
New Zealand Retail Sales -0.6% qoq – 3rd minus in last 4 quarters:
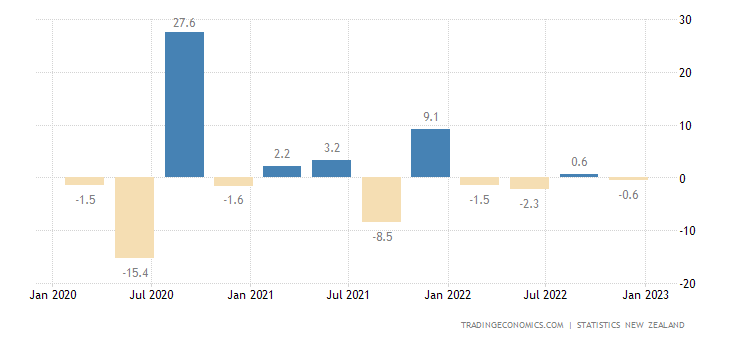
And -4.0% per year:
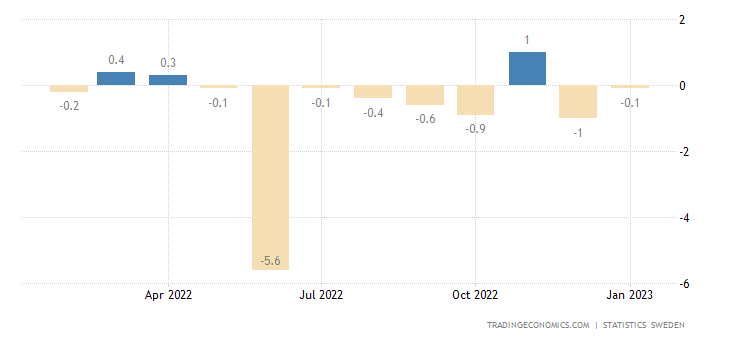
Retail Sweden is -0.1% per month – the 8th minus in the last 9 months:
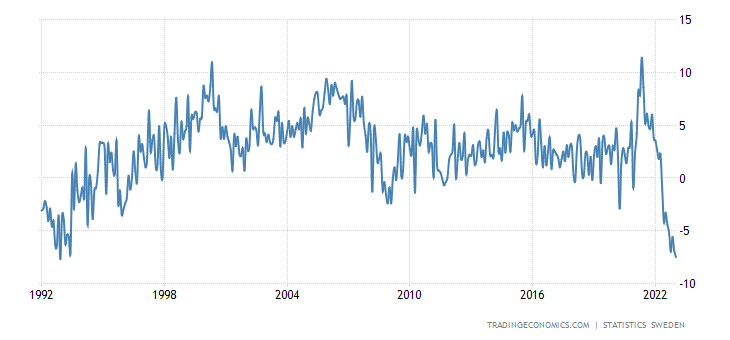
And -7.5% per year – the worst dynamics in 30 years:
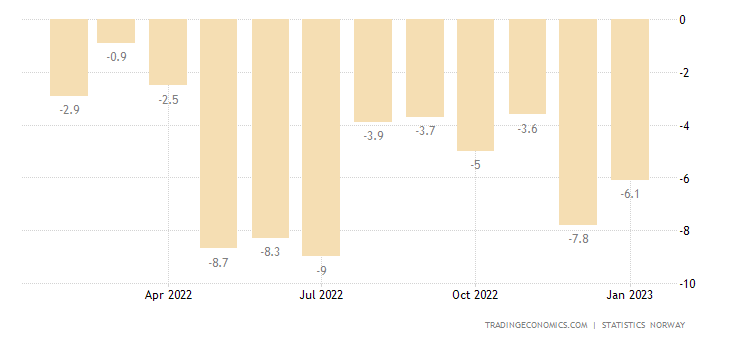
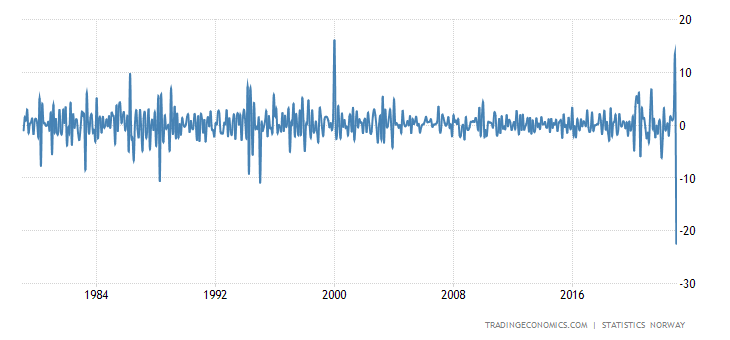
Retail Norway -6.1% per year — the 19th negative in a row:
And the spending of her households -22.5% per month is an anti-record for 45 years of observation:
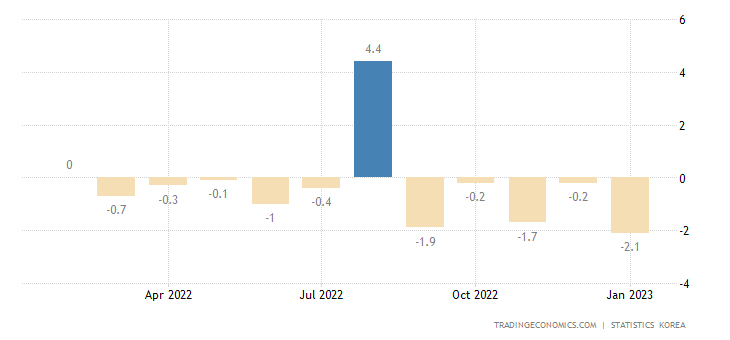
Retail South Korea -2.1% per month – the 5th negative in a row and the 12th in the last 13 months:
Main conclusions.
The structural crisis continues, structural inflation remains quite high, and the rate increase, apparently, will not reduce it. Moreover, a decrease in demand in the face of an increase in the rate leads to economic degradation (construction falls, retail sales decline, industry shrinks, and even the service sector begins to shrink), which categorically requires an easing of monetary policy.
In particular, the schedule of bankruptcies in the European Union, by industry:
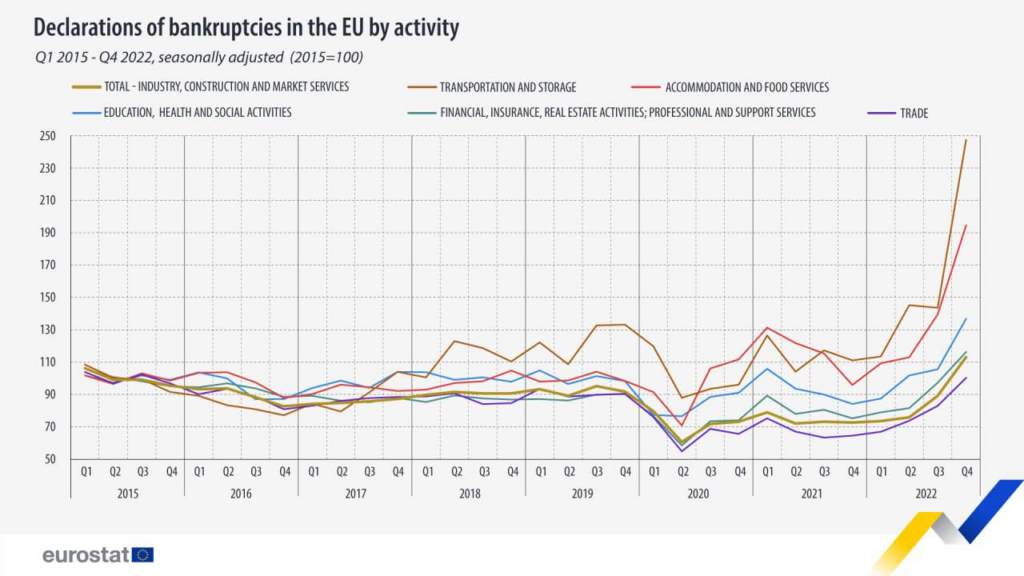
Note that the European Union is not the United States, bankruptcies are less common here. And again the same question arises: how to raise the rate in such a situation? And if in a couple of weeks the data show an increase in inflation, what to do? There is no good answer, you can only continue to put on a good face in a bad game.
And here is another graph of US budget spending on interest payments:
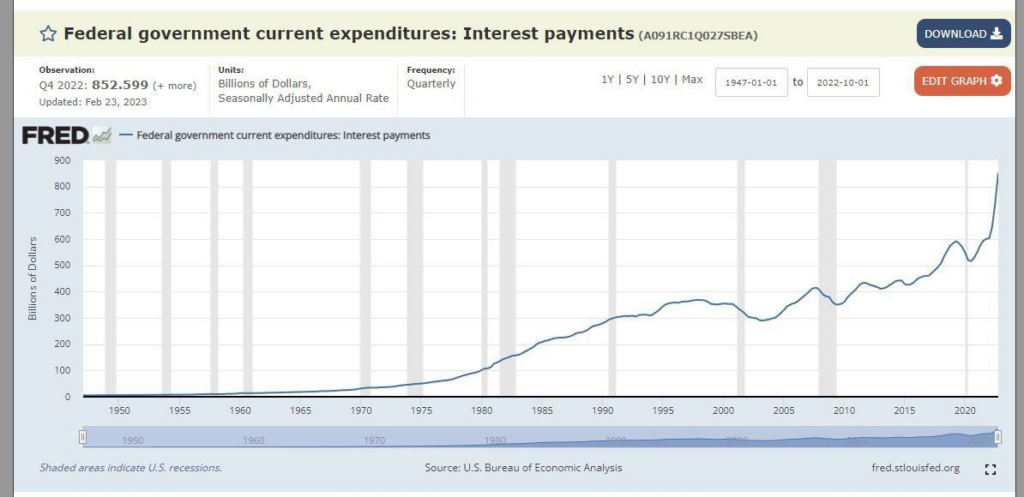
How long can this last without emission?
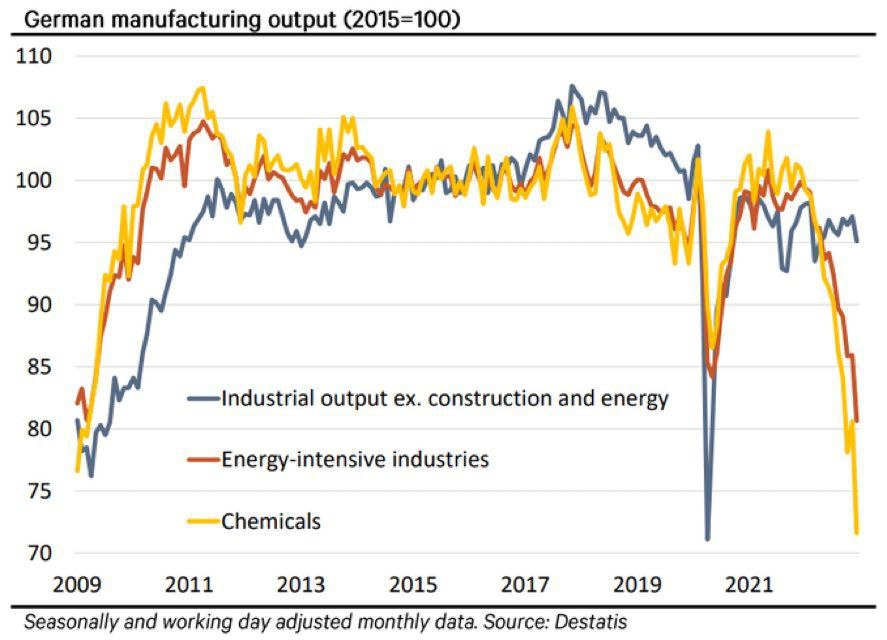
And finally, separately Germany. Just the results of the energy crisis, which, allegedly, turned out to be completely non-critical. I will not even comment, and everything is absolutely clear.
In conclusion, it can be noted that all the optimistic statements of politicians from developed countries and international structures have no real grounds. The crisis continues, entering the next cycle (we will know for sure in two weeks, when the February inflation data will be released). Moreover, extremely unpleasant symptoms appear (see the first section of this Review).
We, however, expect that our readers, due to the knowledge that they have gathered in our reviews, feel protected! In this connection, we wish them a calm weekend and a successful working week! Well, congratulations on March 8 to all women who believe that this is the right holiday!