
Big news. The US Federal Reserve raised the rate by 0.25% to 5.25-5.50%, the highest since January 2001:
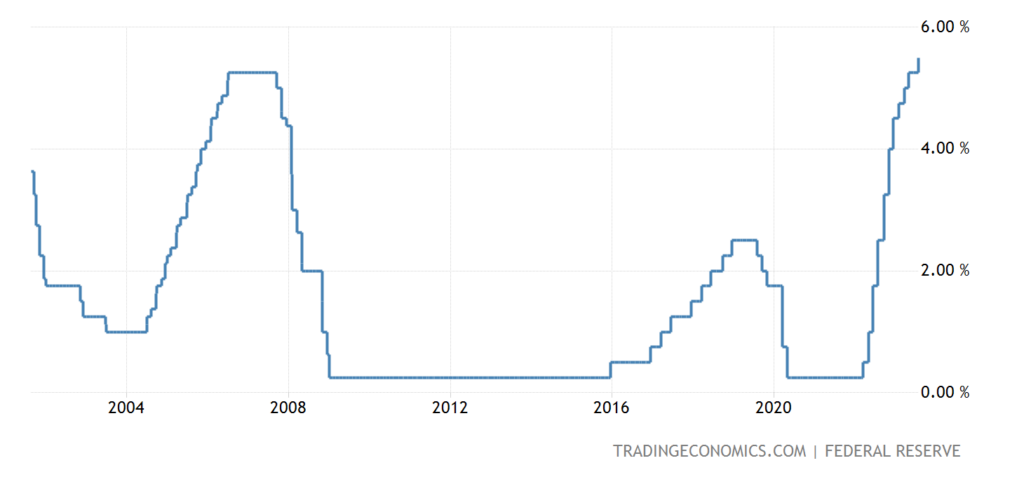
Pic. 1
The ECB raised interest rates by 0.25% to 4.25%, also a 22-year high:
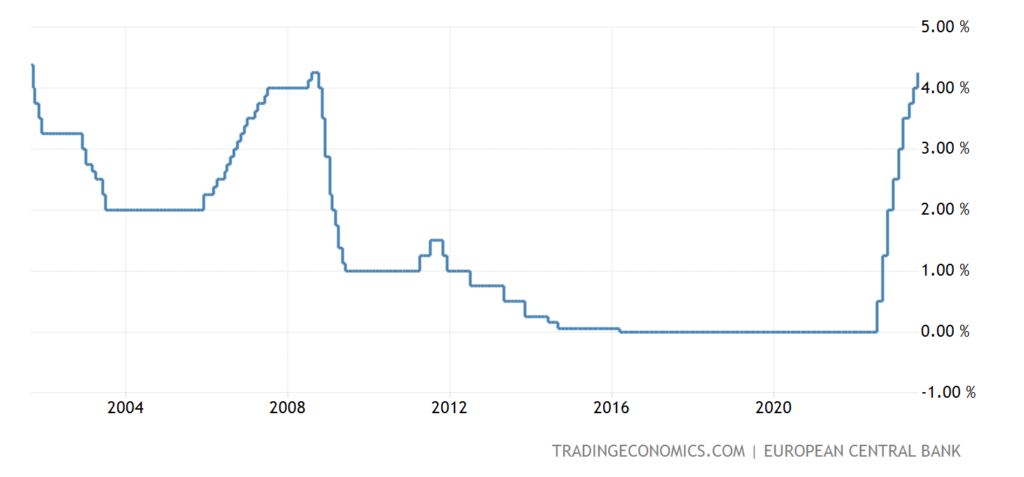
Pic. 2
Let’s note one important point. Two weeks ago, the CPI index (consumer inflation index) was about 3% in annual terms (June 2023 to June 2022), much lower than the previous figure of 4% (May to May) and 4.9% (April to April). The exact figure of the CPI index for June is 0.2%. And, it would seem, in such an optimistic situation – why raise the rate?
In addition, it can be recalled that the annual industrial inflation rate for the entire volume of goods was -9.1%, that is, there is a significant deflation (see the review of two weeks ago), and the annual industrial production went into the red (see the previous review). That is, the rate hike is a clear risk factor against the background of a generally quite optimistic picture of the world (see also the last section of the Review). Why is Powell and the Fed going after him?
Of course, we cannot give an exact answer, but we will nevertheless express one hypothesis. The fact is that the level of 0.25 percentage points was the general consensus. And in this case, the leadership of the Fed just went on about the public. And it seems to us that this seemed to Powell and his colleagues an easier solution than to go for very, very complicated explanations of why he decided to go “against the market.”
Recall that Powell admitted not so long ago that he does not understand the economic processes taking place today. And this means that in the event of a rejection of the general consensus, it would inevitably have to answer a lot of questions about the essence of the matter. Including how the statistics on the US economy correspond to reality. The answer to this question is known, but the head of the Fed (like other US officials) cannot categorically state it publicly.
For example, we openly say that US economic statistics are unreliable (for example, they greatly underestimate inflation and overestimate GDP), we regularly find contradictions in these statistics, and yet we have no reason to give a more or less complete picture. But it is pointless to put pressure on us on this issue. But for the Fed, the situation is different.
There is no reason to believe that such a discussion is easier for Powell than to try to evade him. That is, entering the path of a tough discussion with representatives of the financial community, he will inevitably face very serious problems, which, among other things, will reveal his insufficient qualifications. But what is allowed to us cannot be allowed to the “guru” and “demiurge” of the world dollar system, even taking into account the fact that the authority of the post of head of the Fed has fallen greatly since the days of Volcker and Greenspan.
Otherwise, this situation can be explained in such a way that the leadership of the US monetary authorities has become a hostage of public opinion, which it is simply unable to manage due to the loss of relevant qualifications. And this, from our point of view, is a much more dangerous situation for the United States and the entire Bretton Woods system than the specific value of interest or the amount of credit!
Macroeconomics. German GDP 0.0% q/q – very dismal after two consecutive quarters of decline:
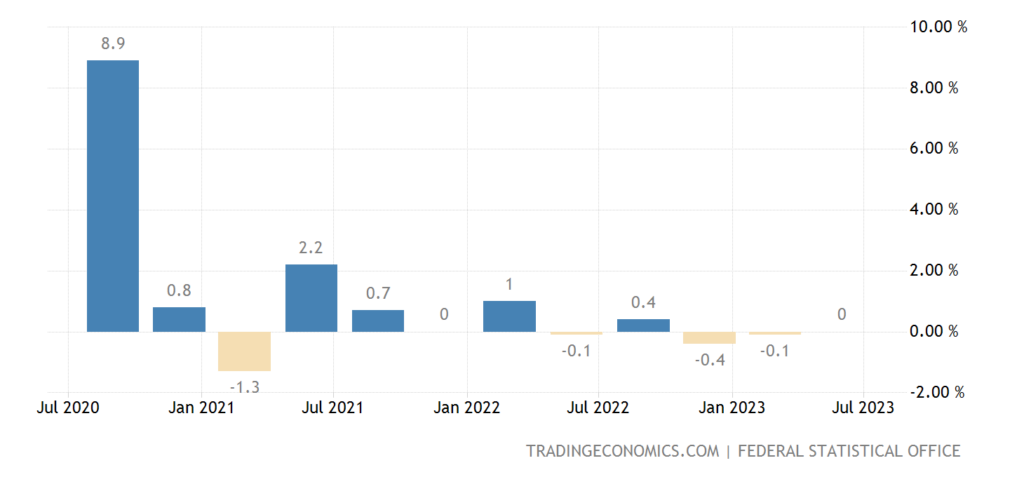
Pic. 3
And -0.2% per year – the 2nd negative in a row:
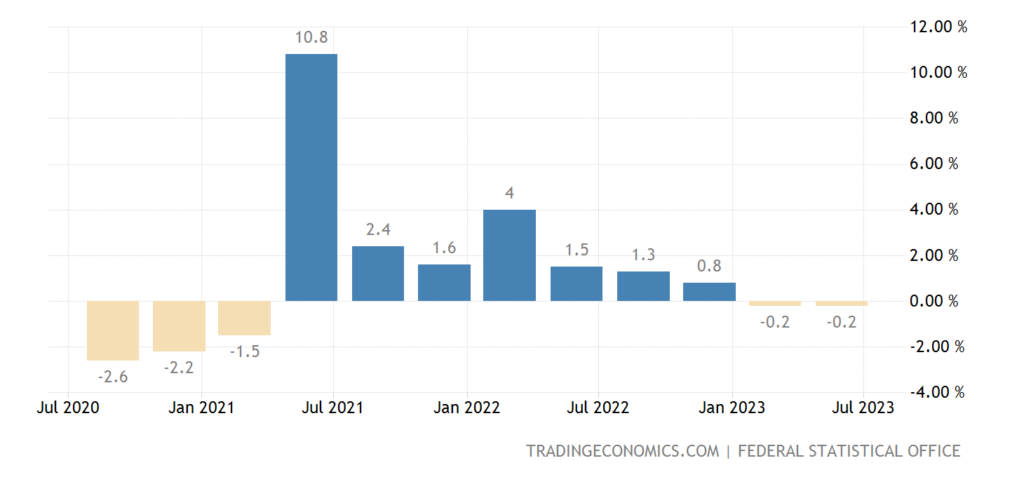
Pic. 4
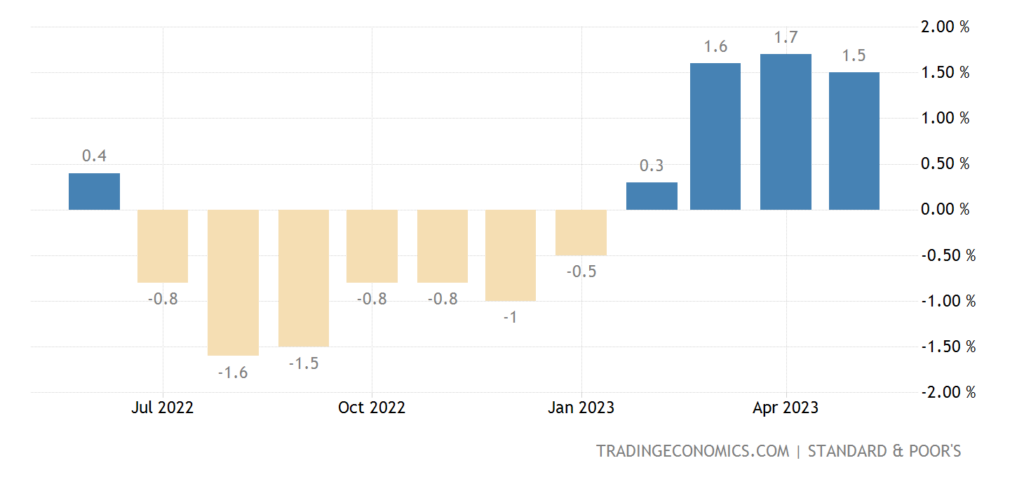
Swedish GDP -1.5% per quarter – at least for 3 years, excluding the failure of 2020, the bottom since 2012:
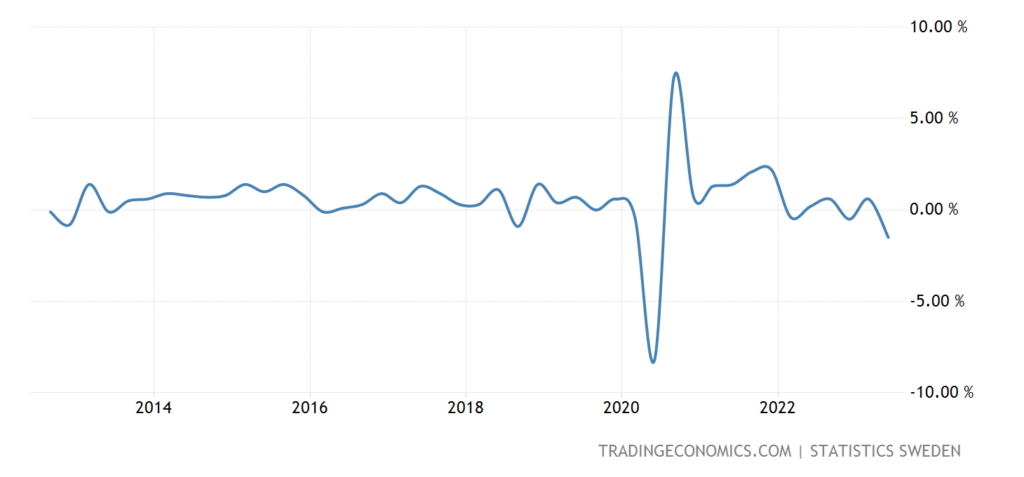
Pic. 5
And -2.4% per year – minus the covid drop, this is the worst dynamics since 2009:
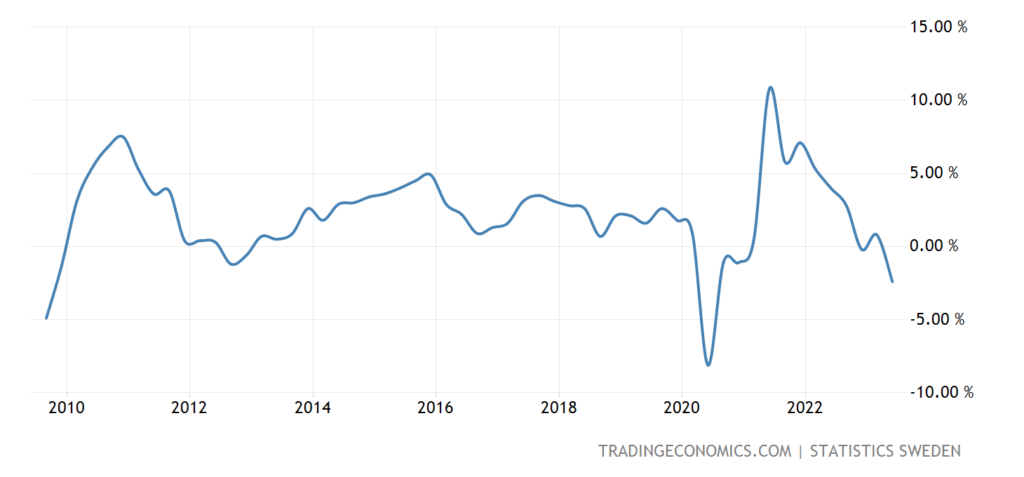
Pic. 6
Separately, for June it is even worse, -1.4% per month and -3.6% per year:
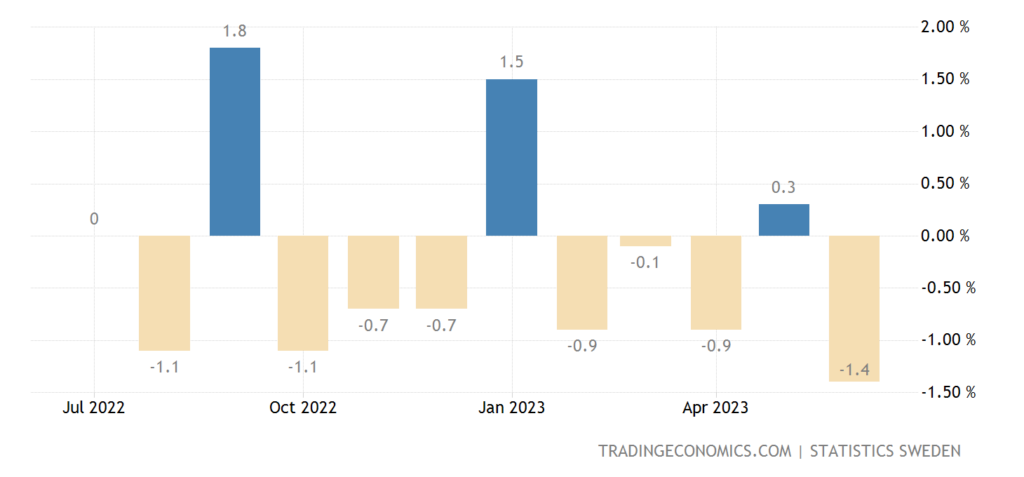
Pic. 7
South Africa business cycle indicator -1.7% per month – 8th minus or zero in a row:
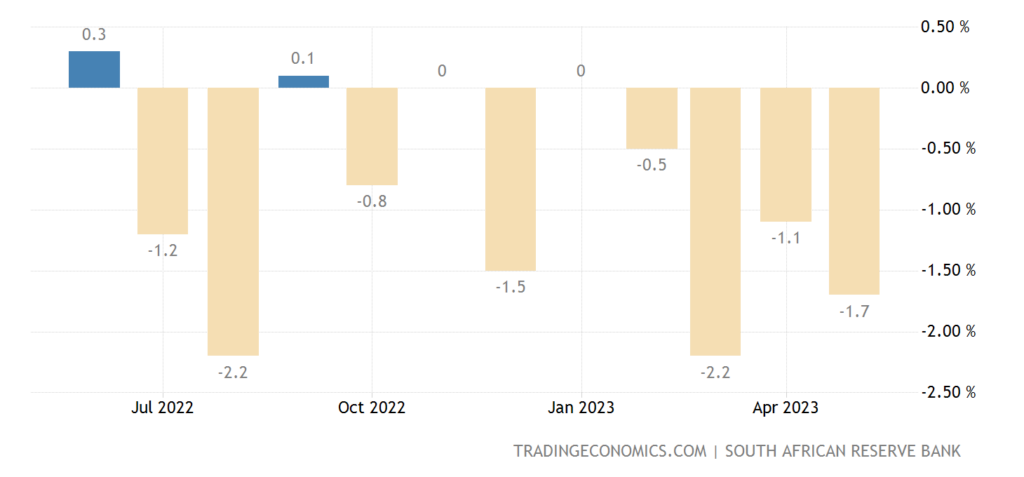
Pic. 8
Profits of industrial companies in China in the 1st half of the year -16.8% per year:
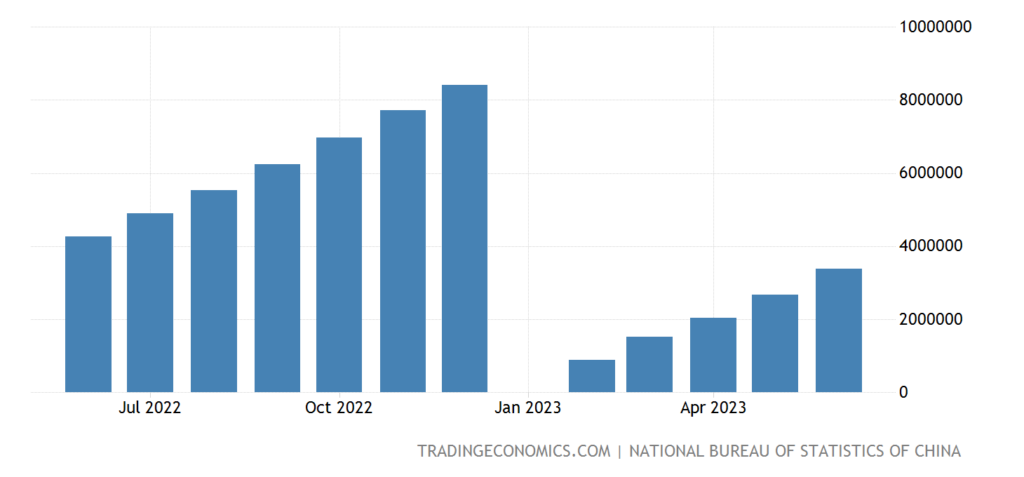
Pic. 9
Singapore industrial production -4.9% per year – 9th consecutive minus:
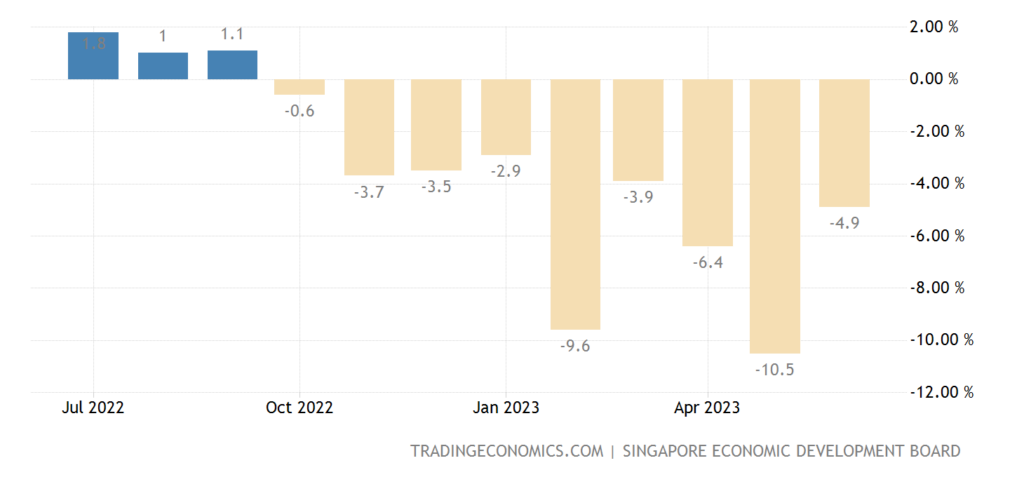
Pic. 10
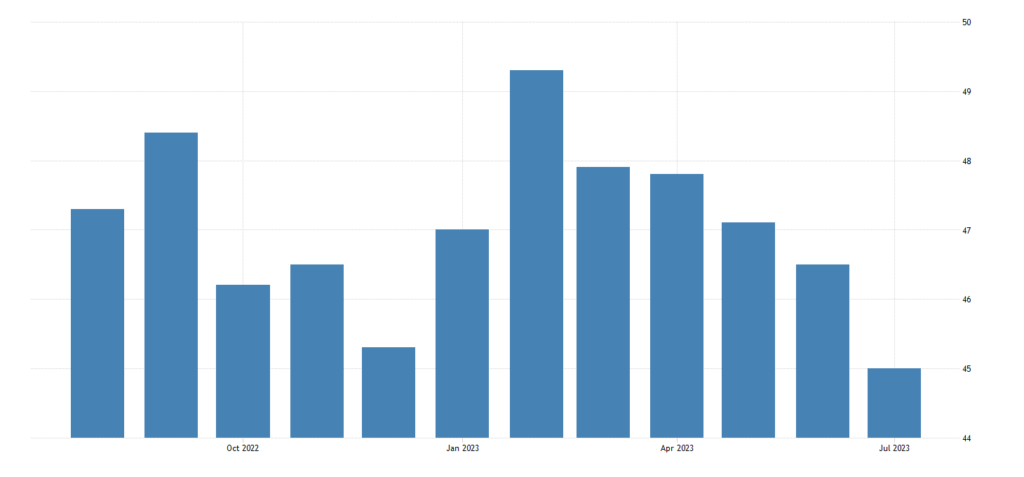
Manufacturing PMI (expert index of the state of the industry; its value below 50 means stagnation and recession) of the eurozone 42.7 – excluding 2020, this is the bottom since 2009:
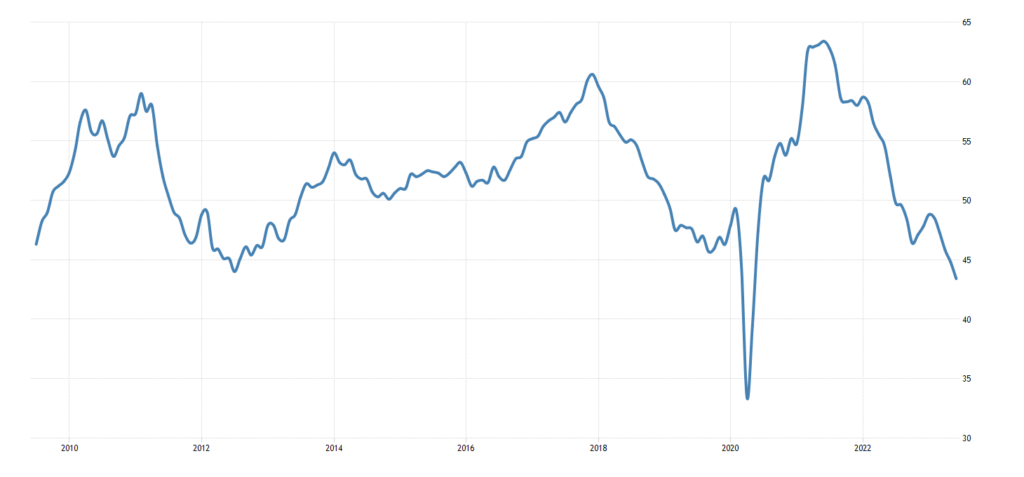
Pic. 11
Mainly thanks to Germany, where the indicator is already in the depression zone (38.8):
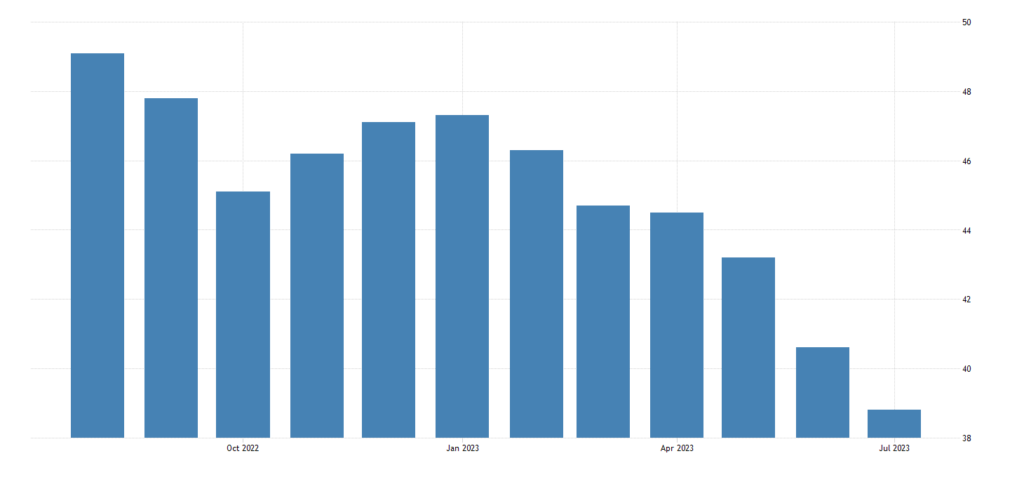
Pic. 12
Approximately the same picture as in the eurozone, and in Britain (45.0):
Pic. 13
Business climate index in Germany (from IFO) is the lowest in 8 months:
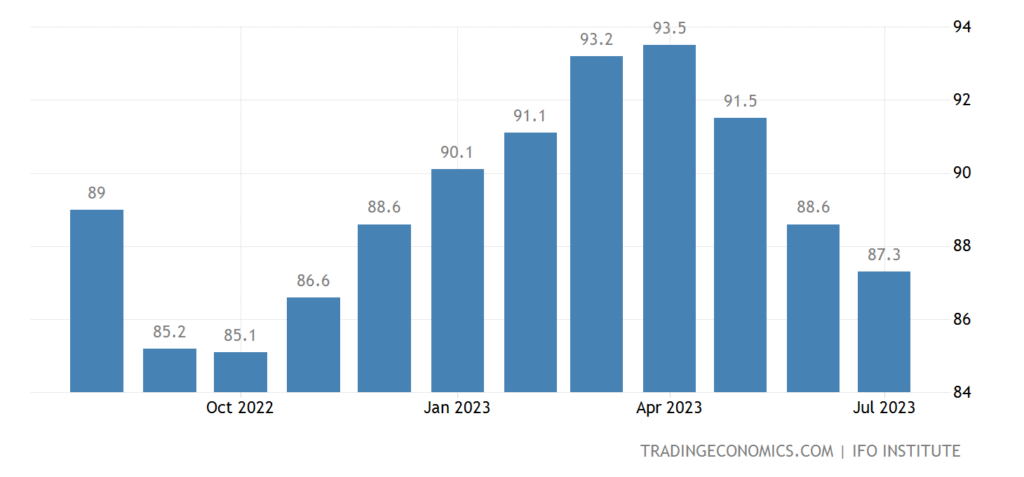
Pic. 14
And the assessment of the current state, not counting the failure of 2020, is at the bottom since 2010:
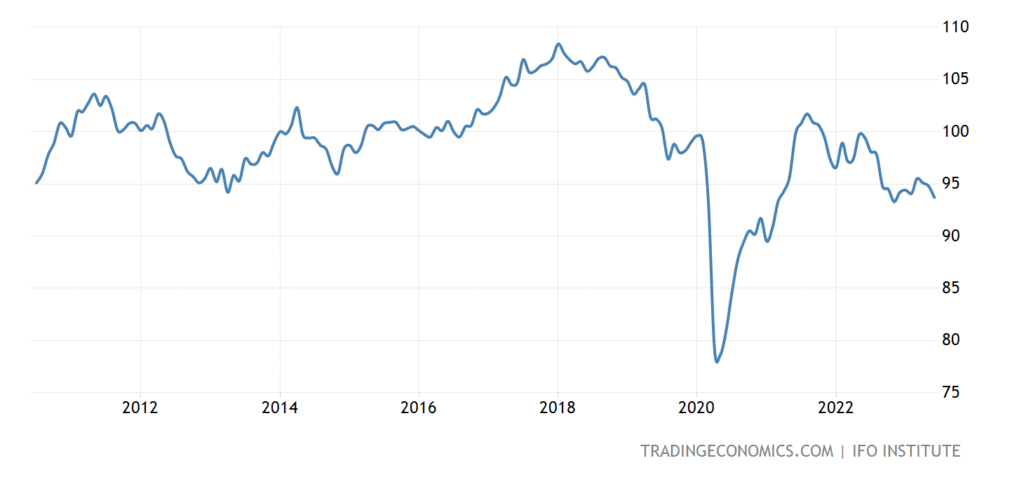
Pic. 15
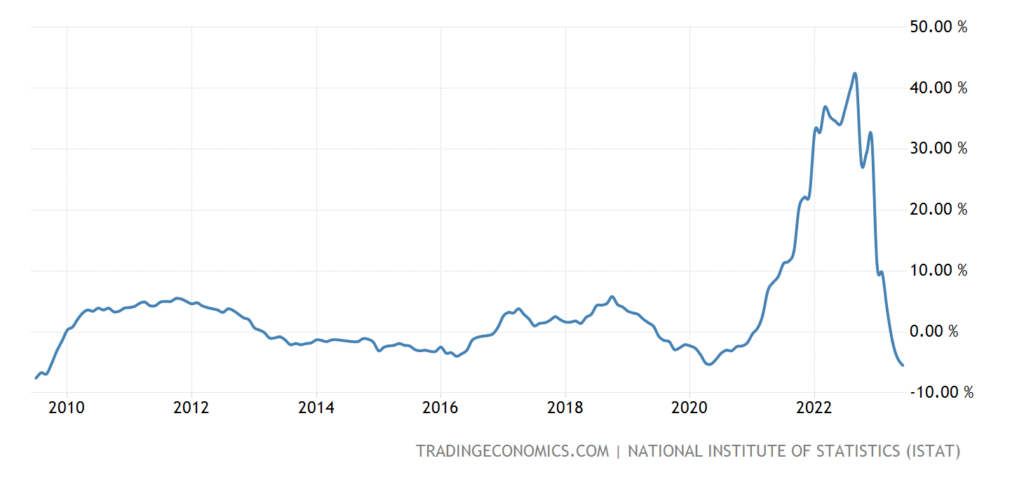
Business confidence in Italy weakest in 2.5 years:
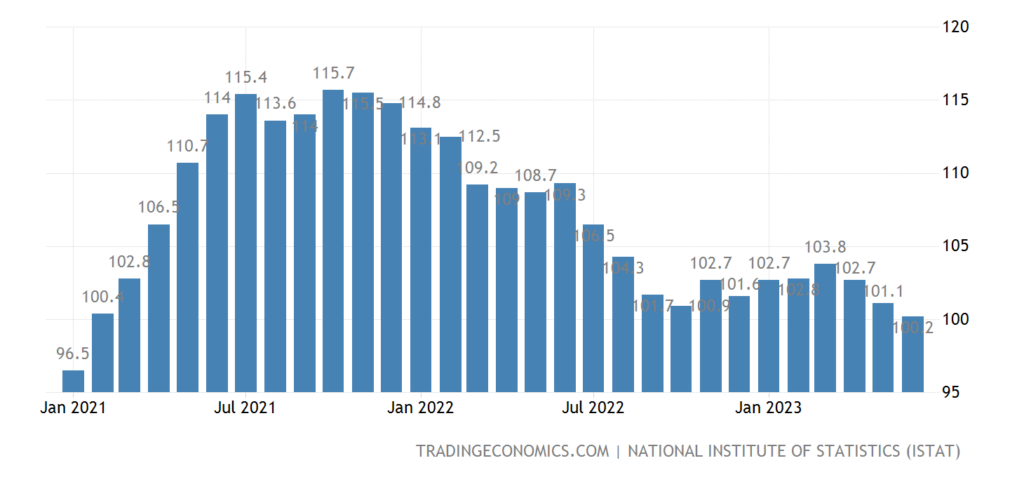
Pic. 16
In Spain – for 3 years, and minus 2020 – for almost 10 years:
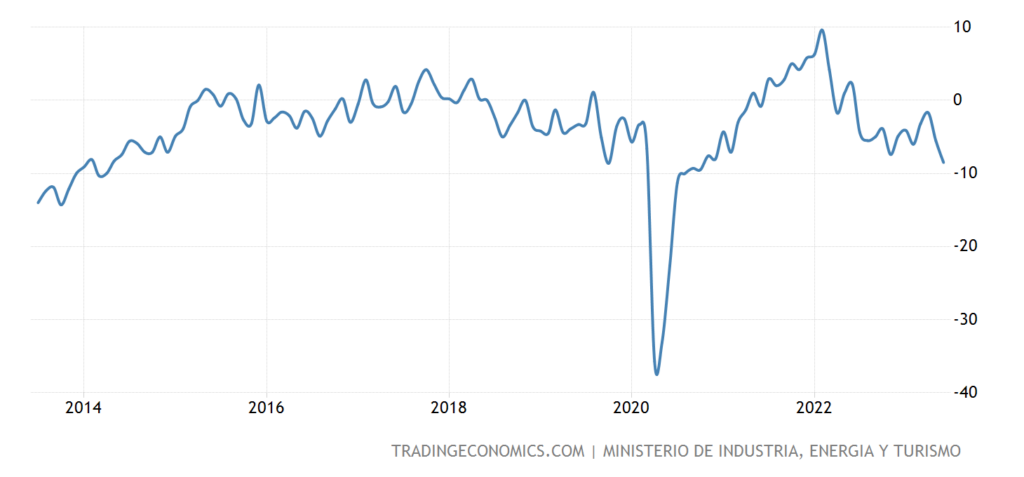
Pic. 17
Economic sentiment in the euro area is the worst in 9 months:
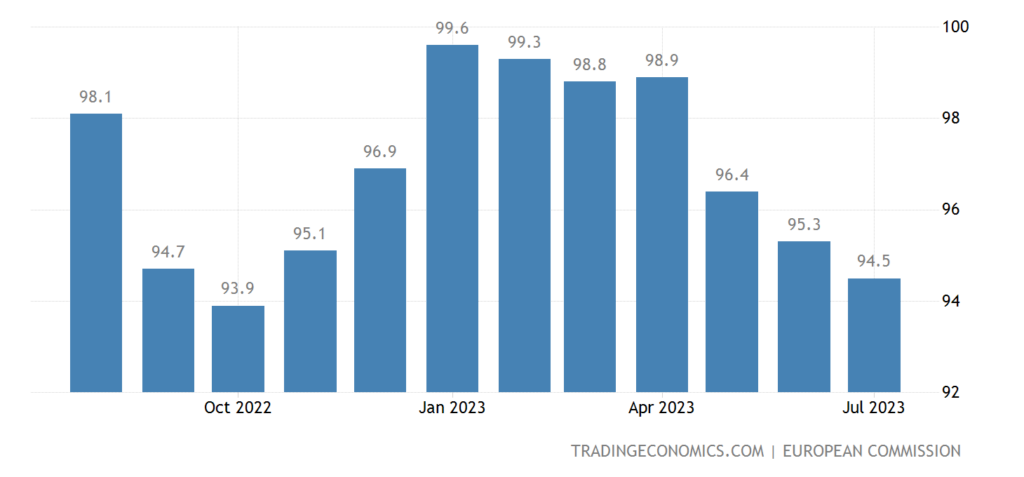
Pic. 18
Including in industry – for 3 years, and excluding the collapse of 2020 – for 11 years:
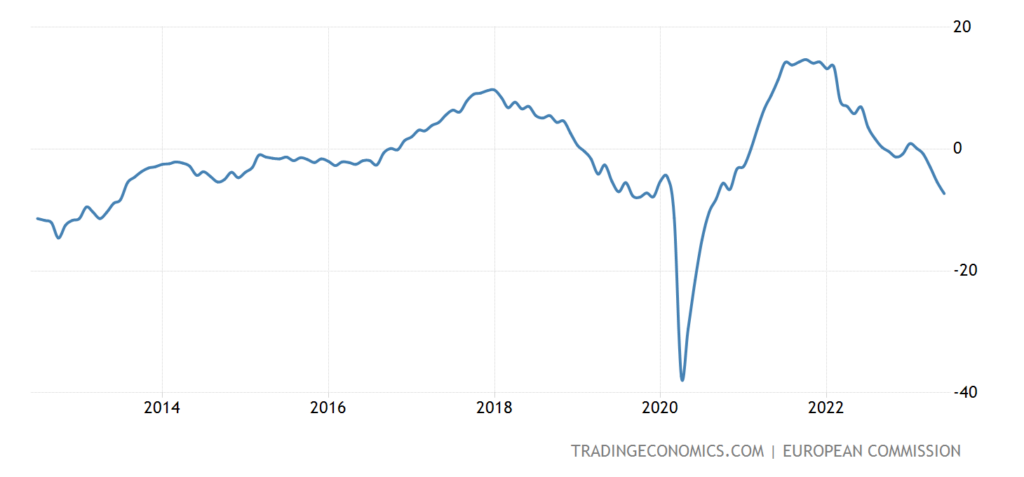
Pic. 19
The US National Activity Index (from the Chicago Fed) has been in the red for 7 out of the last 9 months:
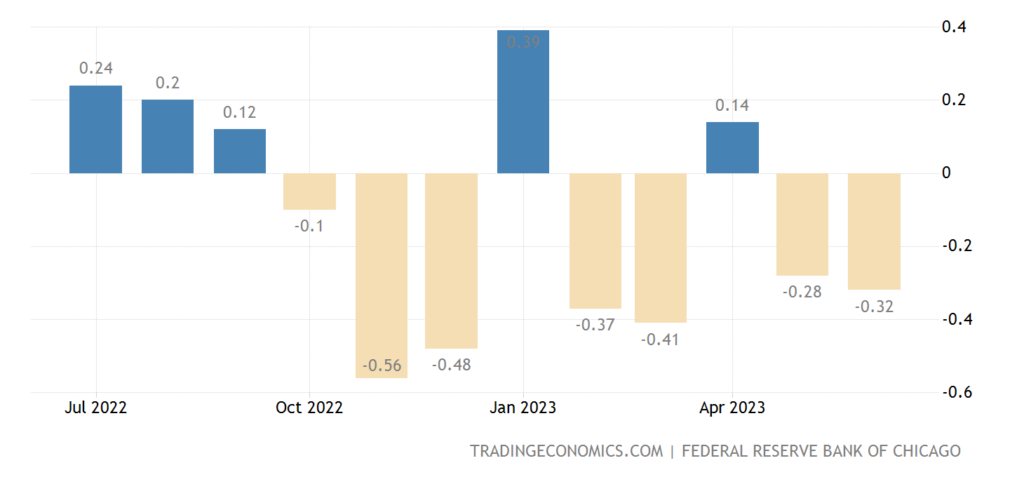
Pic. 20
The Richmond Fed Regional Industrial Index has been in the red for 7 straight months:
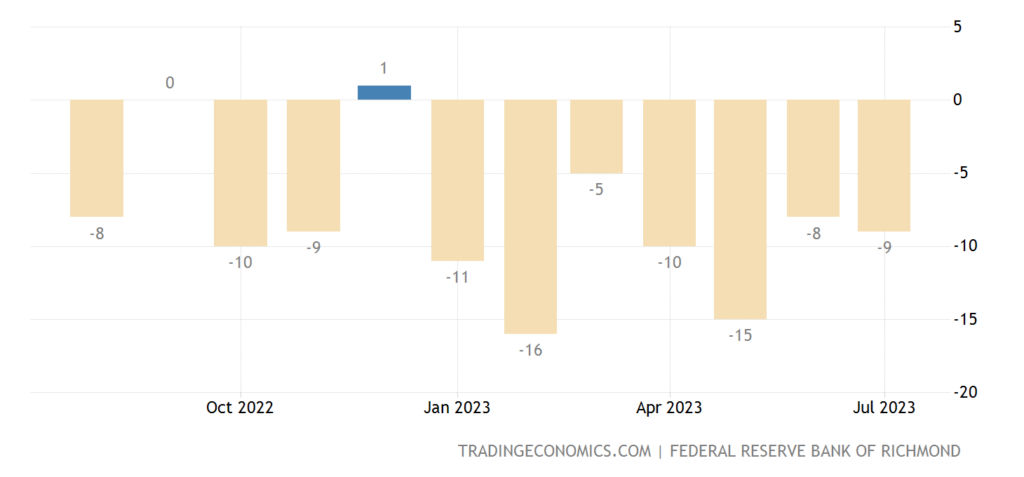
Pic. 21
And in the service sector – 14 months:
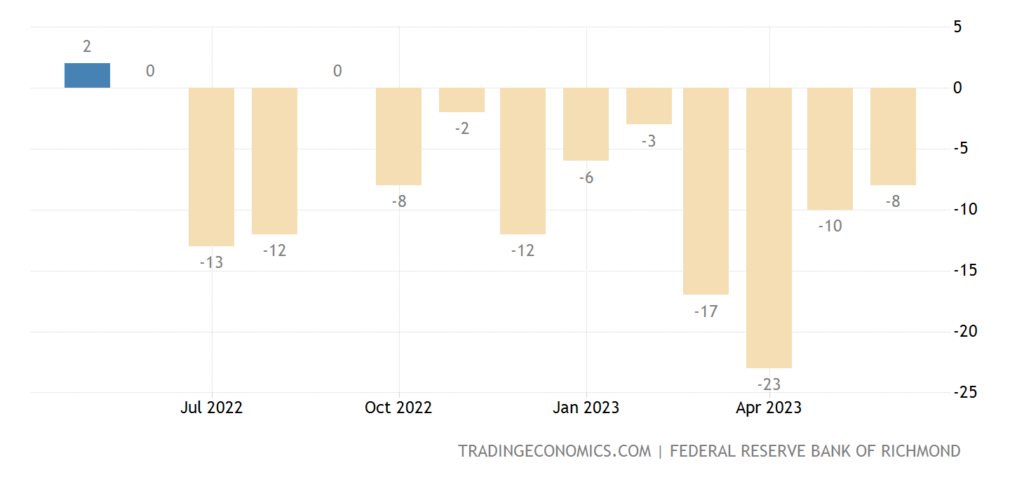
Pic. 22
A similar Kansas Fed Industry Index is near a 3-year bottom, excluding 2020, the bottom of 2009 is very close:
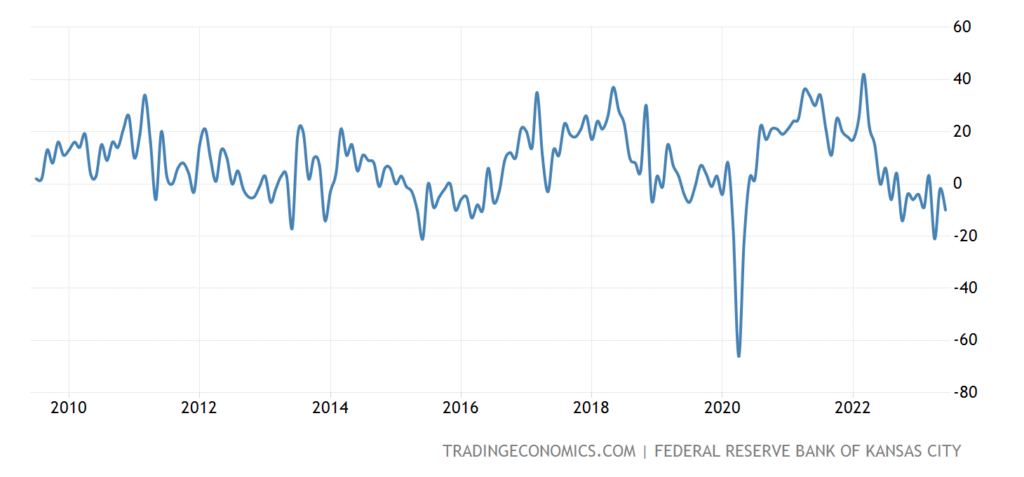
Pic. 23
U.S. Pending Existing Home Sales -15.6% per annum – 25th straight loss:
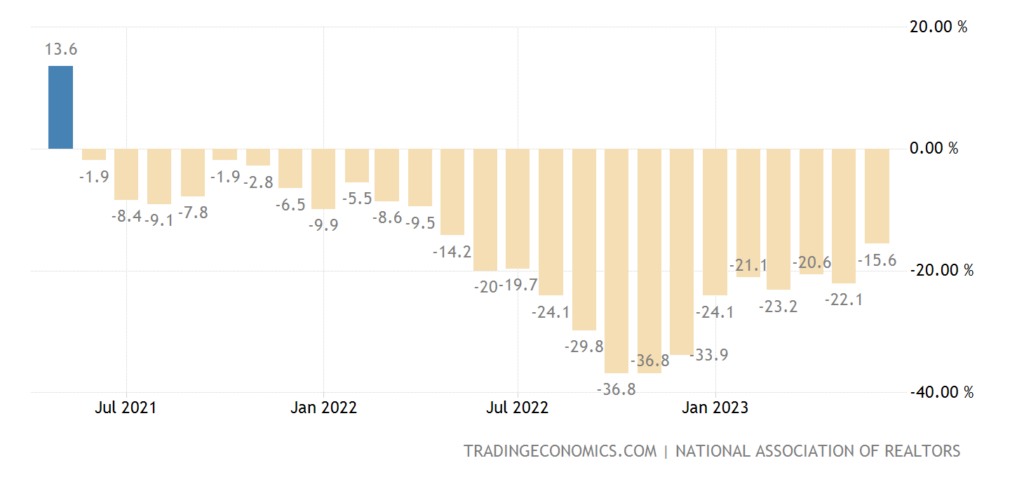
Pic. 24
US house prices have been rising monthly for 4 months in a row:
Pic. 25
CPI without food and fuel in Tokyo Prefecture in Japan +2.5% per year – the highest since 1992:
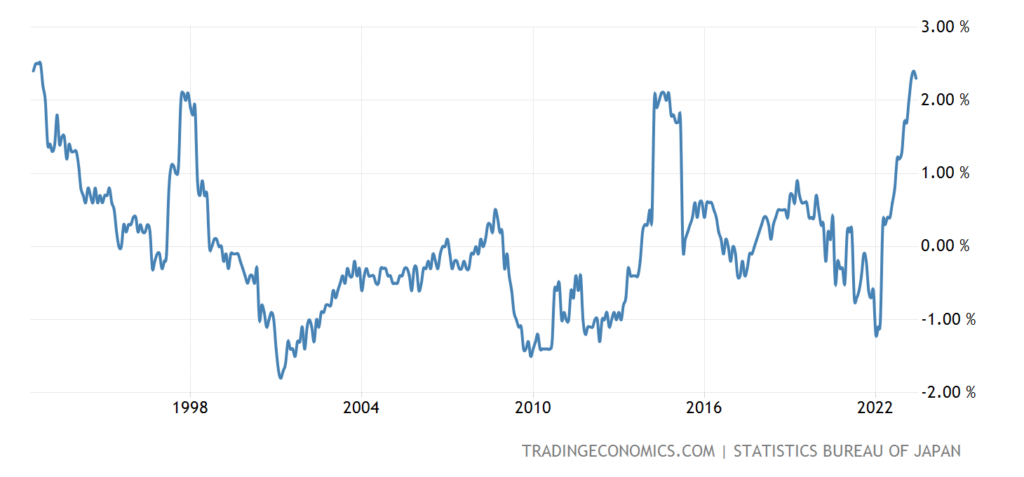
Pic. 26
PPI (industrial inflation index) of Spain -8.1% per year – apart from the failure of 2020, this is an anti-record for 47 years of observation:
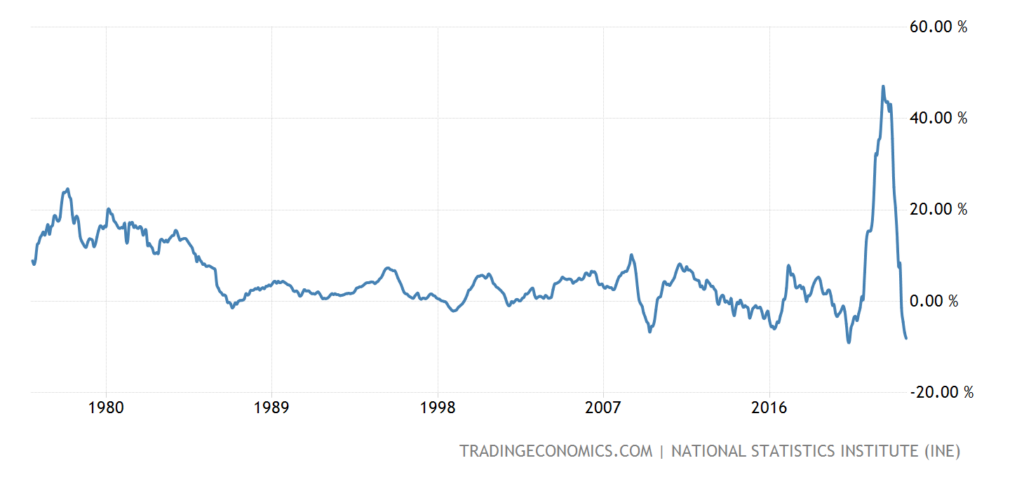
Pic. 27
PPI Brazil -12.4% per year – anti-record for 72 years of data collection:
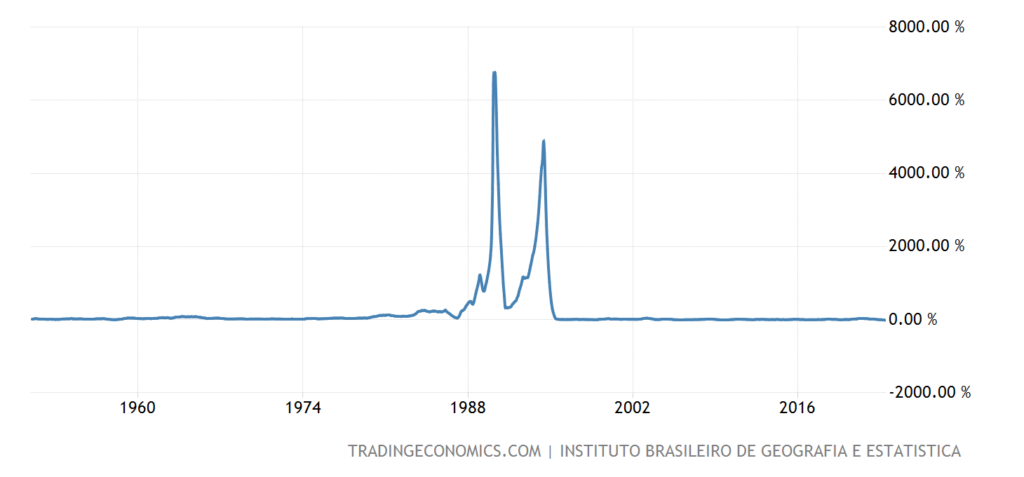
Pic. 28
PPI Italy -5.5% per year – minimum since 2009:
Pic. 29
What an amazing picture, some time ago we noted constant records of inflation growth, now deflation is setting records!
Export prices in Australia -8.5% per quarter – the worst dynamics since 2009:
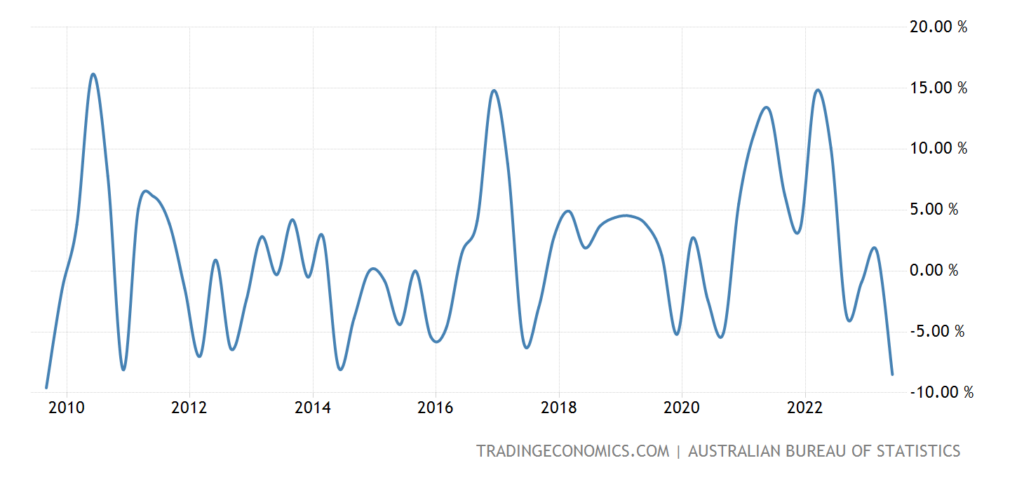
Pic. 30
Unemployment in Sweden jumped to 9.2% – not counting the rise in 2020, this is the peak since 2010:
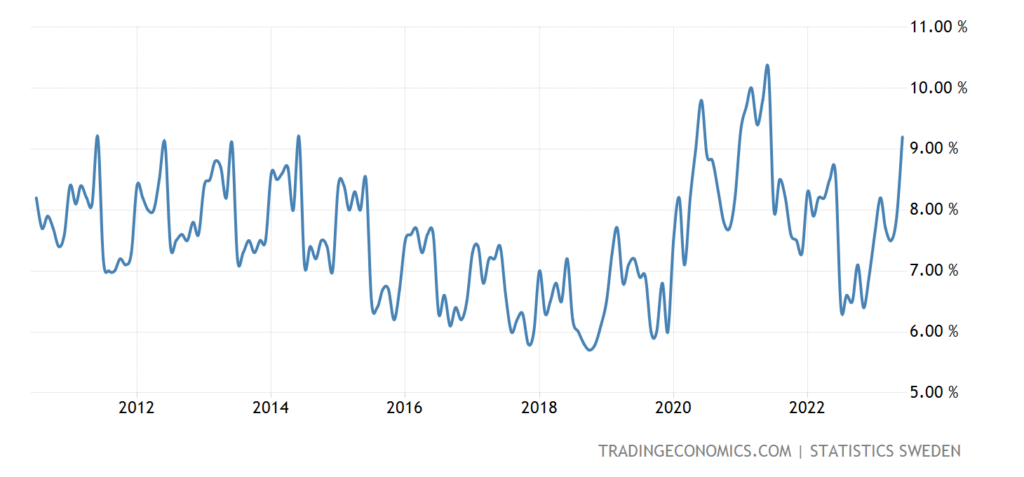
Pic. 31
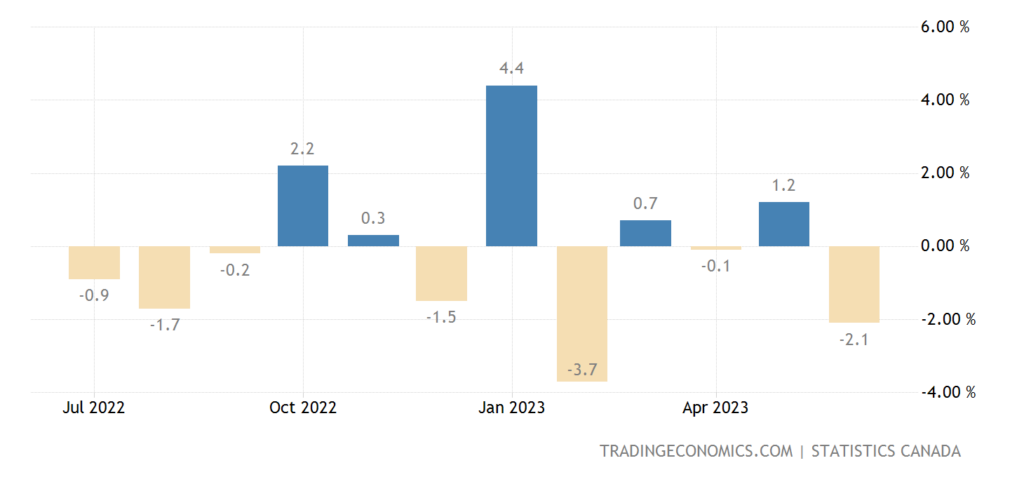
Wholesales in Canada -4.4% per month – not counting 2020, the last time it was worse was 20 years ago:
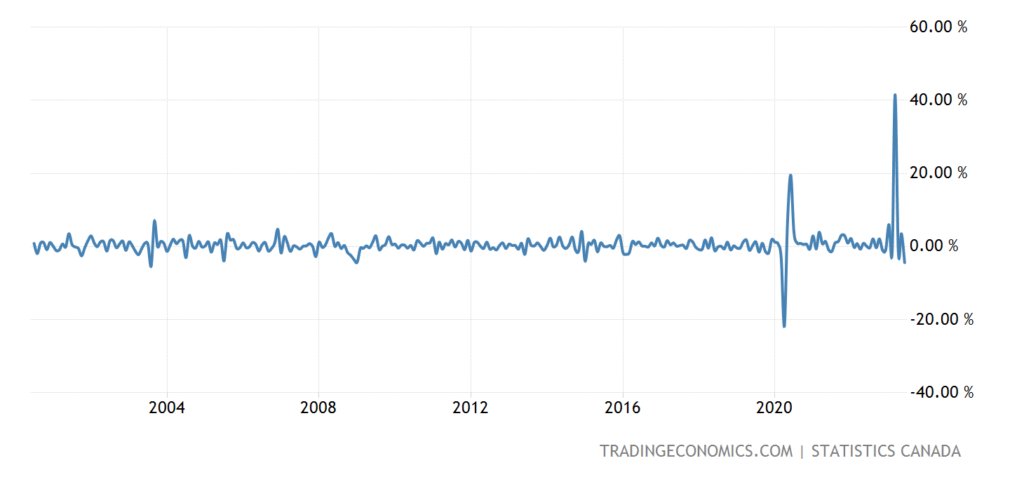
Pic. 32
Its sales in the manufacturing industry -2.1% per month –
Pic. 33
Retail sales in Sweden -4.4% per year – the 14th consecutive minus:
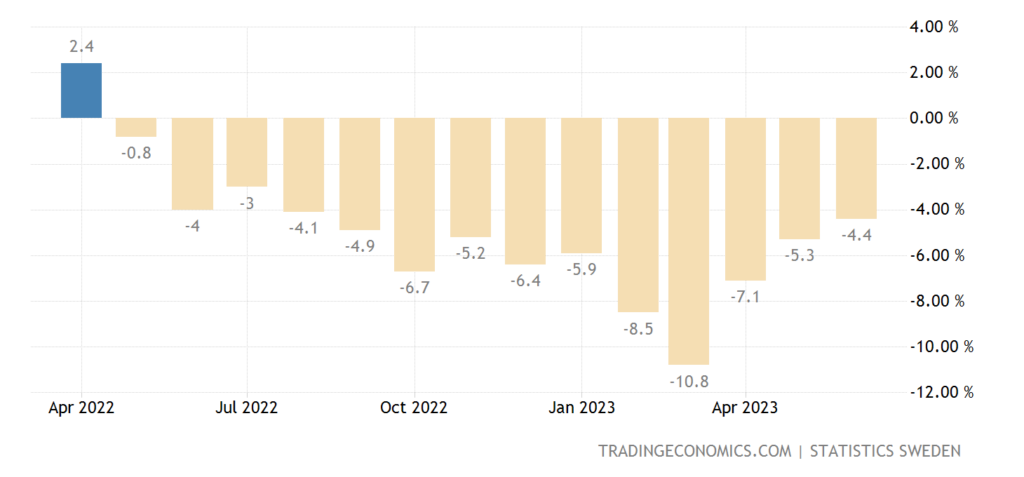
Pic. 34
UK retail sales balance is worst in 15 months:
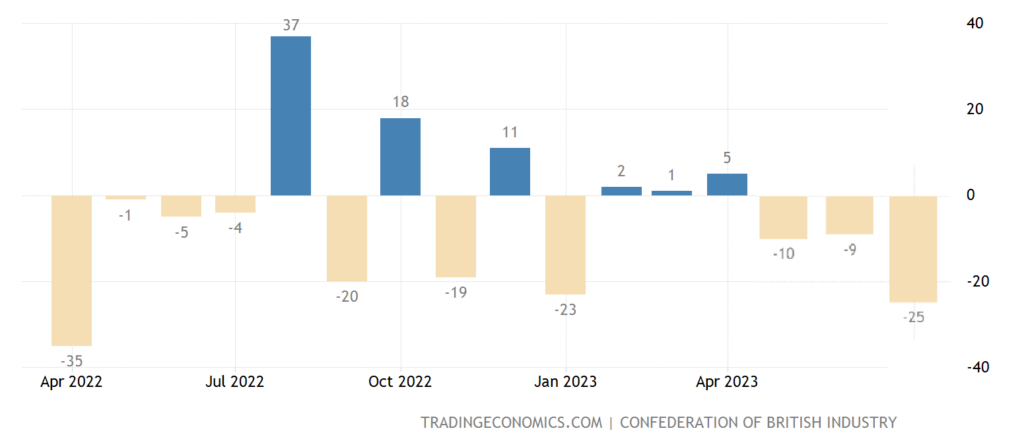
Pic. 35
The Central Bank of Indonesia for the 6th time in a row did not change anything in its monetary policy. The Bank of Japan did not change rates, but loosened control over bond yields (it is allowed to rise to 1%).
Main conclusions. Powell, at his press conference, repeated the arguments of the previous time, which suggests that his understanding of the situation has not changed much. What he, however, almost directly said:
- If necessary, we can go for further tightening of monetary policy;
- in September everything will depend on macro data;
- there is a long way to go to return inflation to 2%;
- the full impact of the tightening is yet to be felt;
- Inflation has slowed down somewhat, inflation expectations have consolidated.
- employment is still growing at a high rate in the US;
- supply and demand have found some balance, based on data on the labor market;
- have not yet made any decisions on the future rate of the Fed;
- there were no decisions that the Fed would raise the rate every 2 meetings;
- Inflation dropped in June, but this data is only for 1 month!
- strong economic growth can lead to bursts of inflation, we will take action;
- about raising the rate: “We made this decision based on the data we have”;
- core inflation is still very high;
- one way or another, we will need to keep rates high for a while;
- ready for further tightening of the monetary policy, if required;
- a slowdown in the pace of rate hikes could mean a rise in 2 out of 3 meetings;
- the unemployment rate is not growing, still historical minimum values;
- I don’t think the policy has been restrictive enough of the time;
- inflation turned out to be more stable than previously thought;
- now it is inappropriate to give any forecasts;
- we can afford to suffer a little;
- after today’s decision, I would say that PrEP is restrictiveж
- normalization of supply conditions plays an important role in reducing inflation;
- I do not think that this year we will reduce the rate;
- Fed members no longer predict a recession in the US;
- I do not use the term “optimism”, but there is definitely a way to a soft landing in the economy;
- would stop raising rates before reaching the inflation target of 2%;
- I do not think that inflation will reach 2% before 2025!
- if we see convincing evidence of a decrease in inflation, then we can lower the rate to a neutral level, and then – below this level;
- the level of salaries is an important indicator for the fight against inflation now;
- The Fed will do everything necessary to reduce inflation!
- The Fed may cut rates and continue QT.
GDP (q/q) (Q2):
FACT: 2.4%
FORECAST: 1.8%
PREVIOUS: 2.0%
GDP Deflator (QoQ) (Q2)
FACT: 2.2%
FORECAST: 3.0%
PREVIOUS: 4.1%
Number of Initial Jobless Claims
FACT: 221K
FORECAST: 235K
PREVIOUS: 228K
Underlying Durable Goods Orders (MoM) (June)
FACT: 0.6%
FORECAST: 0.0%
PREVIOUS: 0.6%
Durable Goods Orders (MoM) (June)
FACT: 4.7%
FORECAST: 1.0%
PREVIOUS: 2.0%
Question: why is this positive not considered and not taken into account? Most likely, the fact is that statistical distortions can lead to significant changes in indicators, and Fed leaders understand that this positive only works over more or less long distances. If these data remain for three months, it will be possible to consider them, if not, they say little. Well, let’s take into account that, unlike us, the leaders of monetary authorities have access to the results of previous statistical methods, so they more or less understand the value of these positive data.
By the way, our readers can also draw the appropriate conclusions. In particular, for the leaders of the FRS organization, the basic (that is, cleared of highly volatile components of food and fuel) inflation is an important factor, but the growth in orders for durable goods or the number of initial applications of the unemployed is not very. Not so little…
And in conclusion, we traditionally wish our readers a pleasant summer weekend and a successful working week!