
September 23-29, 2023
Big news. In the previous review, a lot was said about the Fed’s decision on the rate and Powell’s press conference. And the key economic intrigue (the games with statistics that we wrote about a week ago, after all, were a deviation from the usual content of reviews) is the issue of the inflation rate. If inflation rises, the rate will have to be raised and the already recognized crisis will intensify. If inflation falls, the rate could even be lowered and perhaps this would avoid an official declaration of recession.
Let us note, for the umpteenth time, that in reality the decline in the US economy has been continuing since the autumn of 2021, and deflation in the industrial sector is a good indicator of it. The same indicator that the authorities call “inflation” is in reality the consumer inflation index (CPI).
So, the price index of personal consumption expenditures (which, of course, correlates with the CPI index, but does not coincide with it) increased quite significantly month on month (that is, August by July) from 0.2% to 0.4%. If we look at year-on-year indicators, then from August to September it increased from 3.4% to 3.5%. Note that last week Powell already knew these indicators (at least in a preliminary version). This was one of the reasons why he was nervous: everyone hoped that there would be no trouble, but he knew for sure that inflation could jump up!
Let us note, by the way, that data on US GDP remained virtually unchanged, but the GDP deflator at the end of the second quarter fell to 1.7% from 3.4% in the first quarter. However, given the terrible deflation in the industrial sector (-9.5% in June) this is not surprising. In general, taking into account the constant distortion of GDP statistics (recession cannot be shown!), it is impossible to rely on this indicator. Because of its very simple feature: if you reduce the GDP deflator by x%, then GDP will increase by the same x% (small deviations can be neglected).
At the same time, Powell spoke on Thursday this week to economics teachers at Town Hall in Washington.
“The Federal Reserve’s ability to influence the economy depends on people getting what we’re saying“, – the Fed chairman said, emphasizing the importance of the work done by economic educators. When Fed officials release their forecasts for interest rates and the economy, “one of our goals is to influence spending and investment decisions today and in the months ahead,” he said. “Believe me, Bander-log”, – as one extremely colorful character in the fairy tale about Mowgli said (with my slight modifications).
As a result, the main intrigue of autumn continues. As is customary, we state: the Khazin Foundation will closely monitor developments!
Macroeconomics. Industrial production in Japan -3.8% per year – the 9th minus over the last 10 months and the worst dynamics
for 1.5 years:
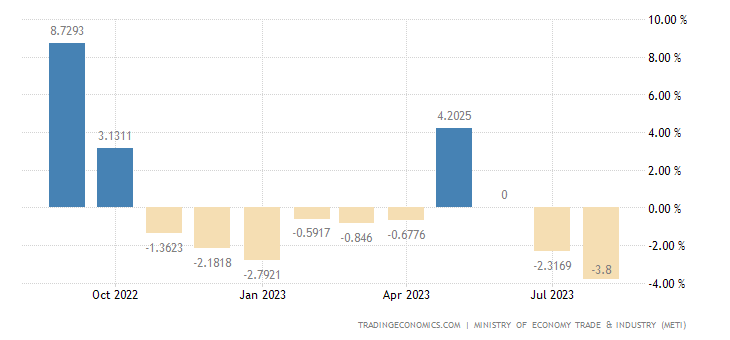
Рic. 1
Singapore manufacturing output -10.5% per month:
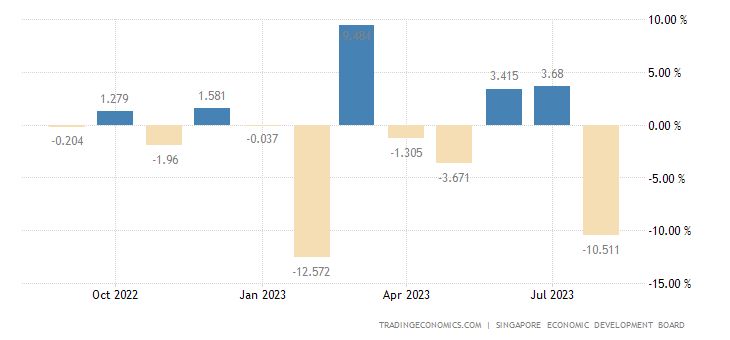
Рic. 2
And -12.1% per year – the worst dynamics in 4 years:
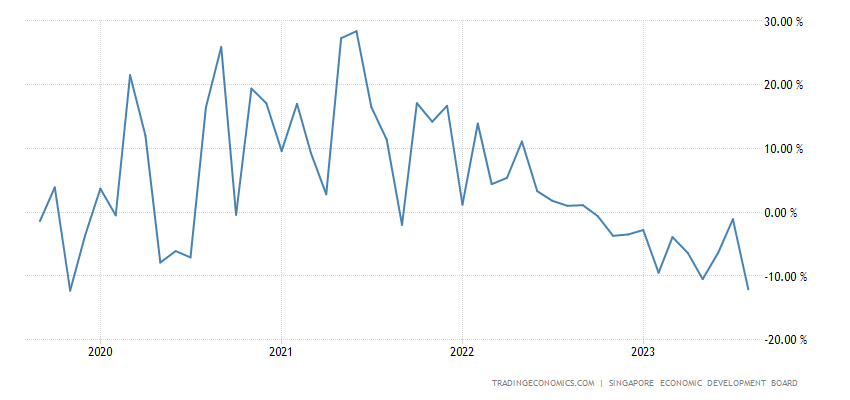
Рic. 3
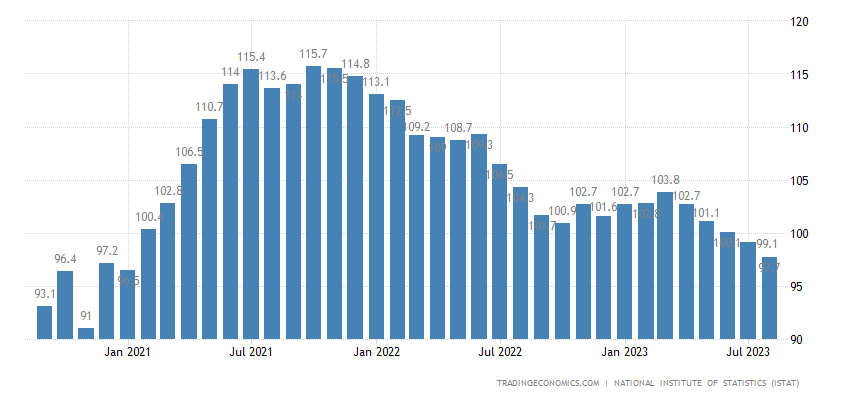
Industrial sales in Italy -1.6% per year – 4th negative in a row:
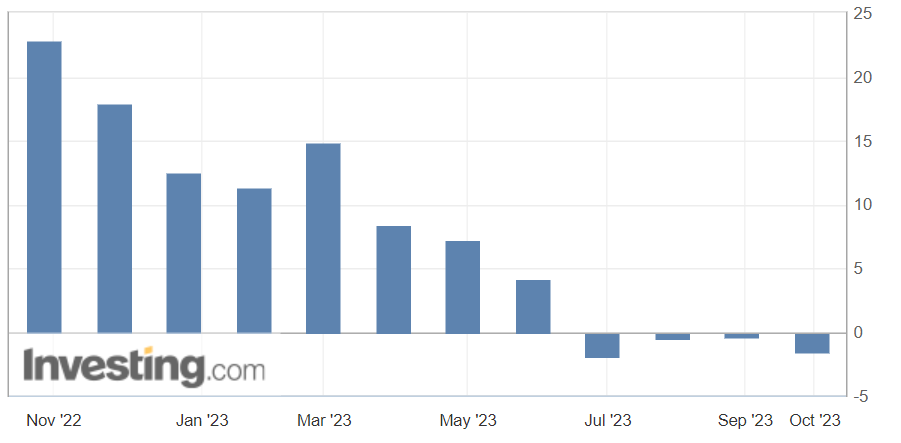
Рic. 4
Business confidence in Italy is weakest in 3 years and in the zone of pessimism:
Рic. 5
The German business climate index (IFO survey) is the worst in 11 months:
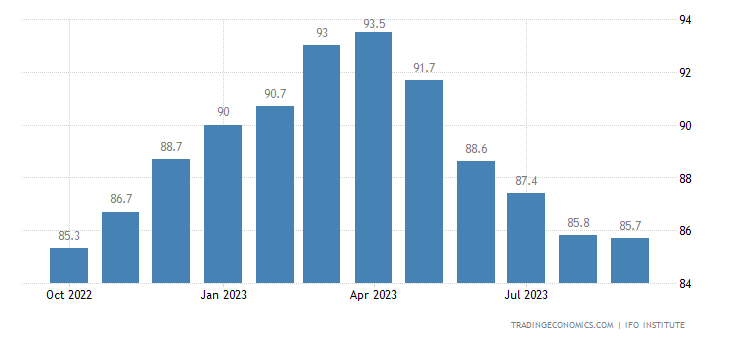
Рic. 6
The picture is the same in economic sentiment in the eurozone:
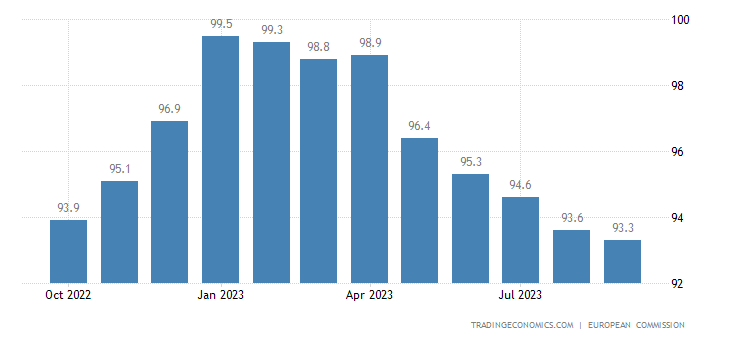
Рic. 7
In general, things in the European Union are not just bad, but very bad. And then there will be other data.
The 3-year minimum is also in Canada – and without taking into account the Covid crisis, such numbers were only in 2009:
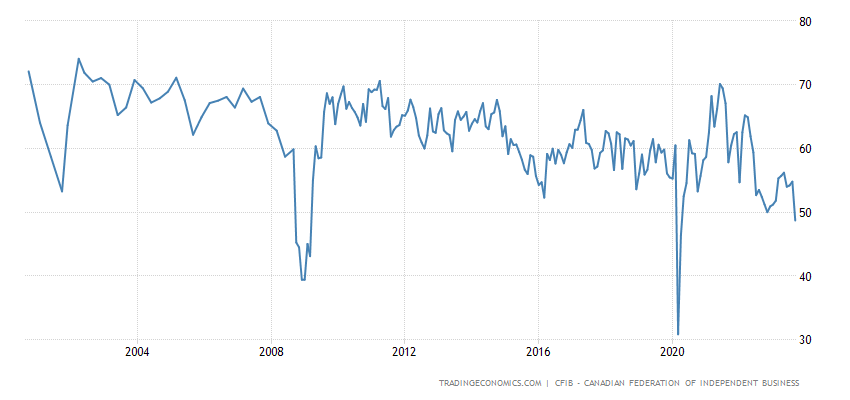
Рic. 8
Business activity in the industry in the Texas Fed zone has remained in decline for 17 months in a row:
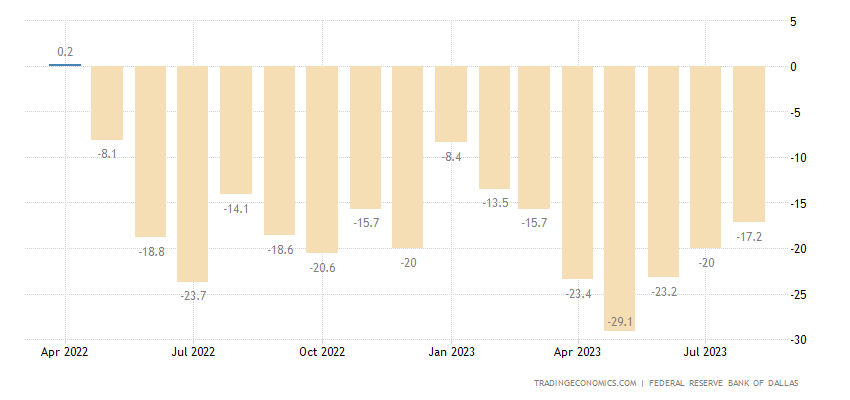
Рic. 9
And in the service sector of the same region – 16 months in a row:
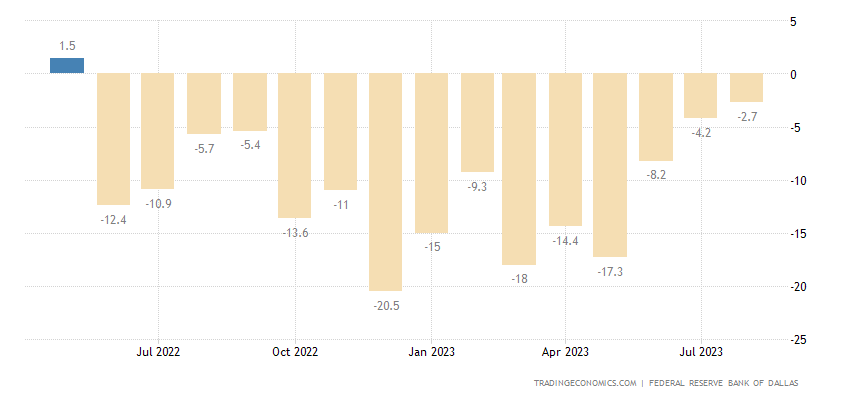
Рic. 10
Kansas Fed Composite Index (all sectors) – 12 consecutive months:
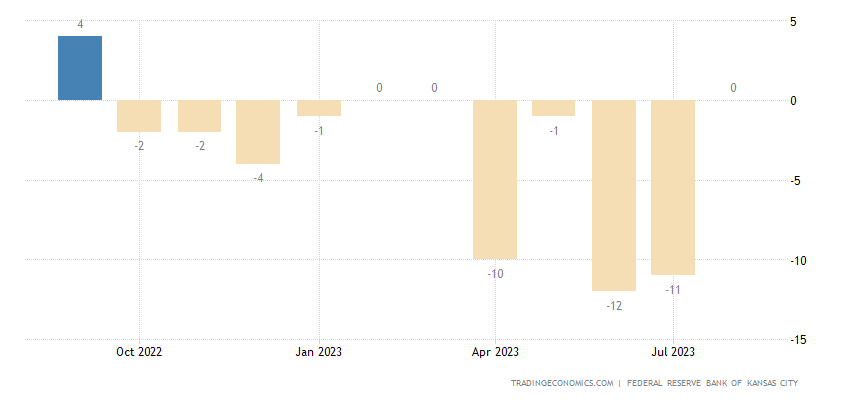
Рic. 11
Chicago PMI – 13 months in a row:
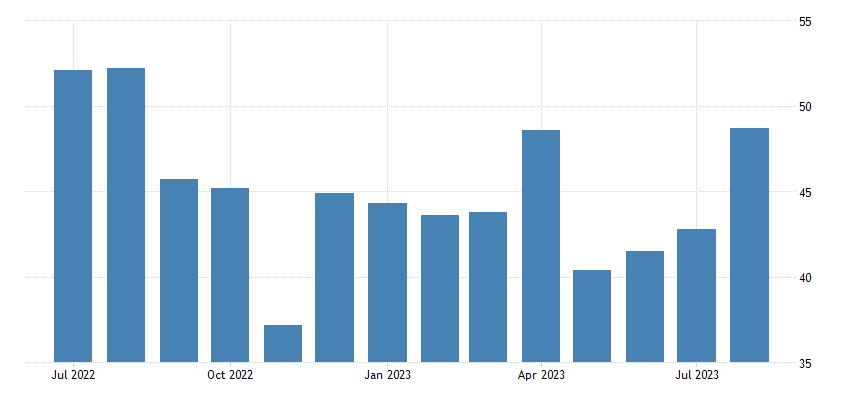
Рic. 12
Sales of new buildings in the US are at their lowest in 5 months:
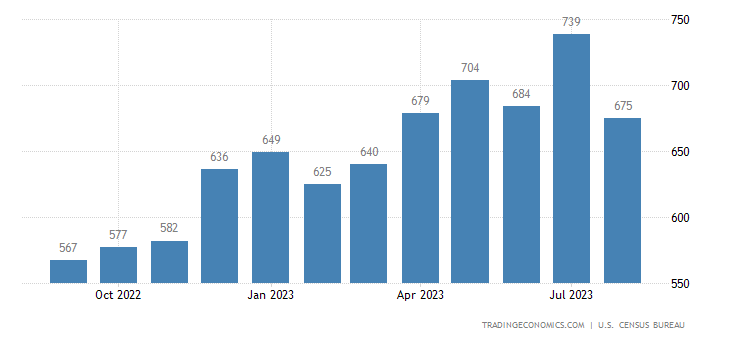
Рic. 13
Pending sales of existing homes in the US -7.1% per month:
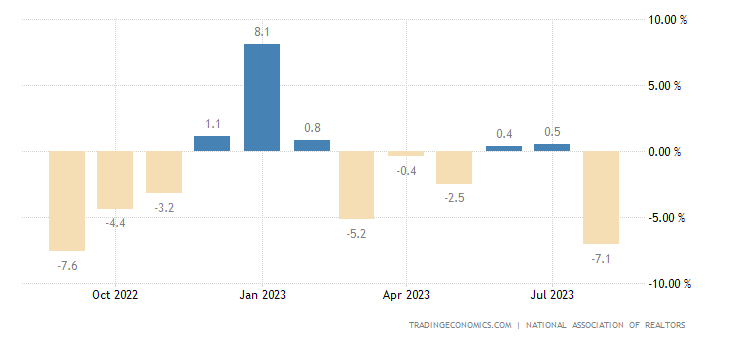
Рic. 14
And -18.7% per year – the 27th minus in a row:
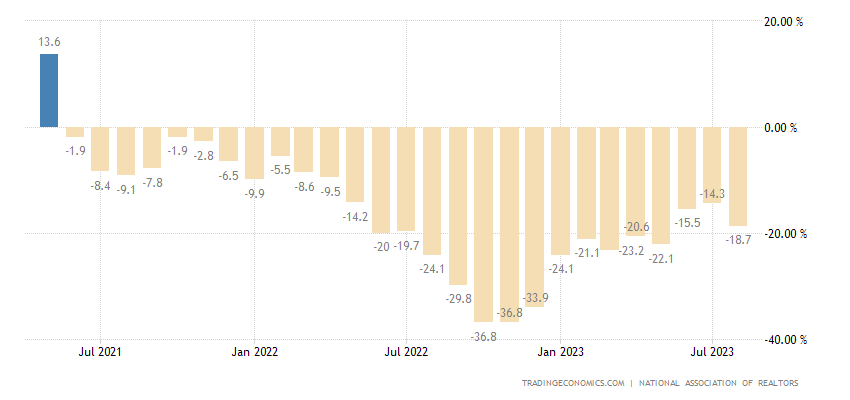
Рic. 15
The index value itself is the worst in history, not counting the number for April 2020 (and even before that only 4%):
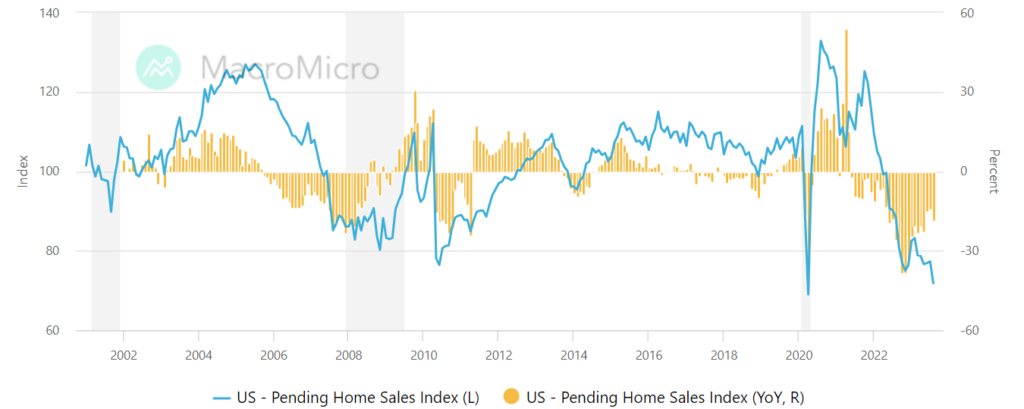
Рic. 16
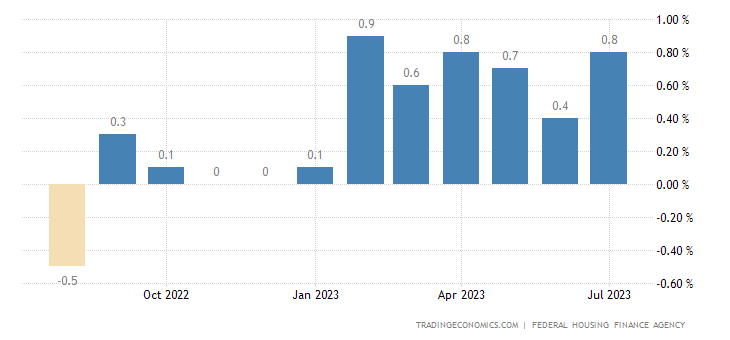
Over the past six months, the average increase in housing prices in the United States, according to a private review, is +1.1% per month:
Рic. 17
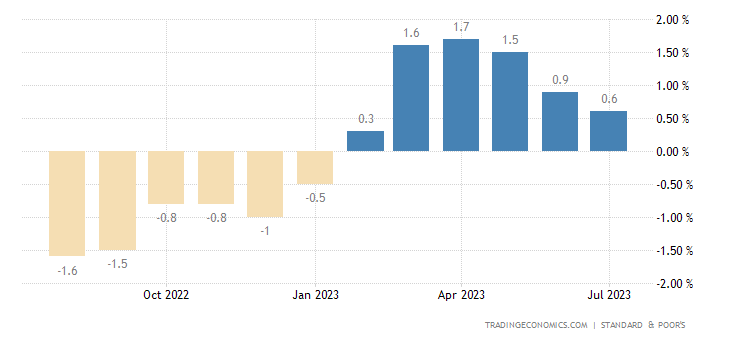
The government source also gives a not small +0.7% on average per month for the same period:
Рic. 18
The 30-year mortgage rate in the US has reached a 23-year peak (7.41%):
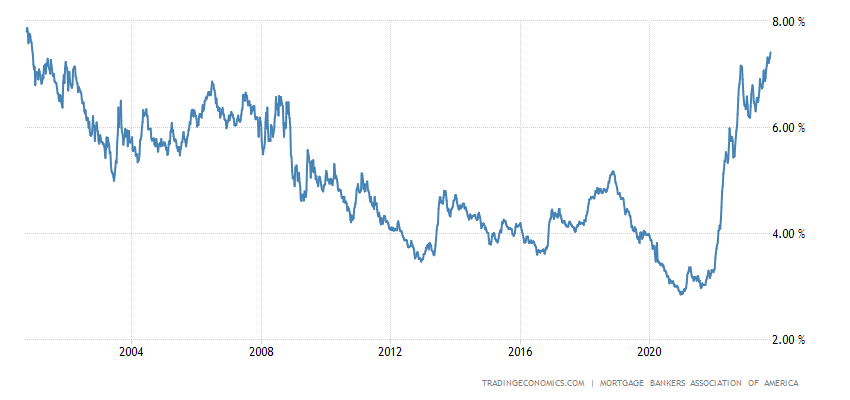
Рic. 19
The same picture according to Freddie Mac – 7.31%, 23-year high:
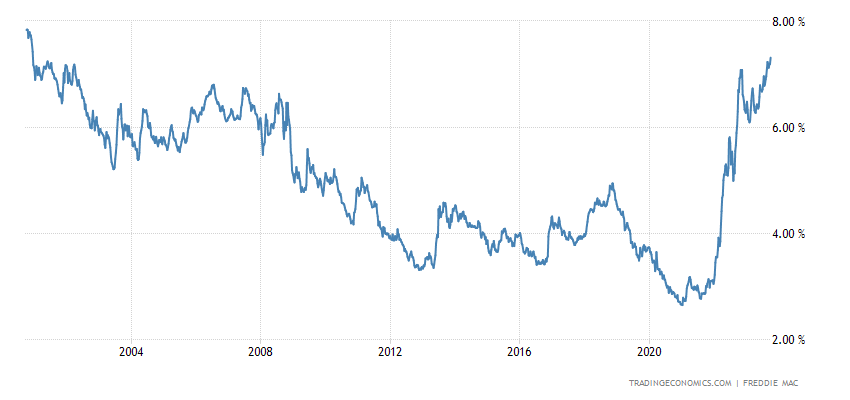
Рic. 20
The yields on long US government bonds have similar dynamics:
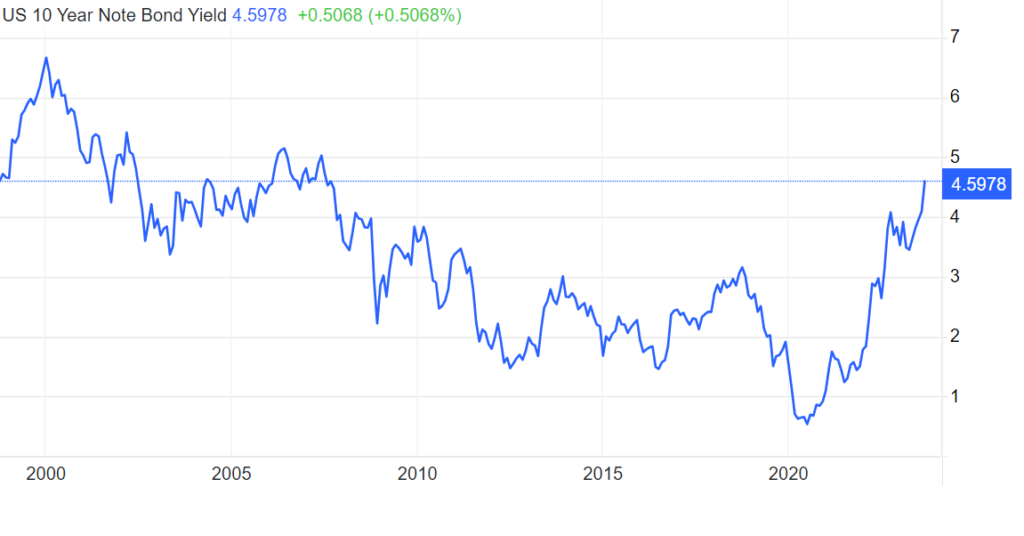
Рic. 21
But there is no recession in the USA yet, just like there is no recession! What do you! You can’t even think about it.
The number of new buildings in Japan -9.4% per year – the 3rd minus in a row, the 6th in 7 months and the 9th in 11 months:
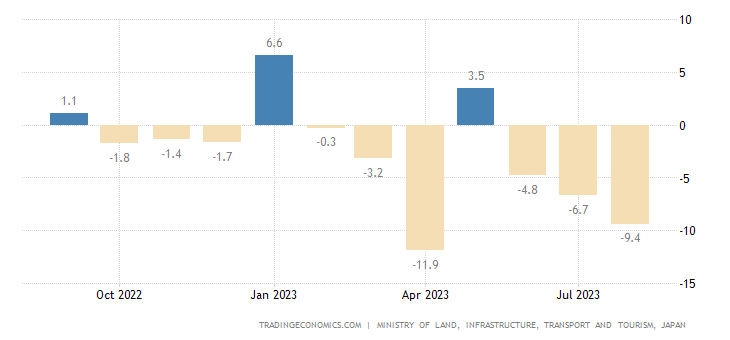
Рic. 22
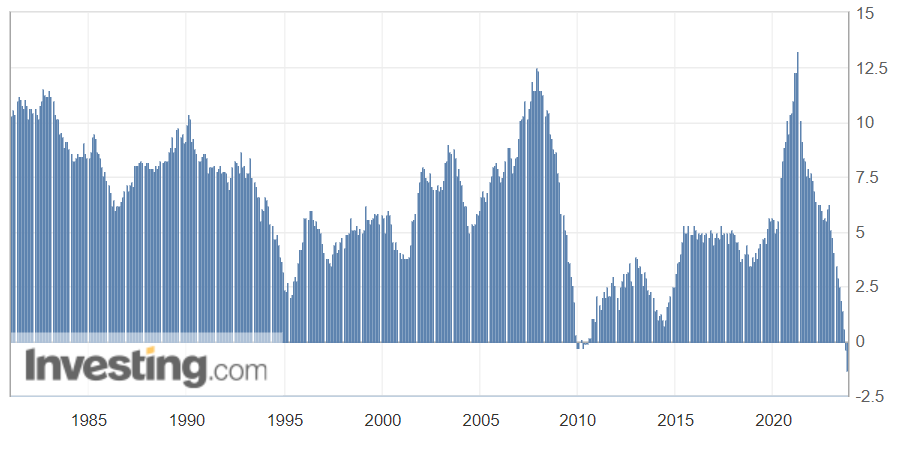
PPI (industrial inflation index) of Spain -10.0% per year – a record low in 48 years of data collection:
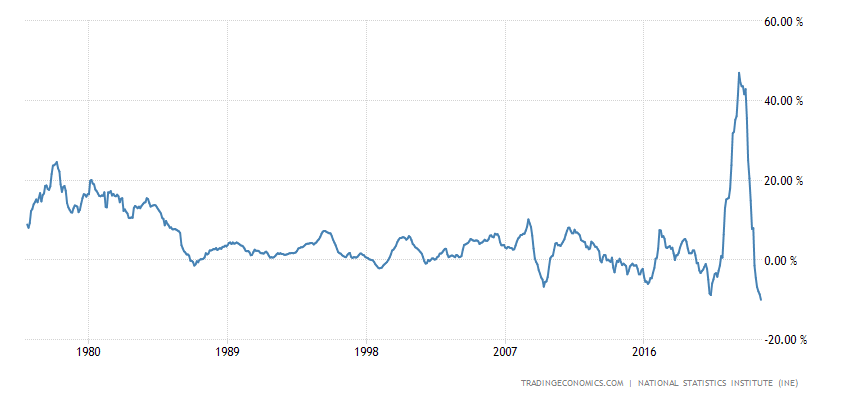
Рic. 23
In Italy -12.2% per year is also a record weak value:
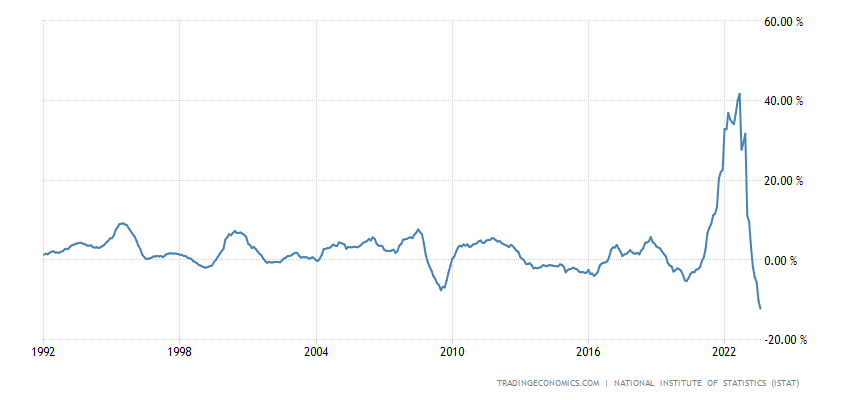
Рic. 24
Import prices in Germany -16.4% per year – 37-year bottom:
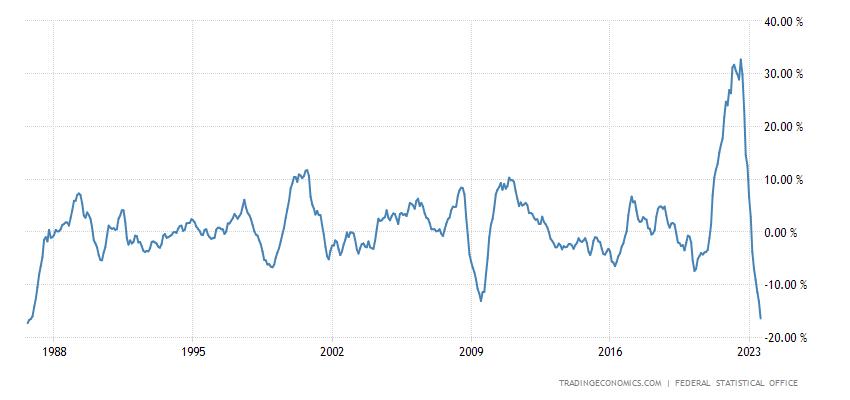
Рic. 25
Eurozone household loans +1.0% p.a. – 8-year minimum annual change:
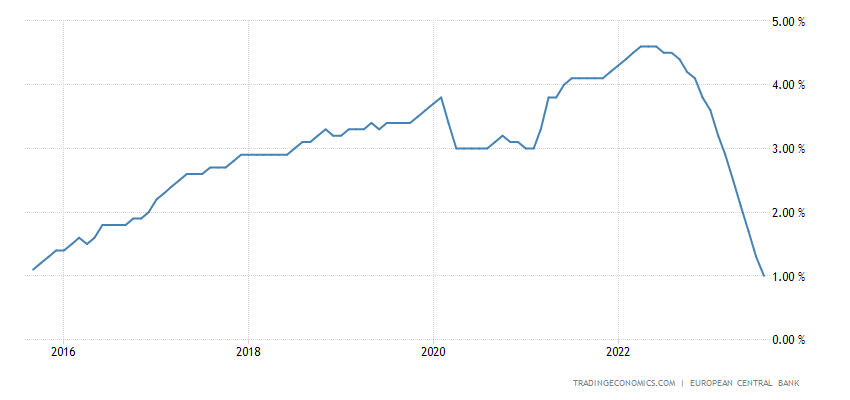
Рic. 26
Loans to the non-financial sector +0.6% per year – also the bottom since 2015:
Рic. 27
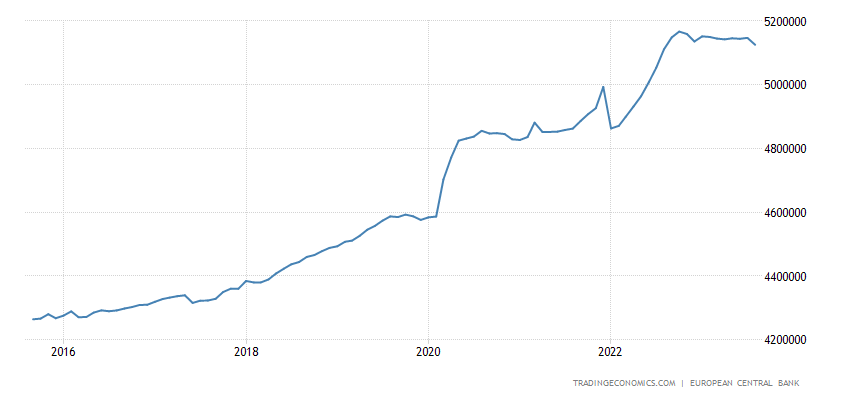
The M3 money supply is -1.3% per year – the worst dynamics ever recorded for all 43 years of statistics:
Рic. 28
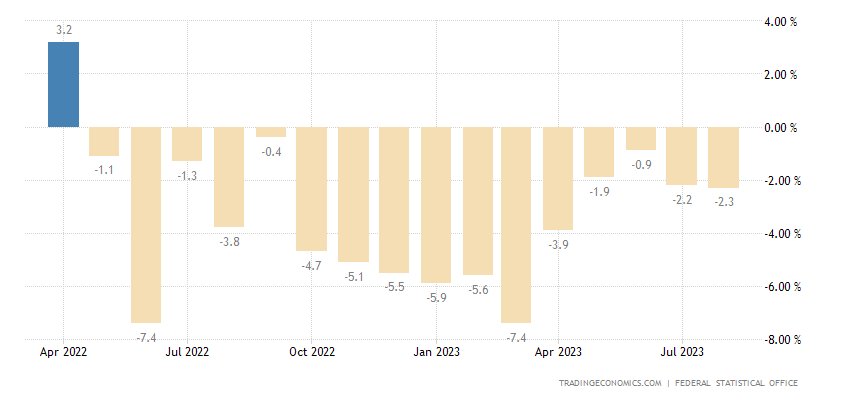
Retail sales in Germany -2.3% per year – 16th negative in a row:
Рic. 29
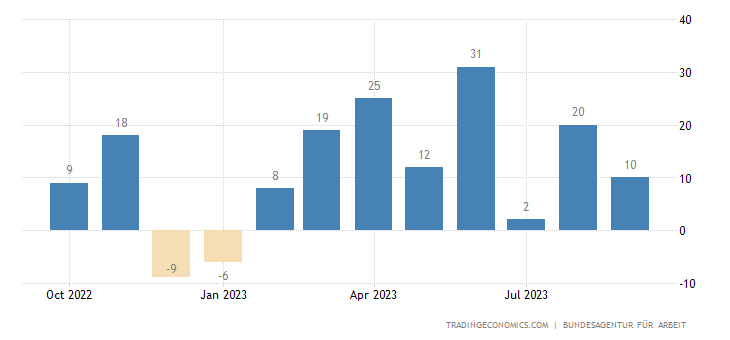
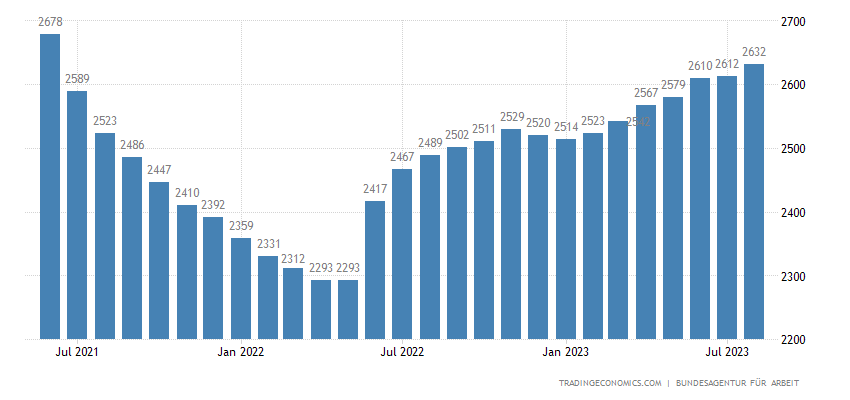
The number of unemployed in Germany has been growing for 8 months in a row:
Рic. 30
And for the maximum time in more than 2 years:
Рic. 31
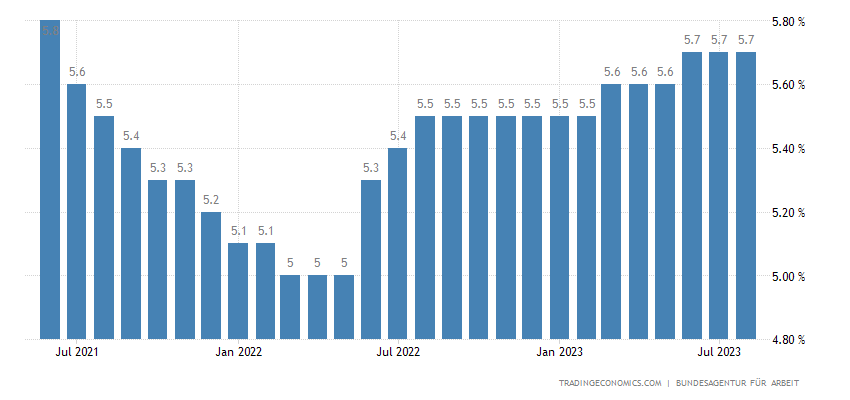
As is the unemployment rate:
Рic. 32
The number of unemployed in France is the highest in 10 months:
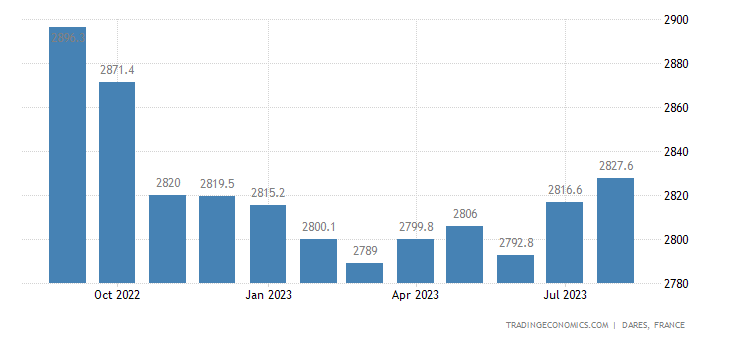
Рic. 33
The Germans are at their most pessimistic in the last six months:
Рic. 34
As do consumers in the eurozone as a whole:
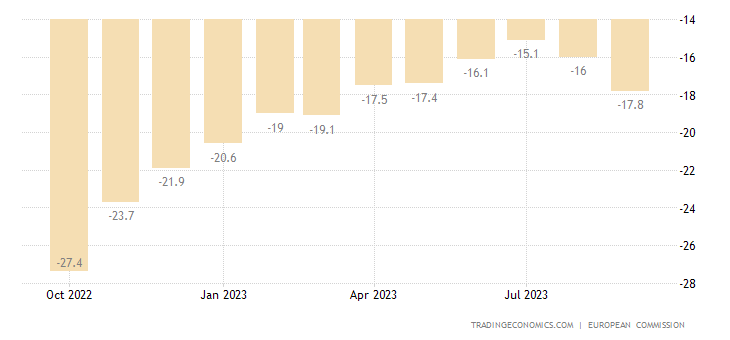
Рic. 35
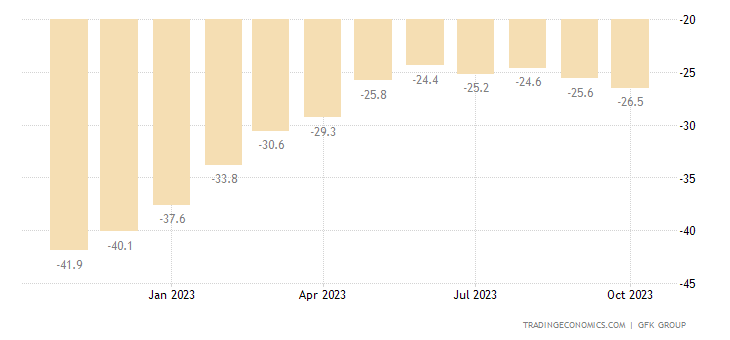
And the French – in 5 months:
Рic. 36
Do I need to explain that there is no downturn or recession in the EU either?
The Central Bank of Mexico kept its monetary policy unchanged.
Main conclusions. Taking into account the amount of negative data, various indirect indicators may not be shown. The structural crisis is developing in all its glory. But, as we noted in the previous section, there is officially no “recession” (no matter how wrong this word is).
It’s not even very clear what can be said here. I can’t help remembering a story from about fifteen years ago, when the head of the Bureau of Economic Analysis (formally, a private structure responsible for determining GDP and the GDP deflator) answered questions from journalists after his structure produced a quite decent value for economic growth and an extremely low value for the deflator.
Journalists naturally asked how it happened that the GDP deflator is much smaller than both PPI and CPI indicators (usually the deflator is between them). And received a confident answer that the BEA is responsible for the deflator, and the Bureau of Labor Statistics of the US Department of Labor is responsible for PPI and CPI, and that’s who they need to ask…
So there will be no answer from officials to you, citizens. But from us, the Khazin Foundation, it will not only be available, it will be presented regularly. And therefore, our readers can relax on weekends and work happily during the work week!