
July 1-7,2023
Big news. We believe that the basis of the news is the actual recognition of a serious industrial downturn in the US and Western Europe (the latter was spread over several months). The list of charts in the next section of the Review suggests that the decline is already in a fairly active form.
Here we need to repeat once again: we place only official data in the reviews. Sometimes, when they do not correspond to reality at all, we warn about this and make appropriate assessments, but we ourselves do not publish any “real” data. Since this is a vicious path, deviations accumulate on it and make the “corrected” data even more inadequate than the original official figures.
At the same time, our assessments of the situation in the global and American economies give reason to believe that the recession in the United States began in the fall of 2021, and now it has reached 6-8% of GDP per year. But since this indicator itself is of an accounting nature, it can vary quite a lot, for example, by converting an increase in the capitalization of financial assets into an increase in balance sheet income. Therefore, a more or less accurate formulation sounds like this: if we fix the share of financial assets in GDP in relation to real ones, then GDP falls.
Hidden is the fall of the real sector of the economy, mainly due to underestimation of consumer inflation. The industrial sector has already gone into deflation (see previous reviews), and here there is an underestimation only in certain sectors. For this reason, it is extremely difficult to accurately assess the effect of this factor. But since the Western economy is undergoing a classic structural decline, we believe that the rate of decline this year will approximately coincide with the rate of last year, and this means that, on an accrual basis, since the beginning of the year, the decline in the real sector in the United States amounted to 3-4 percent over 6 months. In the EU, everything is more complicated, since Germany and France are pulling out their GDP at the expense of the other countries of the union, despite the fact that they are additionally losing industry due to the loss of access to cheap raw materials.
Most likely, some acceleration of the industrial decline is due not to the objective situation (during a structural crisis, the decline rates are quite stable), but to the fact that they were underestimated in previous months. At the same time, the calculation was that in a fairly short time the decline would be replaced by growth and this distortion could be corrected. In reality, the decline continued and the accumulated distortions grew so much that it became impossible to ignore them. Accordingly, it was necessary not only to show the decline, but also to strengthen it a little – so that the distortions in statistics are not so conspicuous.
Macroeconomics. Orders in the German industry -4.3% per year – the 15th monthly loss in a row:
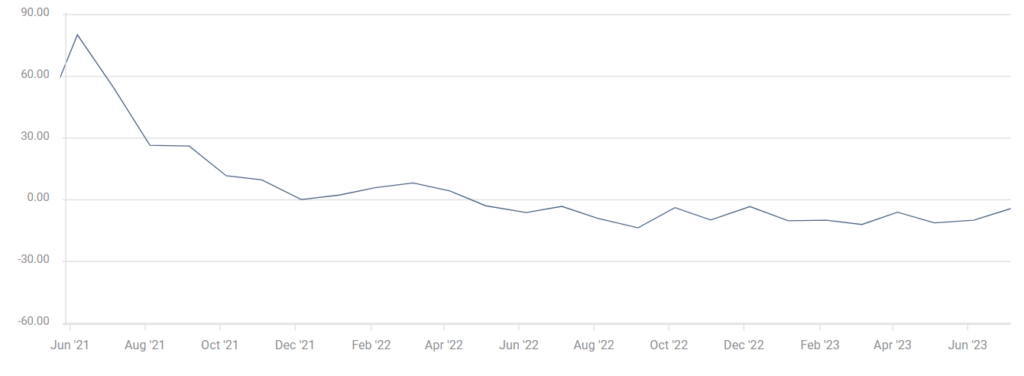
Pic. 1
US Industrial Orders excluding volatile transport -0.5% m/m – 4th negative in a row and 6th in the last 7 months:
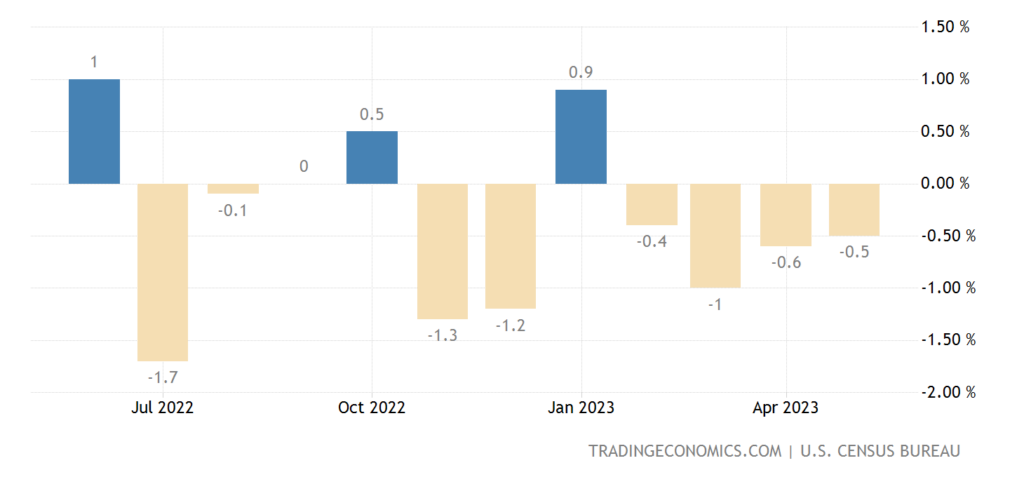
Pic. 2
PMI (expert index of the state of the industry; its value below 50 means stagnation and recession) of the eurozone industry 43.4 – without taking into account the failure of 2020, this is the bottom since 2009:
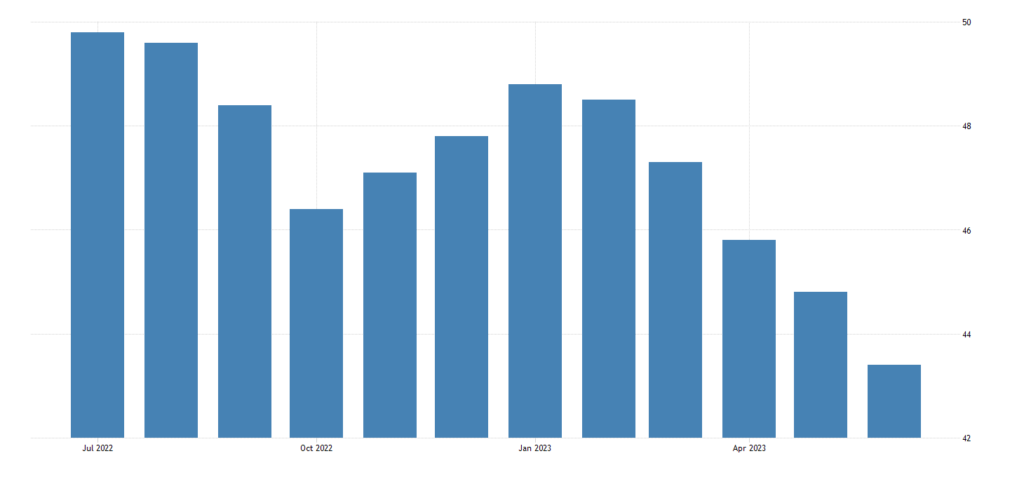
Pic. 3
Same picture in USA (46.0):
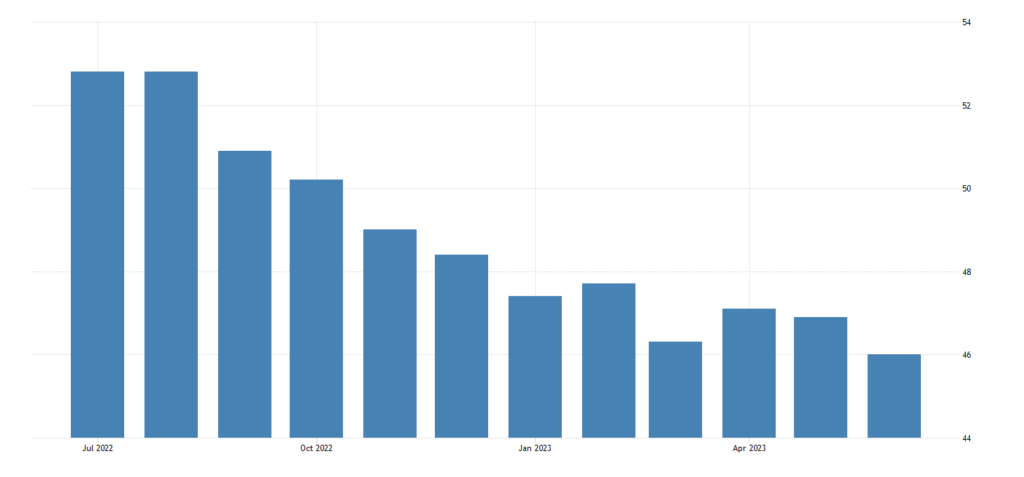
Pic. 4
In China, the PMI of the services sector slowed to a 5-month low, but so far in the growth zone (53.9):
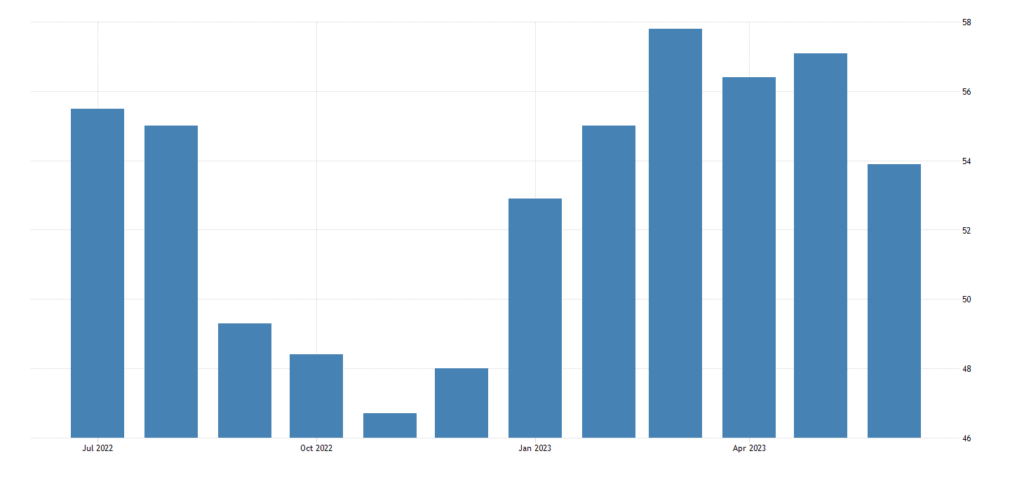
Pic. 5
The same in the Eurozone (52.0):
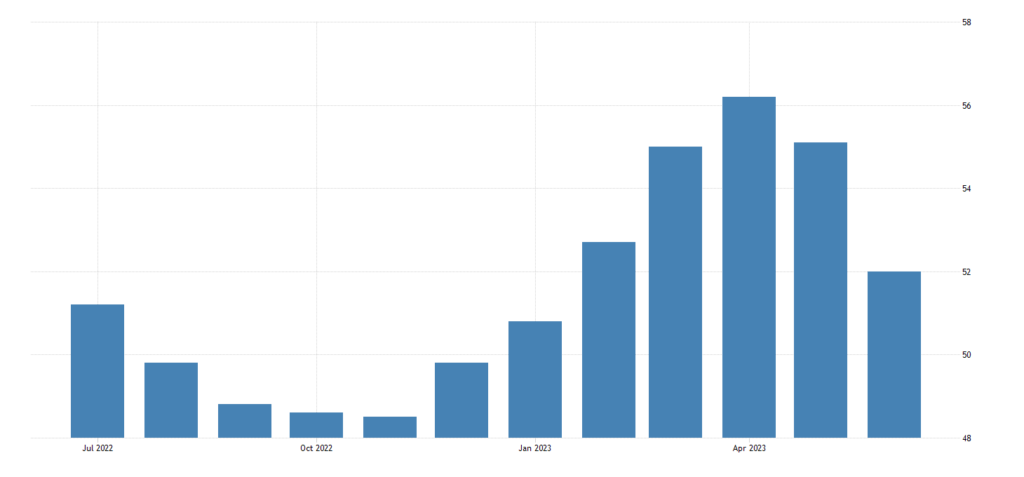
Pic. 6
The U.S. Logistics Managers Index (a recent indicator) is the worst in 6.5 years of observation (45.6):
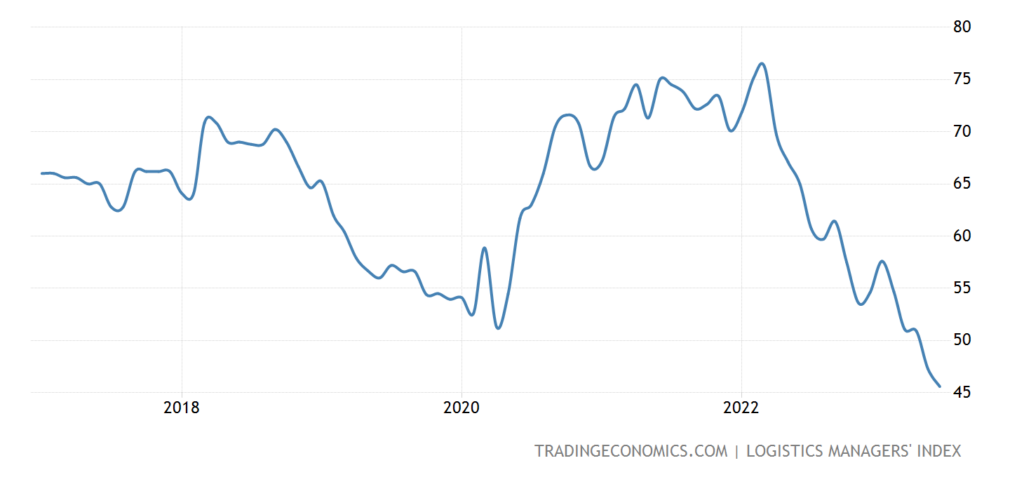
Pic. 7
Canada has a close to record foreign trade deficit, exports at the bottom for 1.5 years:
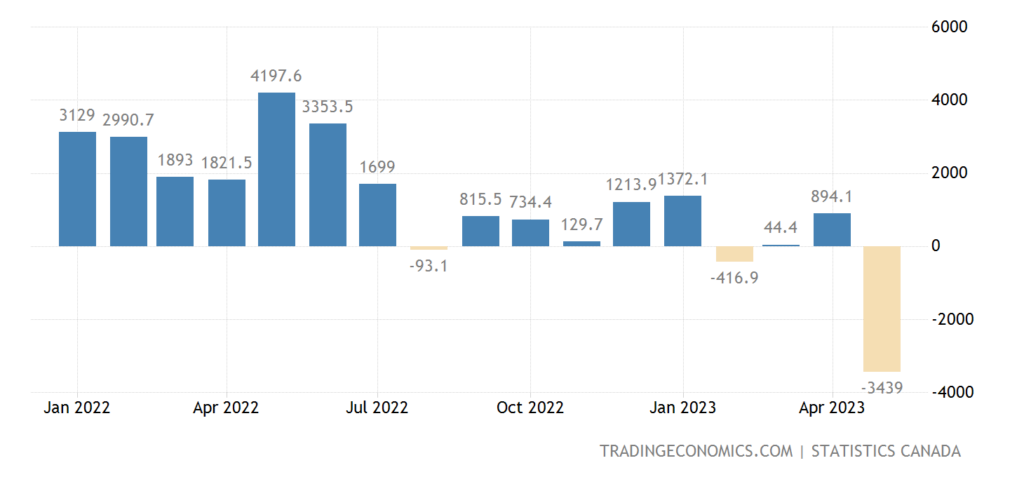
Pic. 8
House prices in Britain -2.6% per year – at least for 12 years:
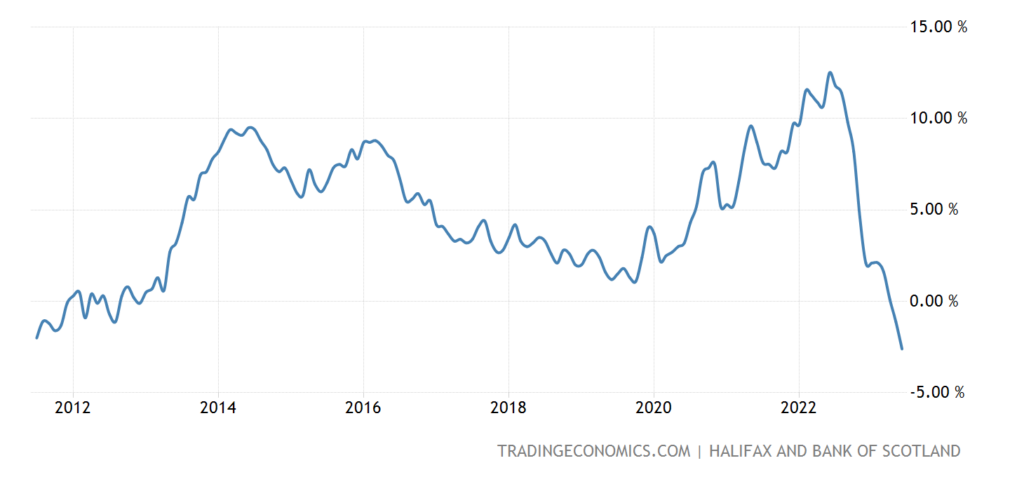
Pic. 9
And the mortgage rate there is 7.54% – a 16-year peak; another +0.2% – and there will be a 25-year-old:
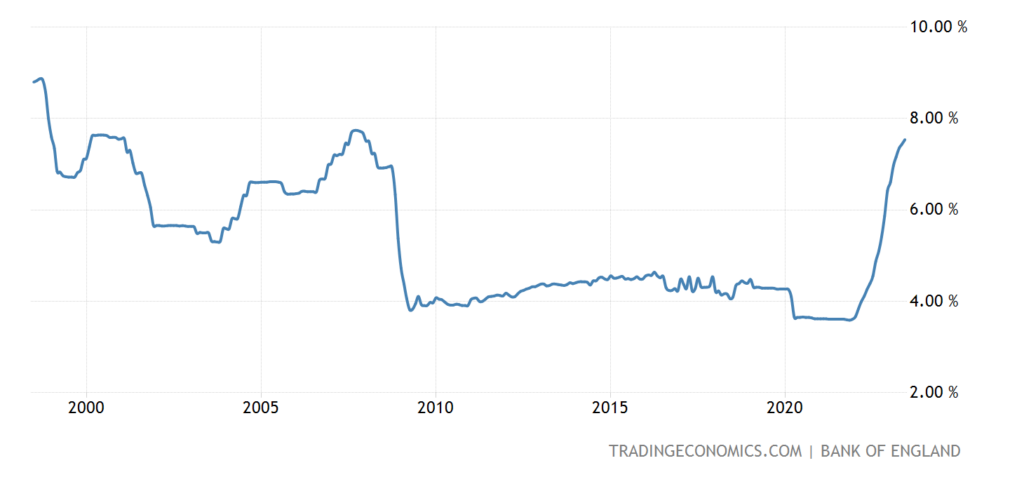
Pic. 10
Unemployment in Canada unexpectedly rose to a maximum in 1.5 years (5.4%):
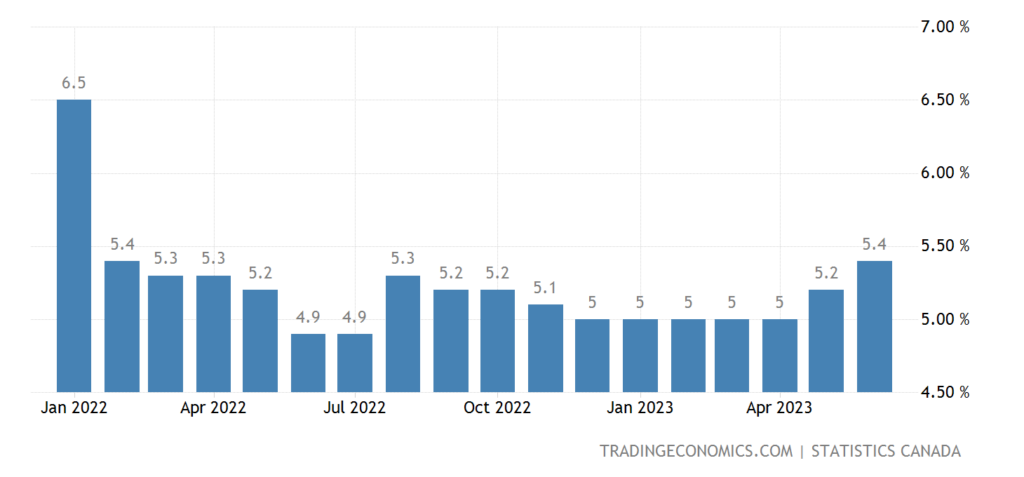
Pic. 11
Job growth in the US in June is the lowest in 2.5 years (+209 thousand):
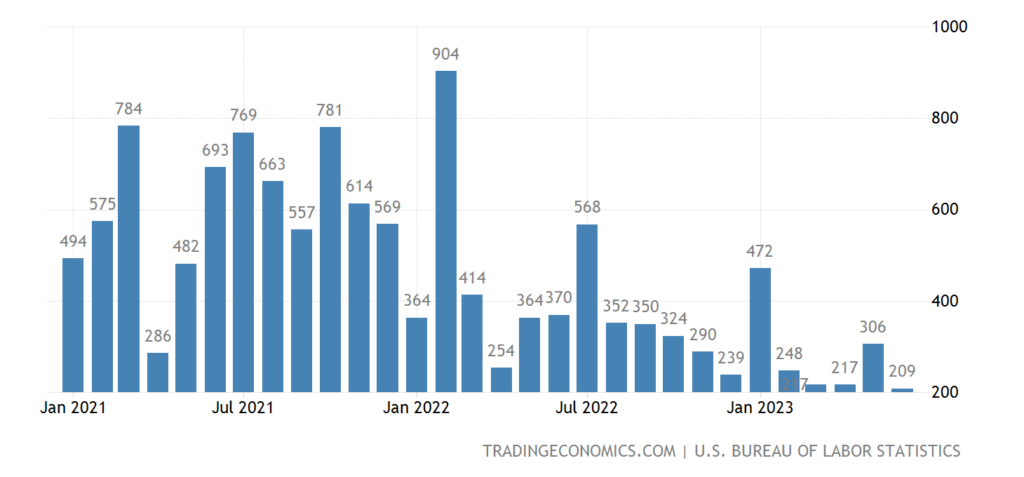
Pic. 12
However, labor statistics in the US (and therefore in Canada) are always highly distorted, see the last section of the Review.
Retail sales in the eurozone -2.9% per year – the 8th negative in a row and the 11th in the last 12 months:
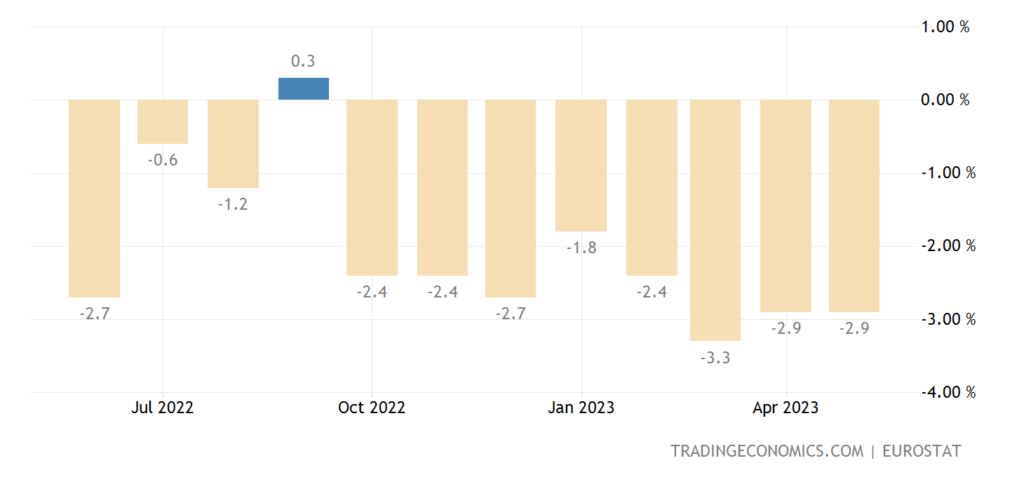
Pic. 13
Japanese household spending -1.1% per month – 4th consecutive loss:
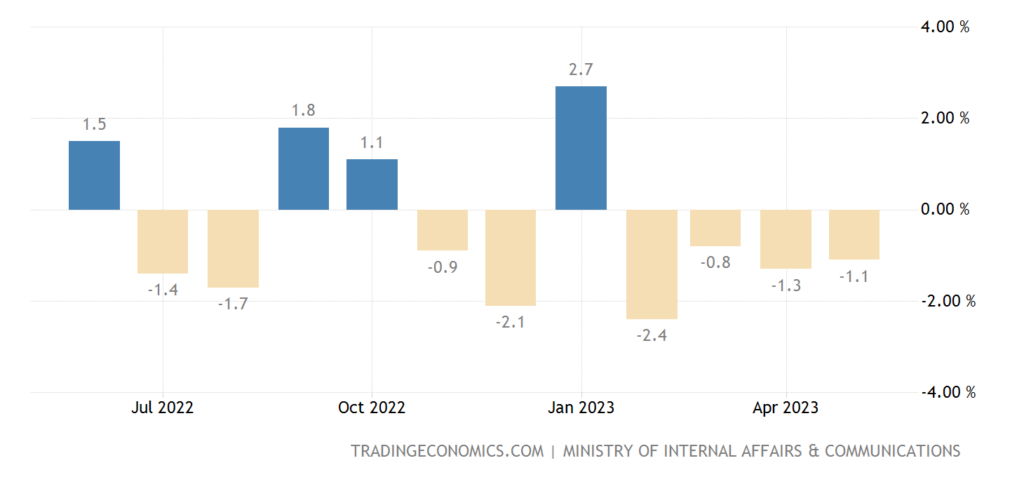
Pic. 14
And -4.0% per year — the 3rd negative in a row:
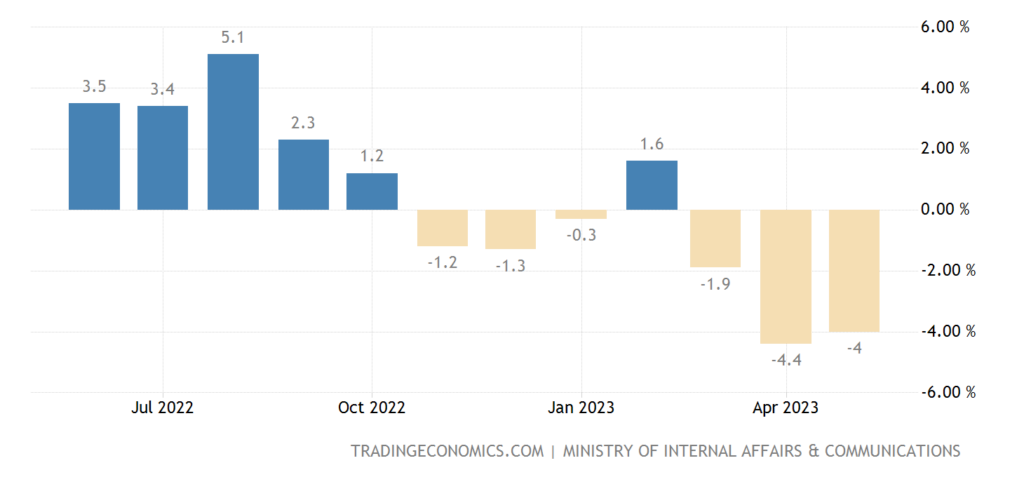
Pic. 15
The Central Bank of Australia has left rates in place, but promises to continue tightening policy.
The minutes of the last meeting of the US Federal Reserve confirmed the readiness of the majority of board members to resume monetary tightening after a short pause.
Main conclusions. To begin with, one of the illustrations of why we do not really trust labor statistics, the red curve is the number of people employed in thousands of people:
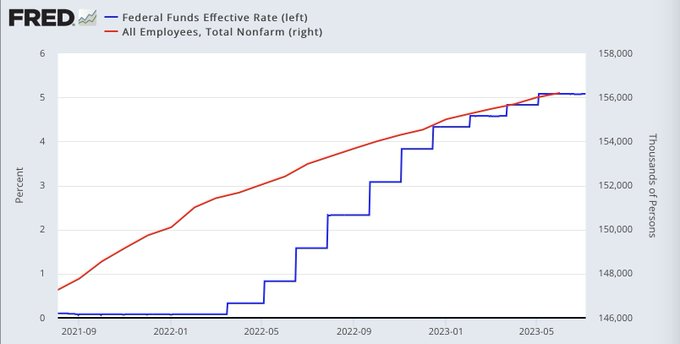
From the point of view of any economic theory (even liberal ones), an increase in the rate causes a decrease in employment. In fact, there is growth, although it slows down as the rate rises, but quite slowly. Theoretically, of course, this is possible, but it raises questions. We will monitor the situation.
As for the Fed meeting, the main thing is the recognition of an almost inevitable “recession”: “The US Federal Reserve expects the start of a recession in the US economy later this year, predicting a contraction in the country’s GDP in the fourth quarter of 2023 and the first quarter of 2024.” We put quotation marks because “recession” is a term of the cyclic theory of crises, which is not applicable to the current structural crisis. The recession, as we noted in the first section of the Review, has been going on in the US since the fall of 2021, in the EU, most likely, since the beginning of 2022.
As confirmation, it can be noted that the number of corporate bankruptcies in Germany has increased significantly. More bankruptcies were registered in June than at any time in the previous seven years. A total of 1,050 partnership and corporate bankruptcies were filed in the first month of the summer, the Halle Institute for Economic Research (IWH) said in its investigation. This is 16% more than in May this year and 48% more than in June 2022. True, bankruptcies that occurred due to insidious quarantine are just being processed, so this figure will need to be checked for several more months.
But in general, the structural crisis continues in full accordance with the theory. It is impossible to stop it, but by understanding its structure, you can use its mechanisms to the benefit of your business. So our readers can rest easy on the weekend and prepare for the upcoming vacation.