
Time period: 5-11 March 2022
Top news story. The most striking event was the statement of Josep Borrell on the air of the radio “France Info” that the abilities of the European Union to increase sanctions have dried up:
The EU has reached the limits of its ability to impose financial sanctions against Russia. The sanctions have imposed a heavy burden on the Russian economy. We have done all we can, unlike the United States, Europe cannot so easily give up Russian oil or gas.
The reasons for this are described in the next section of the Review, but note that only a part of the indicators (mainly inflationary) refer to the period at the very end of which the Russian special operation in Ukraine began.
At the same time, the main task of the US in the framework of the sanctions policy – ensuring the outflow of capital from the EU – has become clear to an increasing number of experts, for which it is sufficient to look at the corresponding graph:
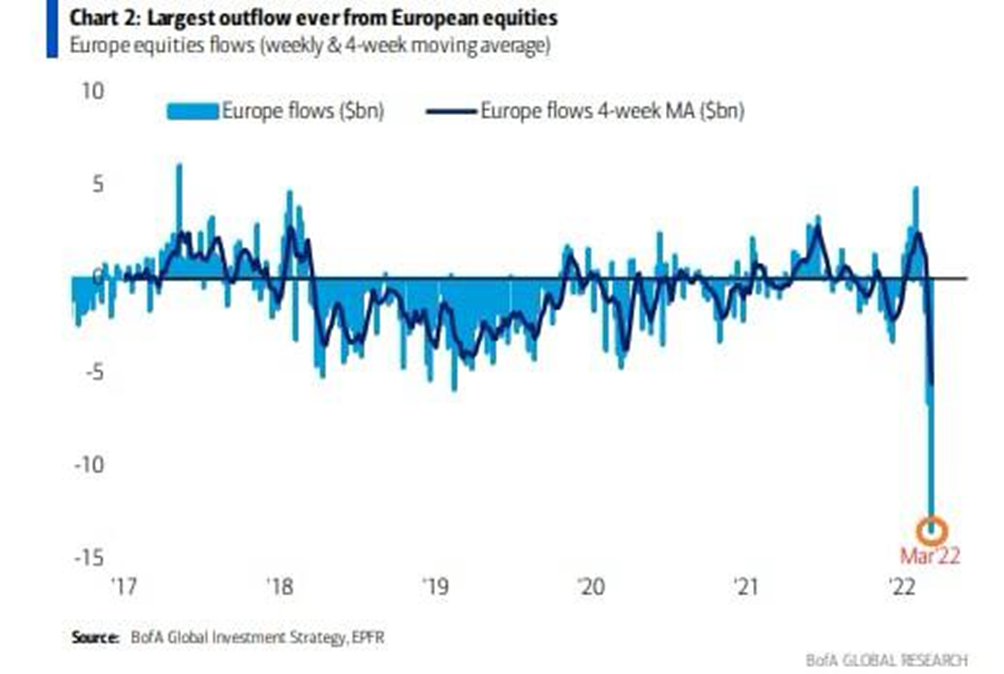
With statistics likely to be significantly worse by the end of March, the crisis trends are on the rise worldwide. Thus, sanctions activity turns not so much into a purely economic confrontation, but in a competition of volitional skills. Here, there are strong reasons to believe that the EU will have to surrender first. At least because there are too many alternative forces and competing groups. It will be enough to pay attention that during the visit of US Vice President K. Harris to Poland during the press conference with the President of Poland, there were no EU flags in the hall.
Macroeconomics
Industrial production in Italy -3.4% m/m and -2.6% y/y, both worst in 1.5 years:


Warning! The data are for January, before the beginning of the operation in Ukraine! The same applies to the following similar figures.
Brazil’s industrial output -2.4% m/m, for the last year there were only two positive values:

And -7.2% per year, that’s the 6th consecutive negative:

Turkish industrial production -2.4% m/m:

Japan Economy Watchers Survey Index hits half-year low:

And business confidence in Japan is the weakest in almost 2 years:

And here is the data for February.
Small business sentiment in the US is the worst in 13 months:

And economic optimism is the weakest since 2013:

China’s trade surplus is growing strongly, including with the US:

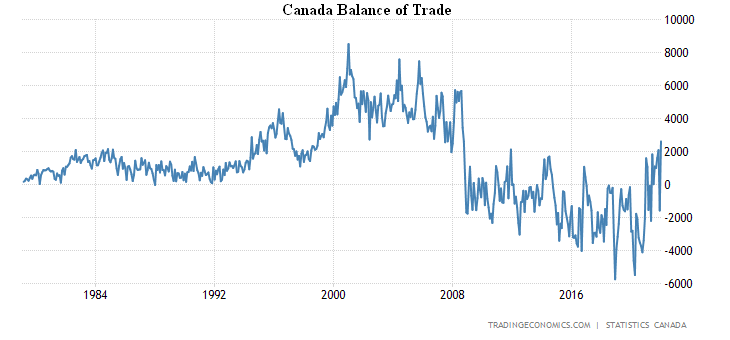
Canada has a record surplus since 2008:
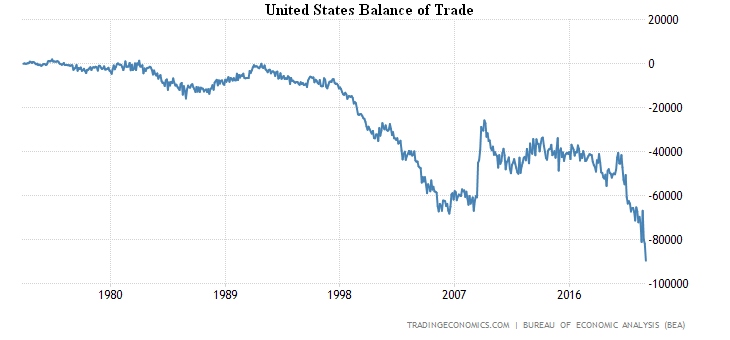
But in the US there is a record deficit:
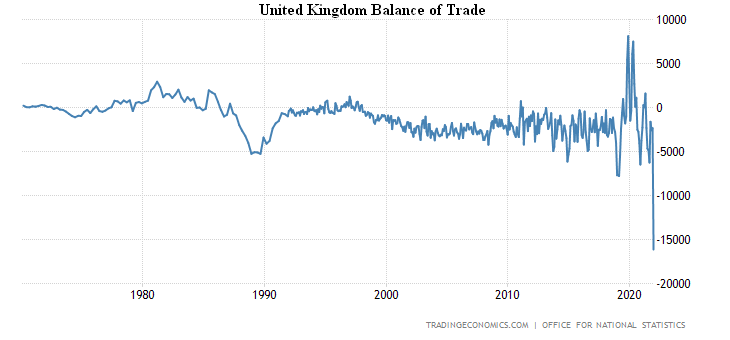
The same in Britain:
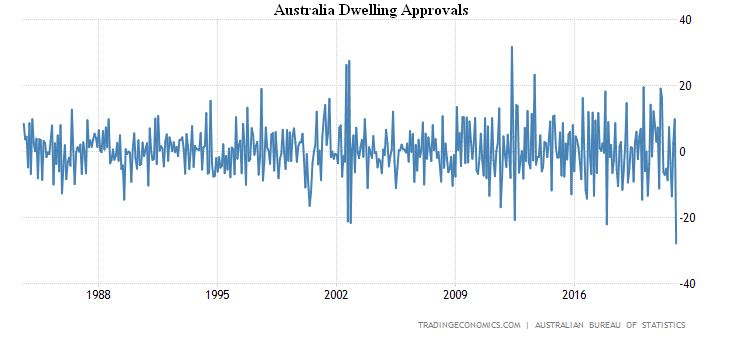
Dwelling approvals in Australia -27.9% per month, anti-record for 39 years of survey:
And then the inflation data begins, and frankly, they look terrible.
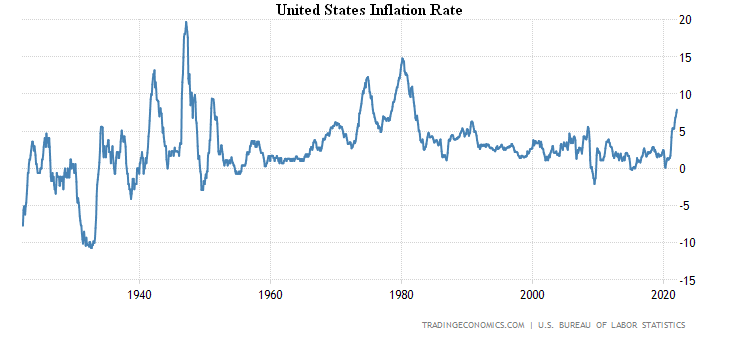
US CPI (Consumer Price Index) +7.9% per year, at its highest level in 40 years:
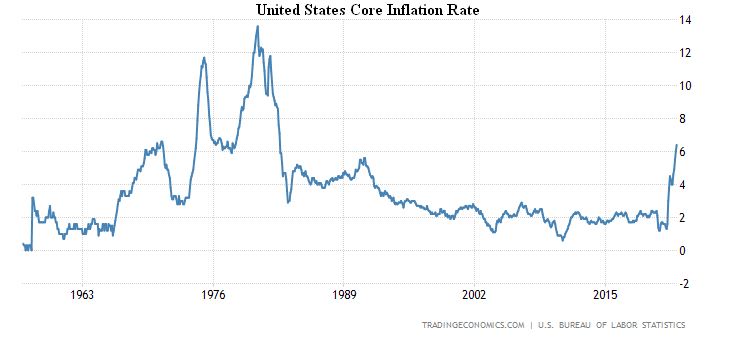
Core inflation (less food and energy) is also at its highest in 40 years:
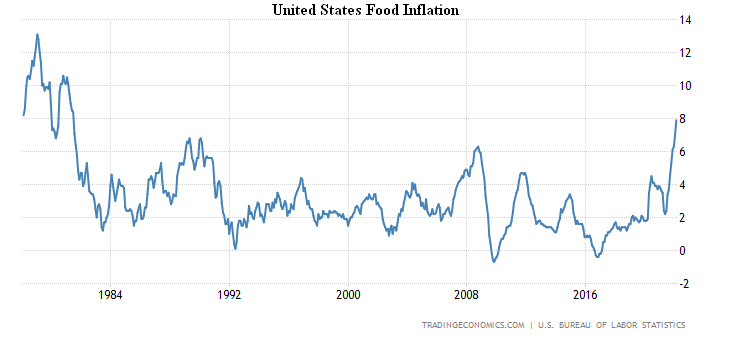
The cost of food has increased by 7.9% per year, which is the peak since 1981:
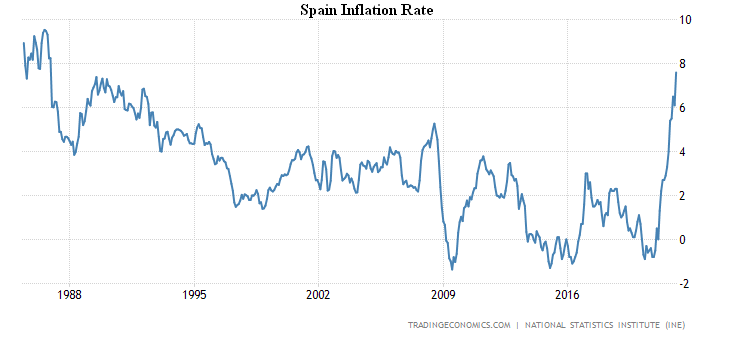
Spanish CPI +7.6% per annum, peak in 36 years:
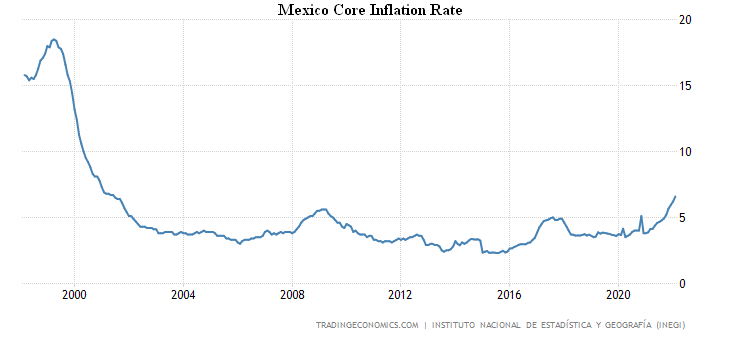
Mexico core inflation rate +6.6% per annum, top since 2001:
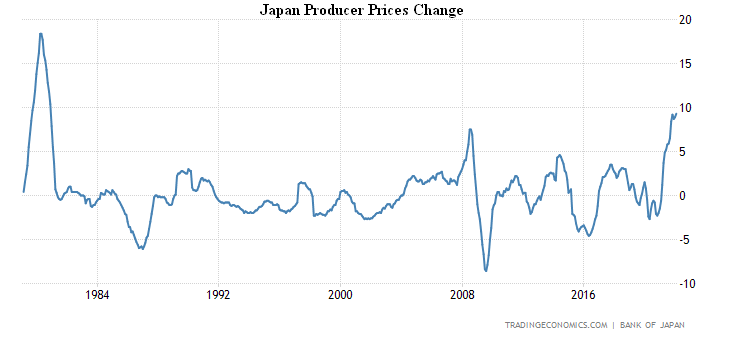
PPI (Producer Price Index) of Japan +9.3% per year, the highest since 1980:
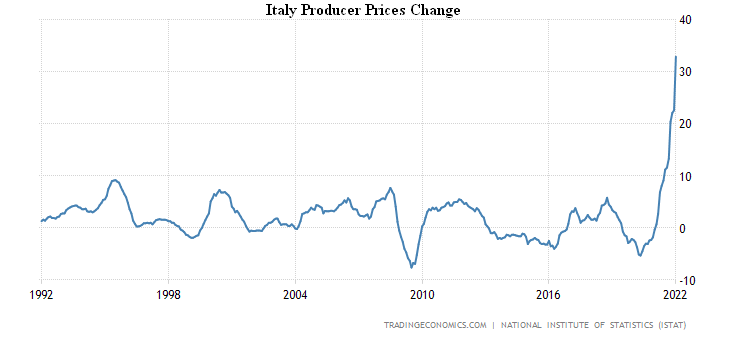
PPI Italy +32.9% per year, which is a record for 30 years of observation, while in the domestic market the figure was +41.8%:
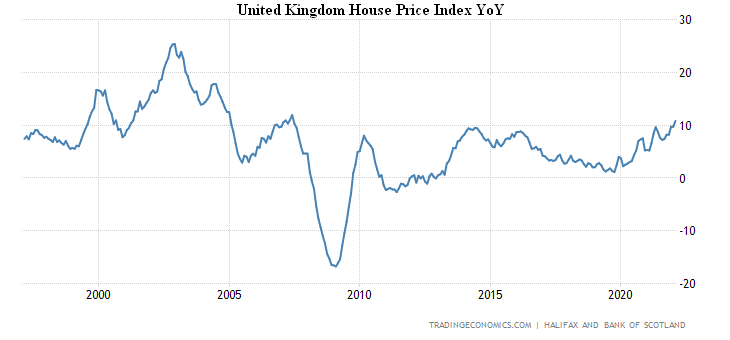
House prices in Britain +10.8% per year, which is a 15-year high:
Consumer credit in the US was the weakest for the year:

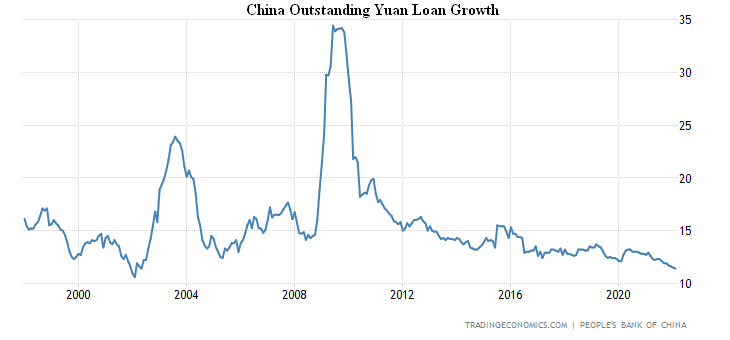
Loans in China +11.4% per year, the slowest rate in 20 years:
Australian consumers are most pessimistic for half a year:

Whereas in the US, consumer confidence is the weakest in 11 years:

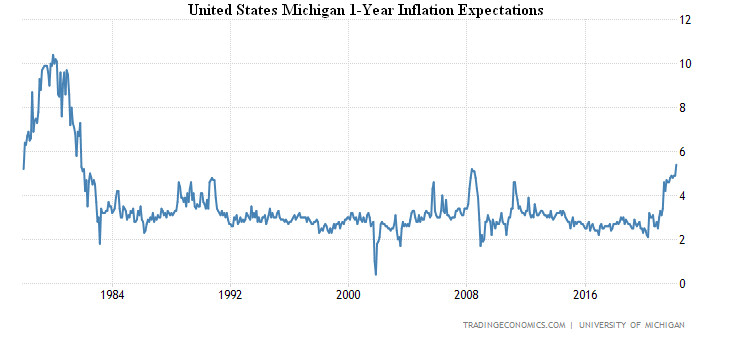
At the same time, the inflationary expectations of Americans are maximally exacerbated since 1981 (+5.4%):
Japanese household spending -1.2% per month:

Retail sales in Italy -0.5% per month:

Retail sales in Turkey -1.5% m/m, 2nd negative in a row:

Retail sales in Brazil -1.9% per year, which is the 6th consecutive negative:

The ECB left the rates unchanged, but began to roll back incentives much faster.
Summary. We recall that our reviews do not provide all statistics, but only those that are either off track or show clear trends. The usual fluctuations of indicators are of no interest, they are not suitable for concluding anything on them. Thus, the trends we observe show that the structural crisis has already taken over the entire economy, and to shift responsibility for the crisis to Russia (as Biden said) is at least naive.
It is more accurate to say that the objective process of crisis has generated a reaction in different countries, and if Russia and the US (each in its own way) try to comply with this process, the EU and its individual countries try to ignore it. The sanctions process caused by Russia’s desire to bring its area of responsibility in order – it is now clear that Ukraine was already preparing an operation against Russia in early March, and questions about the development of biological and nuclear weapons in that country are becoming increasingly complex – is a consequence of, but not a cause of, the crisis.
As the extraordinary meeting of the Fed’s board of governors a month ago showed, no constructive response to the crisis could be found. And this means that the most convenient and useful solution for the US was an event that could have served as a formal occasion for a public-sector crisis. This, in fact, Biden showed.
The obvious consequences of the Ukrainian crisis in the macroeconomic sphere will appear in the coming weeks, but it is already clear that the real picture will be around mid-May. For the time being, it will only be possible to note a temporary deterioration of some indicators – that is why we do not provide data on the price of gas in the EU or world oil prices. Yes, they are critical, but let’s watch the situation for at least two months, otherwise the picture will be completely incomplete.
At the same time, all events, including sharp changes in the situation (mostly negative) will somehow be associated with the crisis in Ukraine, for this reason, it will be difficult to assess them objectively. Therefore, we can state only one thing at the end of the past week: negative processes in the world economy have become faster, but we cannot yet give a precise assessment of the scale of this phenomenon. At the same time, the process of differentiating the world economy by currency zones seems to have accelerated.
We wish our readers a successful working week!