Contents
- Root causes of the crisis. The fading of the liberal economic model.
- The US real sector and the global financial elite, their position and interests during the crisis
- Trump plan and Biden plan. The tug-of-war between the global financial system and the real US sector for financial support. The outcome of the game in an annex to Germany.
- Economic conditions in Germany.
- Dynamic modelling.
- Modelling the results of the plans.
- Sources of US economic statistics.
- Sources of German economic statistics.
Report
- Root causes of the crisis. The fading of the liberal economic model
By the 1970s, the Bretton Woods system, whose principles had been laid down in 1944, had exhausted its natural development. Lending through the Bretton Woods institutions (IMF and the World Bank), compliance with GATT rules (the future WTO) and other instruments have dried up in the US-controlled part of the world economy. As a result, on August 15, 1971, the United States was forced to stop pegging the dollar to gold, and the crisis of the 1970s began. Assessing it seems to be a rather difficult task because statistical methodologies have changed several times since then. The analysis of the Mikhail Khazin Foundation for Economic Research shows that the 1970s were a period of continuous economic decline in the «Western» (i.e., subordinate to the Bretton Woods model) division of labor.
According to the theory we are developing (see M. Khazin «Crisis of capital effectiveness», 2020), this problem had only two solutions: either expansion of the «western» system of division of labor, or – beginning of «extra-economic» (i.e. due to artificial, emission resources) demand stimulus. Preference was given to the second variant, which was named «Reaganomic» in history (although it was prepared under US President Jimmy Carter). This happened because in the 1970s the Soviet (USSR-based) division of labor was unshakeable.
The essence of the «Reaganomics» model was to stimulate private demand through bank lending while refinancing debt at a constantly decreasing interest rate. In 1980, the US Federal Reserve’s discount rate was 18%, but by 2008 it had dropped to almost 0. Probably, the crisis would have happened earlier, but in the late 1980s the Soviet system of division of labor collapsed, giving the western (and since 1991 – world) economy about 10 years of respite (the so-called «golden age» of Clinton), due to the sharp increase in the number of consumers.
The 2008 crisis showed that this resource has also run out. For some time, the US FED printed money, supplying the budget with it and filling the gaps in the banking system, and this resource is still in use, but it is also nearing exhausting. Similarly, within the (already global) division of labor system, the EU is actively using its emissions money to sustain its economy, but the effectiveness of such policies is increasingly reduced (see reviews of the Khazin Foundation). More information on the crisis process can be found in the book M. Khazin quoted above, but in this report we look at the current state of the world economy.
However, the current situation does not seem to be favorable, the real recession cannot be stopped, and the liberal economic model, structured according to the logic of «Reaganomics», has already for more than 10 years been showing its inability to ensure economic growth. The economic crisis continues and all the conditions are in place for it to enter a phase of extreme escalation. From a historical point of view, we are now near September 1929. If demand is cut off financially, this transition will begin immediately, and the efficiency of the economy’s emissions stimulus is declining, necessitating a steady increase in the capacity of the printing press.
During the 2020 pandemic, extensive quarantine measures were carried out in various countries. Large segments of the population did not work or worked remotely, causing a significant decline in production. In fact, the downturn masks a true crisis that should have begun later. However, the coronavirus factor, which did not fit into the standard economic order, catalyzed the development of expected events. Quarantine actions simply triggered a structural crisis in the world economy, similar to the crisis of 1930-32, which led to the Great Depression. For these reasons, as we warned earlier, a rapid economic recovery cannot be expected.
Let us draw attention to the difference between the current situation and that of 1929-32. The stock market was the first to crash at the time, then it partially recovered, and the economic crisis started only in the spring of 1930. The crisis of 2008 was halted by emissions, with the result that the recession began before the collapse of speculative markets. The world economy is not aware of similar cases, so to draw any conclusions on the development of the situation without in-depth modelling, we find it not entirely correct.
Because liberal (mainstream) economic theory does not describe structural crises, the Bretton Woods institutions and policymakers have tried to create a sense of an imminent return to early-year indicators. The hope of an early end to the recession and the beginning of growth did not materialize, and by the end of the summer the recovery from the crisis had virtually ceased (see reviews of the Khazin Foundation). According to the current situation, the economy is turning back into recession without recovering from previous shocks. This is fully consistent with our ideas, and the main advice that we can give our readers is to assume that there will be no economic growth in the coming years.
- The US real sector and the global financial elite, their position and interests during the crisis
The Bretton Woods financial and economic model has significantly changed the place and status of the US in the global economic system. While in 1944 the US accounted for at least 50% of world GDP, today the US share of production is less than 20%. At the same time, with a large number of countries, the US has serious trade deficits, while the vast majority of calculations are made in United States dollars.
Until 2008, the trade deficit was filled by a balance-of-payments surplus, because most of the world’s investment was in United States dollars, so the returns on those investments were automatically returned to the dollar system. But since 2008, total returns on investments in the world economy (more precisely, its real sector) have become negative, a serious crisis has started (the fourth Crisis of Capital Effectiveness according to the classification «Reminiscences of the future»). Until 2014, this situation was offset by net emissions, but then the global economic system’s liquidity problems began to soar.
In fact, in order to save the global dollar system, the share of American production in the world must be further reduced from its current 17-18% to a conditional 5%. In this case, if something should happen to the global dollar system, America will not be able to feed its population, and there will be no money to import. That’s a fact that the American elite actually understands. It was for this reason that already since November 2014 (based on the results of the midterm elections on November 4), it became clear that a part of the American elite, wishing to abandon the Bretton Woods system and regain the position of the American economy («Make America Great Again»), has regained the right to vote
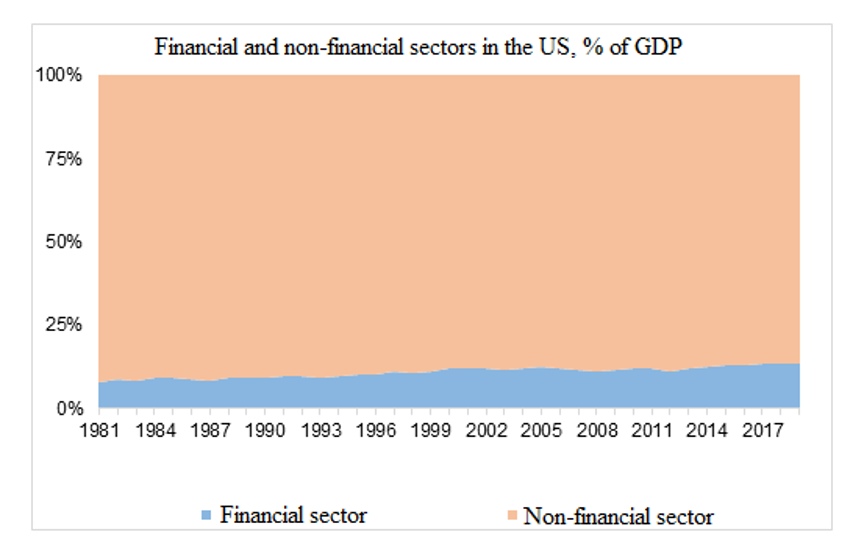
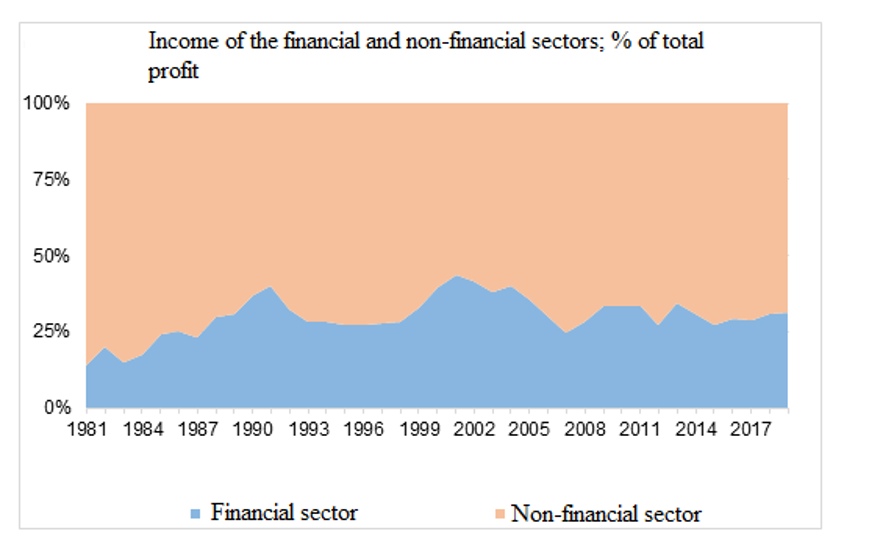
At the same time, in the process of implementing the Reaganomics program (which is one of the varieties of the Bretton Woods model) in the United States, as well as in other countries, the share of the financial sector has increased enormously, primarily in terms of redistribution of total profits to its own benefit. Although current statistics give this sector less than 10% of GDP produced (Fig. 1), its share of profits (Fig. 2) exceeds 30%, and given the redistribution of profits of non-financial companies in favor of their own financial departments, this share should be even higher[1].
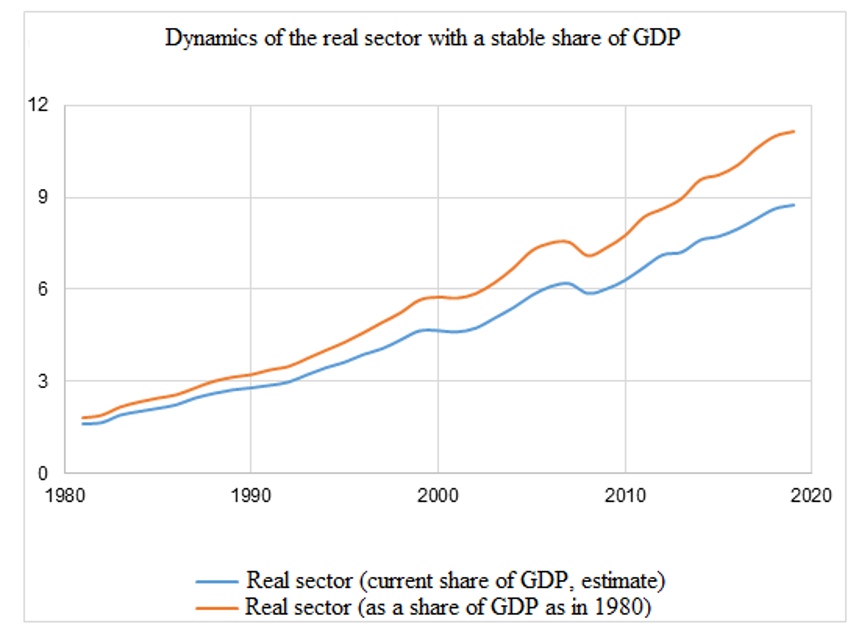
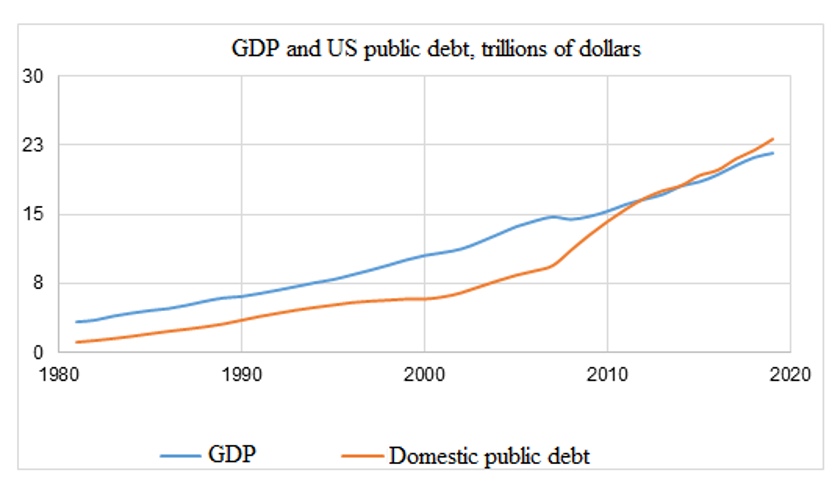
This was due to the gradual decline of the real sector, particularly in the United States. This is understandable, because emissions are the main source of profit. However, the scope of the phenomenon is impressive. If the real sector’s share of GDP had remained at the level of the early 1980s, its volume would have been markedly higher (fig. 3).
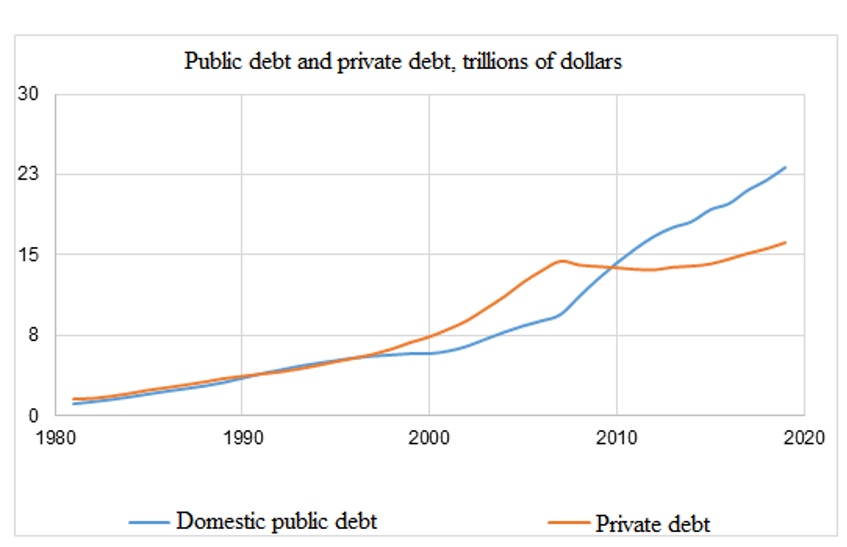
The system currently in place in the US is that money is given to banks in the hope that they will invest in the real sector, but banks do not, seeing that investment in the real sector is unprofitable. They invest in financial speculation. There is currently no solution to get banks to invest in the real sector. It is possible to create State institutions for this purpose, but, firstly, these institutions have yet to be organized; secondly, there is always a risk of corruption. So the model is no longer working, so you can print any amount of money, and the economy will still fall. However, financial institutions will grow, especially given that it is the financial sector that is used to clean up excess money (emissions to sustain private demand have not been cancelled since 1981, fig. 4 and fig. 5).
Now the FED is printing money because the financial system is running out of dollars. As a result, despite the ongoing decline production, the Dow Jones Industrial Average rose to a record high of 30,000 points. Such results are the threshold of the crisis.
In this situation, the two basic economic scenarios outlined as early as the end of 2014 (for example, on 5 March 2014 at the Dartmouth Conference in Dayton, Ohio, by M. Khazin) have actually taken shape. The first scenario is in line with the interests of the financial sector and is supported by the Democratic Party. It is that the US, at any cost (in fact, by sacrificing the real sector of its economy), saves the Global Dollar System. The second is to save the real economy of the United States at the cost of destroying the Global Dollar System. We’ll call it the first «Biden Plan» and the second «Trump Plan».
Note that the colossal injection of liquidity carried out in the spring-summer of this year, and partly still ongoing, is carried out precisely within the framework of the «Trump plan». This is because most of the securities that the FED buys from the market are real-sector, not financial-sector securities
- Trump plan and Biden plan. The tug-of-war between the global financial system and the real US sector for financial support. The outcome of the game in an annex to Germany
As already noted, by the fall of 2014, elite groups in the US representing national real production had become so strong that they planned to run for president and win the presidential election. The result was Trump’s victory in 2016.
Despite opposition from Congress, the FED, and the entire American establishment, Trump is relentlessly pushing forward his political agenda, providing for the eventual return of production to the US and the rescue of the real sector of the US economy at the cost of the destruction of the Global Dollar System. This requires demand, and it is difficult to stimulate it, because after the 2008 crisis, which was suspended but not eliminated, households’ debts amount to 100% of their annual income. As a result, consumers spend money on credit services. «Biden Plan», as noted above, envisages the opposite – the financial sector is supported by finance and the preserved world financial elite at the destruction of the real sector of the USA.
Donald Trump forced the FED to change its policies, though that was extremely difficult. The fact is that today the average return on capital in the world is negative. In this case, the best indicator is the return on deposits. In Western Europe it is already negative, that means no reproduction of capital. For this reason, the FED’s leadership, which represents the financial elite, has decided that the rate should be raised. In the US, the rate was zero, so lending to the real economy was loss-making, more specifically, it was stimulated by emission mechanisms. Trump actively opposed the rate hike and, given the development of the crisis, ultimately insisted on his own.
It was this situation that provoked such fierce (in violation of virtually all unwritten laws) opposition to Trump by supporters of the World Financial System, including the US Democratic Party. But at the heart of this is the fundamental question of how the emission money will be distributed, the fate of the real sector of the US economy, and the Global Dollar (Bretton Woods) System.
- Economic conditions in Germany
Germany is the backbone of the EU’s economy, which, formally, in terms of GDP and market size, can compete with the US. However, this comparison is difficult to make because the Bretton Woods system of division of labor is dollar-based, and in this sense the US is in sharp contrast to the rest of the world. The project «Central bank of central banks» ended in failure in the summer of 2011 after the « Strauss-Kahn affair». This project was aimed at «completion» of the Bretton Woods reform and withdrawal of the emission of the «world currency» from the jurisdiction of the United States in 2008-2011. This should have put the US on an equal footing with other countries, which, as has been said, has not happened.
The EU’s idea was primarily to create a self-sufficient division of labor capable of generating development through domestic demand. However already in the 80s of the last century, such development was not possible without the emission pumping of demand and/or a sizeable trade surplus. For this reason, the development of the EU is impossible without the use of two types of dollar demand. First, the demand for exports from the EU. Second, within its economic system, where the euro is largely emitted against export dollar income.
This means that the EU economy in general and Germany in particular is fundamentally dependent on the US dollar policy. Today, any attempt to build an independent German-based economic system remains doomed to failure. Moreover, the US is keen to ensure that the EU and Germany do not seek excessive autonomy (for example, the Nord Stream 2 project).
At the same time «free play» in monetary policy of the EU is considerably less than in the USA, in particular, there can be no analogues of the «Trump plan» and «Biden plan». It is about some kind of balanced policy, with real-sector orientation and support for people’s standard of living (the EU’s leading countries support left-liberal policies, as opposed to Trump’s right-wing conservative and Biden’s right-wing liberal). For this reason, we can only talk about the development of the situation in Germany on the basis of the logic of the German economy’s reaction to certain US actions.
Thus, the subject of our report is a description of the «room for maneuver» in the development of the German economy on the assumption that the «Trump plan» and «Biden plan» will be realized in all their purity. Of course, in reality, US policy will be intermediate (though leaning toward one of the options depending on the outcome of the election) and, consequently, the results for the German economy will be intermediate.
In addition, it should be borne in mind that the EU authorities (in particular the ECB) and Germany itself may in one way or another reinforce or weaken US external factors. We are not in a position to make an accurate assessment of this work, because decisions will be political in nature, but we can assume that the aim will be to minimize the negative impact on the economy of Western Europe. In fact, our report describes the «fork» of the indicators in which the economic situation in Germany will develop in the coming years.
- Dynamic modelling
In order to predict the impact of the Biden and Trump plans on the German economy, we applied the dynamic computer simulation method. This method has been developed in the last 50 years by the Doctor of Economics A.A. Kougaenko, who has published a large number of monographs on the subject of research, among others translated into English.[2]
Dynamic modelling is one of the economic and mathematical methods that is significantly different from other methods currently in use. It is designed to display complex objects – socio-economic systems. The socio-economic system is understood to mean such a complex, which includes at least two of the following components: production and consumption of products. Other components of the complex that can be modelled in addition – ecology, social management, defense, demography and others.
Socio-economic object models differ in the way they are constructed. Accordingly, models can be:
- Static, i.e., with a structure that does not change over time, or dynamic, with a variable structure;
- Statistical – extend past statistical data series into the future, or use probability approaches – or Deterministic, where modelling results are well defined and subject only to the changing properties of the model itself;
- Linear, constructed only on linear internal associations of elements, or non-linear, etc.
These alternatives are fundamentally different in terms of the representation of socio-economic systems and the obtained modelling results. To be consistent with such systems, models must meet a number of requirements, such as being dynamic, deterministic (i.e., built without using random values) and non-linear.
Static and dynamic modelling
Static modelling differs from dynamic modelling in that static models have a constant internal structure that remains unchanged when calculations are made. In a static model, the relationships between parameters are established at a certain point of time and it is assumed that this relationship does not change over time. In fact, the economic situation is quite different: any connections and relationships that can be understood and fixed are constantly changing, and at completely different speeds. During dynamic modelling, a large part of the parameters changes continuously, which in fact happens in the displayed socio-economic systems.
Statistic methods are widely used in modern economic calculations: linear and non-linear programming, balance method and others. Due to the consistent model structure, these methods are used at short time intervals, as every economy is inert but are not suitable for long-term forecasts. Attempts to remedy this shortcoming make the calculations more complicated but do not lead to the required result.
The dynamic modelling method used in our models is intended for forecasting at unlimited time intervals. The model structure changes during the modelling process, just as it does in the real economy. These changes depend on the way in which the original model was constructed and on any dynamics that occurred in the modelling process up to the point when the forecast results were observed. These changes are twofold: they are introduced either automatically, by the model itself, or as a result of its management. The models are also equipped with management tools: it is possible at any time to change any parameters that make up the economic strategy (tax rates, tariffs, quotas, etc.). For a model to be dynamic, it must include at least one dynamic element (e.g., an integration operator).
An important feature of the dynamic modeling method is the mandatory display data on different resources. They are modeled in two ways: as flows that characterize resource operations performed in a unit of time – how many were produced, moved, or used – and as stacks where only the number of resources is displayed. For example, resource flows include the natural volume of the sectoral output – units of production per year, per quarter; the earnings of the enterprise; the average income of the members of the social group – units of money for a year or a month, etc. and so on. Stacks are modelled in units or tons of resources, money in accounts in millions of rubles or in other currencies, etc.
Another important feature of the dynamic modelling method is the ability to implement continuous processes in the model, which are often displayed in stepwise rather than smooth form. Static calculation methods are unable to respond to rapid changes in parameters, which leads to noticeable errors in the results, whereas dynamic modelling allows to reflect intermittent changes in parameters, which significantly increases the correctness of the project management.
Statistical and deterministic models
Deterministic and statistical models differ in the types of algorithms used. In statistical models, algorithms are derived from past statistics or parameter values are determined by random numbers. Deterministic models are based on algorithms that reflect the dependence of some parameters on others. These algorithms are formalized on the basis of hypotheses, some of which have already been tested by practice, while others remain to be verified. In the construction of models of socio-economic objects, the application of mathematical statistical methods (i.e. the correlation of data series, etc.) to obtain forecasts is very risky, because certain parameter relationships occur at specific moments in history, with a combination of many causes, the totality of which is unique. In fact, there is always a minimum number of identical situations in an economy – on the contrary, there are mostly unique processes that change constantly over time. If the parameters are observed during statistically independent events, it is not possible to obtain a stable, adequate relationship between them. In addition, even if once in the past good relationships of parameters (in our case socio-economic) have been obtained on the basis of statistical methods, their extrapolation is possible only if the following conditions are met:
- Models are built within the boundaries of the initial postulates of mathematical statistics;
- The modelled object (like the model) has a permanent structure of relationships between the elements.
In this case, the following points of mathematical statistics are of importance to us:
- The number of tests shall be large enough that their subsequent increase shall not alter the results;
- All tests shall be carried out under the same conditions;
- The test results shall not affect each other;
- The tests do not reveal the cause and effect dependence of the parameters, but only how strong the relationship between them is.
The violation of even one postulate of mathematical theory – as happens with any extrapolation of statistical data – in practice always leads to gross errors. Hence, mathematical statistics, which operate on random events, are not suitable for predicting processes in socio-economic objects and for preparing management decisions. The use of past statistics for economic management is essentially the same as driving in the rear-view mirror instead of looking forward.
Anthony Stafford Beer, theorist and practitioner of the Second-order cybernetics (best known as creator of a viable system model) once noticed:
«…the notion of randomness is identical to the notion of unpredictability. The fact is that, at the very least, it is conceivable that any event is unpredictable only to the extent that we do not understand its causal mechanism». It follows from this that the more thoroughly described the modelling object, the less its description should contain a random and, conversely, more – definite (deterministic).
The statistical approach introduced extrapolation into economic practice. A certain trend is formed from the indicators of past periods, which is expected to continue in the future. The use of such a technique is not allowed, because the indicators have the property of unreasonably changing themselves without the influence of other factors. In reality, the indicators are not changed by time, but by the influence of various factors that are also subject to certain patterns. The dynamic socio-economic structure in the past produced the processes reflected in the statistics, but in the future the structure changes, giving a new character to the processes. Only the general laws of mutual influence of factors remain in a socio-economic object, and the structures of internal relations change. Accordingly, the statistics reflect the state of the object only at selected points in the past. There are two errors in extrapolation:
- The object retains a stationary structure, which leads to the erroneous assumption that the nature and location of the identified patterns will not change in the future;
- Monolithic transformation algorithms within a non-stationary object are asserted, which is not possible by definition.
Thus, statistical methods do not produce correct predictions of the development of society, and deterministic methods offer possibilities to forecast the processes expected in the future.
At the same time, it should be borne in mind that socio-economic patterns are expressed only through statistical analysis of past events and their causes. Some common patterns can only be described by summarizing a large number of phenomena and a statistical analysis of their causes. The powerful mathematical apparatus of statistics is useful for the formalization of social and economic processes, taking into account various factors and relationships of phenomena. Past statistics provide only an ex post assessment of previous management decisions. However, if it is possible to identify the nature of the relationships between the parameters of an object, which have been established in the past but are not dependent on time, it is possible to find the patterns of these relationships, which with certain adjustments can be used for dynamic modelling. However, it is important to select the parameters not in an arbitrary manner, but in such a way that they are truly interdependent. Among other things, statistical data allow the initial values of the parameters of a dynamic model to be formed in order to predict its future behavior.
The deterministic approach in dynamic modelling of socio-economic objects is based on hypotheses about links between the parameters of the object and their original structures. It should be remembered that current management rules may not only comply with the objective laws of the functioning of the object, but may also prevent its manifestation. Therefore, one of the main tasks of the modelling is to test the economic mechanism for compliance with the laws of socio-economic development, as well as to identify time intervals when the directives of the economic mechanism apply.
During modelling, unexpected changes in model parameters can often be detected. To determine the reasons for these changes, the forecast on the model needs to be repeated several times with all previously performed management actions repeated (if these actions are not changed, they are automatically repeated with new modelling). In deterministic models where random numbers are not used, the results of previous modelling will always be repeated. This feature offers two possibilities. First, to determine the place and time at which the initial cause of the unexpected prediction results occurs in the model. Second, to identify the causal chains by which the effects are transmitted from the place and time of origin to the place and time of occurrence of the unexpected result.
Linear and non-linear models
When constructing economic and mathematical models using traditional methods, the particular attention is paid to linear methods of formalization of object properties (linear programming, game theory, factor analysis, optimization methods, etc.). However, as the level of detail of the model increases, linear reflection becomes less consistent with practice. In real life, linear associations are almost non-existent. Based on the experience of modelling socio-economic objects, it can be seen that even one constant factor in the model at a long-time interval always leads to model failure. This is not true for a real economy, in which there are no long-term linear relationships. Therefore, constant normative values need to be replaced in models by variables. For correct modelling it is necessary to take into account changing constraints on resource flows, capacity of production funds, speed of development of individual sectors of the economy etc. In addition, it is very important to take into account the dynamics of intensity and the threshold of sensitivity of the model to different impacts, the change of these effects and the influence of socio-psychological factors (addiction, fatigue, the dependence of objects on time and condition of the object). Modelling should reflect changes in social, production and other structures.
Mathematical description of given non-linear connections of a model is not very difficult. It is difficult to create a viable non-linear model because it requires a long debugging process, and its use involves a non-trivial search for the root causes of the obtained modelling results.
Structural changes occur continuously in both the non-linear model and the object being displayed. Some internal connections are disappearing, others are emerging, so we can only talk about the specific structure of the model at a certain point in time and at another moment the structure of the model will change, meaning that another model will appear. Structural changes depend not only on the original mathematical description of the object, but also to a large extent on the displayed economic mechanism.
The economy is a people-centered resource management activity based on comparing the projected acquisitions and losses of resources with the planned expenditures of resources needed to achieve the stated objectives. The objects themselves are constantly changing. For example, the economy first needs to «survive», then the need for «equality with competitors» appears, and then the goal becomes «leadership» on the market. Therefore, in view of the constant changes in the economic structure, management objectives, internal conditions and external influences, there is a need for continuous interaction between the planning subsystem and the forecasting tool for the creation of a national economic strategy.
The economic forecast is needed to strategize the economy towards a changing socio-economic goal. The plan is needed to develop technology and resource management calculations based on the strategy developed to achieve the goal. However, all changes in the dynamic model structure are completely deterministic. The emerging processes, seemingly random, are in fact deterministic, generated by a complex non-stationary structure, varying in non-linear but well-defined algorithms.
DYN Tool
The task of the DYN tool is to predict troubles under any management option. Its purpose is to find crisis-resistant management strategies. The DYN simulates the dynamics of complex non-linear economic objects with non-stationary architecture and multiple backward linkages. Forecasting is performed on models that are linked systems of non-linear differential equations with feedbacks, some of which develop the economy and others destroy it.
Modelling practice has shown that for models, and therefore for «living» objects, the long-term acceleration is the most damaging. If acceleration occurs even on a single parameter within one year or more, the model begins to «decay». Acceleration «infects» other parameters, activating positive feedback in models. Reallocation of resources quickly becomes unable to stop the acceleration avalanche, and there is an economic collapse. If the acceleration has emerged, it can sometimes be held back only by changing the structure of the economy. In this case, a very effective change is the strengthening of the planning principle in the economy. A crisis-free economy arises when the required balance of market and planning mechanisms is reached. Thus, it is essential to be able to predict accelerations and find their causes. DYN Tool is needed to prevent disasters. The reasons for the long accelerations need to be predicted. In the «measured» developing system (without crises) there must be a continuously changing balance not only between the number of positive and negative feedback links, but also a balance of intensity of the effects of these links. In the DYN system, automatic algorithms (economic «automatic pilots») are often used for this balance, controlling feedback signals, which contributes to crisis-free conservative development, i.e. the development of an economy with a constant speed without prolonged accelerations. DYN envisages the creation of models to accurately reflect existing socio-economic systems. Any connections between individual model variables must be verifiable and valid – in particular, to represent the relationships of parameters similar to the interaction of objects and phenomena in real life. Built-in management algorithms redistribute resources and change economic structures over time according to crisis avoidance criteria. They reproduce a complex of economic, financial, social, political and other structures, the changes of which give rise to uncertain situations in the future. The parameters of the management are changeable at each step of the forecast, which allows to model the expected steps for the management of the real economy. The purpose of the DYN is to identify management strategies that avoid protracted crises. DYN simulates the dynamics of socio-economic objects characterized as:
- Complex (causing chaos);
- Non-linear (with varying signal conversion operations);
- Dynamic, simulating changes in the velocities and accelerations of the parameters of objects, which have a variable (non-stationary) structure and contain a lot of feedback (positive and negative) connections, as well as many cross (counter) links (which are not cybernetic feedbacks).
The analysis of forecasting results shows that the management lever alone is not sufficient to produce satisfactory results over long periods of time. It is necessary to continuously control many levers and, most importantly, it is necessary to correctly select the moments of time, sequence and intensity of use of each control lever. It should be borne in mind that the non-linear dynamic system is not equally sensitive to control effects at different time intervals throughout its life cycle. It will always be different.
The results of the DYN tool are not the future conditions of socio-economic objects, but the forecasts of changes in the parameters of these objects (projections of changes in velocities and accelerations of parameters and changes in economic structures) under the influence of management decisions and external impacts. It is possible to assess the effectiveness of decisions in an integrated manner on the basis of predictive data, taking into account both the direct reaction of the target and the indirect effects on other objects. And also, very importantly, this way you can estimate not only the immediate, but also the remote consequences of the decisions that are made over the entire forecasting interval.
DYN ensures that:
- Testing of economic development programmes as well as selected important solutions within available resources and perceived external impacts, search for crisis-free macro-economic management strategies in the context of external (international) impacts;
- Forecasting (1-5-10 years) of the implementation of social and economic development programmes, including economic and military-political interaction with other countries;
- Training in the skills and techniques of managing the dynamics of economic objects using simulators, standard modules and algorithms of reflection of the economic system. Management is realized by the actual existing «levers» of management, economic, financial, social, etc. objects reflected in models;
- Business games in the form of training and an economic workshop on conducting business in a competitive or cooperative market (business games of several participants, where the algorithms of the market and the behavior of the consumers of business results are modeled on the computer and the business is managed by the players);
- Testing of company staff for promotion or vacancy competitions.
In order to forecast socio-economic developments, there are:
- System (software) and DYN dynamic modelling technology for predicted objects;
- Methods for dynamic modelling of the system, non-linear differential equations with a non-stationary structure and a plurality of different feedback relationships (this modelling allows to produce deterministic chaotic processes, i.e. completely unexpected changes in future dynamics);
- A unique interface to simultaneously manage the model with multiple control parameters and monitoring forecasting results.
The DYN tool is the result of more than 40 years of development in dynamic computer modelling. More than 10 monographs describing the synthesis of ultra-high-complexity economic and mathematical models were published.
The DYN tool correctly reflects the future dynamics of the following areas:
- Production;
- Standard of living and quality of life of social groups (both in the model country and in other countries), social tension index;
- Characteristics of social groups (unemployment, financial savings in banks, intelligence index, share of paid leisure time, household needs index, housing security index, etc.);
- Demography and migration;
- Popular education (secondary, higher and supplementary vocational education);
- Defense industry;
- International trade
The origins of the formation and dissolution of international coalitions (alliances, blocs, etc.) and the impact of those processes on national economies.
In addition, there are several dozen «standard» (source) model modules (i.e. model layouts) that can be completed to the level of working models.
Such source modules include, for example, dynamic models of:
- Market pricing of goods on the sales market, including continuous change in the elasticity of demand at price in response to many continuously changing external market conditions;
- Phenomena of fashion on anything (goods, music, politics, etc.);
- Competition among commercial banks;
- Competition among enterprises.
- Modelling the results of the plans
The Biden and Trump impact projections for Germany proposed in our report have been developed on the basis of special computer models. They model the German economy, which, like any other economy, is a complex system of interconnected objects that is constantly changing over time.
Statistical models based on past statistics or on random sampling. The problem, however, is that any extrapolation of statistical data, as well as the use of random values, always lead to significant errors. This limits the applicability of such methods for forecasting socio-economic processes and preparing management decisions. The use of past statistics for economic management is essentially the same as driving in the rear-view mirror instead of looking forward. In the same way it is not allowed to use traditional sets of scripts – «pessimistic», «optimistic» and «most likely». Scenarios can be any number, it depends on the chosen way of management.
Our deterministic models are based on algorithms that reflect relationships within the real economy. At the same time, current management rules may not only stimulate economic development but also hinder it. Therefore, one of the main tasks of the modelling is to test the economic mechanism for adequacy, as well as to identify time intervals at which the economic mechanism does not lead to crises.
In modelling practice, linear methods (linear programming, game theory, factor analysis, optimization techniques, etc.) are often used. However, the more detailed the models, the less the linear methods show the real picture. In real life, linear associations are almost non-existent. If the model contains constant parameters, such models are always destroyed at long intervals. Therefore, the constants in the model need to be replaced by variables.
We use a non-linear modelling method. It makes it possible to take into account, for example, changing constraints, as well as, in general, any changes in social, production and other structures that constantly occur in the object of the modelling. Some internal connections are disappearing, others are emerging, so we can only talk about the specific structure of the model at a certain point in time. Then the structure of the model will change, meaning that another model will appear. Structural changes depend not only on the original description of the object, but also to a large extent on the displayed economic mechanism.
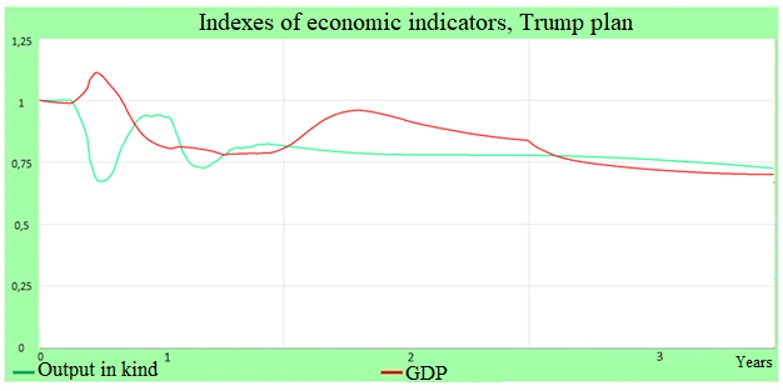
Projections of the impact on the German economy of the Biden and Trump strategies (fig. 6 and Fig. 7) are based on models with all required properties (dynamic, deterministic and non-linear models).
The COVID-19 pandemic has been factored into the projection, with a significant number of workers remaining at home, working remotely or not at all. This situation led to a decline in output in kind as well as a decline in GDP. In the figure, the behavior of these graphs is different, because output is tightly tied to resource constraints, and the formation of GDP is highly inertial. In addition to the conditions of limited access to work, the model applies the hypothesis of a fall in the amount of loans granted due to the reduction in the value of shares in enterprises. This had an additional impact on the drop in production and GDP, even after the end of the pandemic. In addition, in the third year of the simulation, it was assumed that Germany would lose its trade surplus as a result of the collapse of world markets. The forecast was as follows.
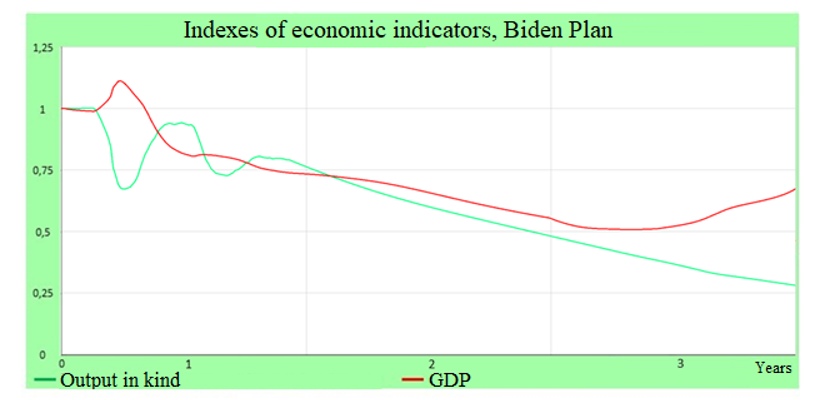
Measures in the German economy’s response to the «Biden Plan» are aimed at supporting the financial sector. However, real-sector enterprises are losing much of their lending capacity as the price of all their assets plummets (fig. 6). Similar measures in the case of Germany result in output in kind in tonnes, kilowatt-hours and other quantities falling more than fourfold in three years. The gross domestic product (GDP), calculated at current prices (fluctuations in GDP at the beginning and at the end of the modeling period are caused by the dynamics of current prices), is falling at about the same rate. If GDP is measured at constant prices, the fall will be even more pronounced.
Sources of US economic statistics
Public debt
Personal debt
Corporate debt
Value added of the financial sector
Financial sector profit
Sources of German economic statistics
Sectoral data and GDP
The full text of the report will be available after payment
50 $
ОПЛАТИТЬ