
Time period. April 23 – 29, 2022
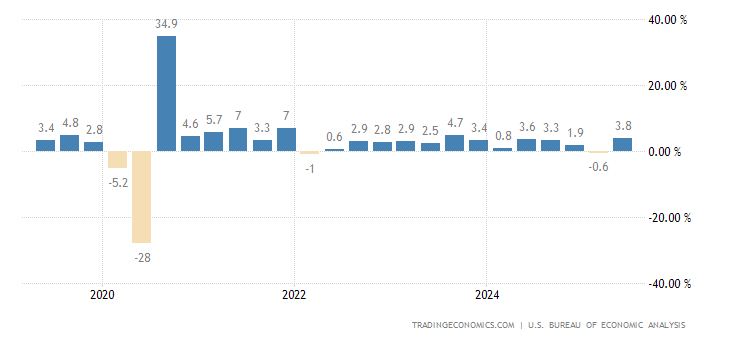
Top news story. The main news of the week in the eyes of everyman was the first quarterly decline of US GDP in two years. But this is not news to our readers — we have repeatedly shown that the decline in the United States began in the autumn of the previous year, 2021, — and in the fourth quarter this decline has passed into a full-fledged structural crisis in the image of 1930-32. The difference lies only in the mechanism, then it was in the deflationary scenario, and now it is in the inflation scenario. By the way, the difference between these scenarios is described in M. Khazin’s book “The Black Swan World Crisis”, in the chapter devoted to the forecast for one of the years of the mid 2010’s.
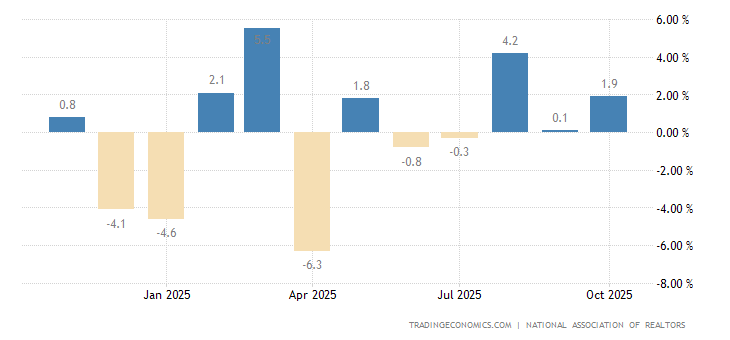
In our view, the main news is why the US monetary authorities and their statistical agencies have conceded this decline. Indeed, what were the obstacles to lowering inflation and thus exhibiting phenomenal growth, as was the case in 2021? The reason is that the fall in GDP has nothing to do with inflation — or, more precisely, the main factor here has become another phenomenon. Let’s look at the statistics (source: Spydell’s telegram channel) on US household income.
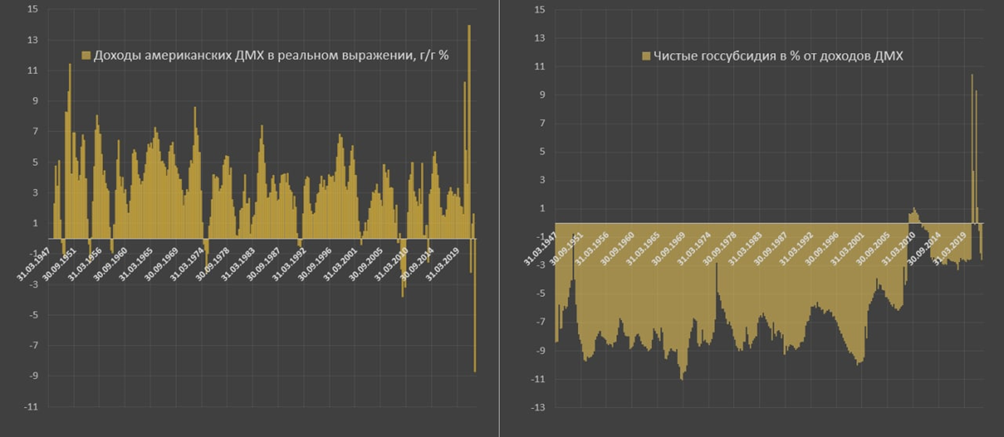
- Incomes of American households in real terms, y/y %;
- Percentage of net government subsidy from household incomes
In real terms, US household incomes fell by a record 8.8% year-on-year. No such decline has occurred since 1932!
The reason is the effect of the base — exactly a year ago, the US federal government distributed “helicopter money” without any control, almost 200 billion. dollars per month of targeted subsidies to the people. This led to a 14% increase in real incomes at that moment, now they are being adjusted to where they should be.
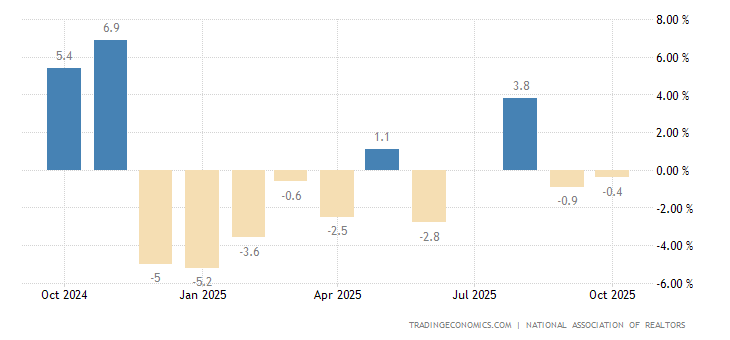
The second reason is the normalization of fiscal policy. Net government subsidies are all forms of support given to the people from the consolidated budget, minus all that the state takes in the form of taxes. Always the state took more than it gave. The historical norm is 8% of incomes. The exception was the COVID-19 crisis, when people received 11% of subsidies from income. Now we’re back to -3% where we were before COVID-19. That makes up at least 5% of private incomes relative to the norm.
In general, support was canceled and immediately received -9%. This factor, in particular, explains the economic growth in the US in 2021. Household expenditures account for about 70% of GDP, and their huge growth through emissions subsidies has led to high growth rates. Of course, lowering inflation would have played a role if it had not existed, so would spending.
Macroeconomics
US GDP -1.4% QoQ YoY, 1st decline in 2 years:
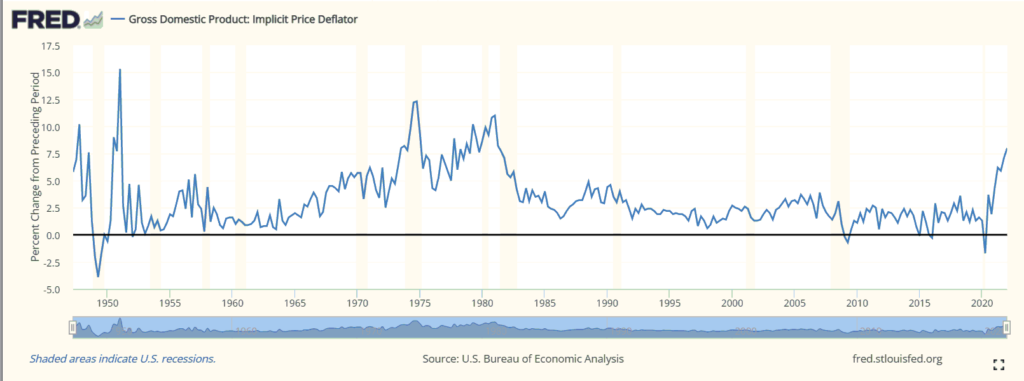
At the same time, the implicit price deflator, that is, inflation for the entire economy, is +8.0%, it is 41-year peak:
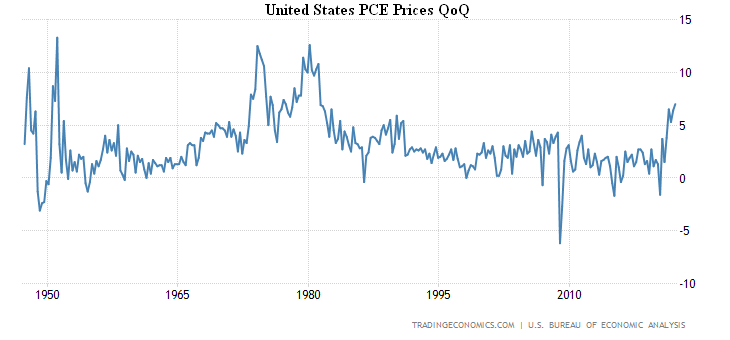
Personal consumer expenditures have the same peak (+7.0%):
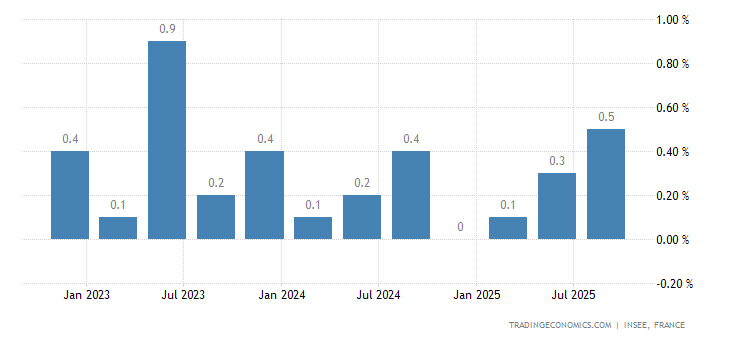
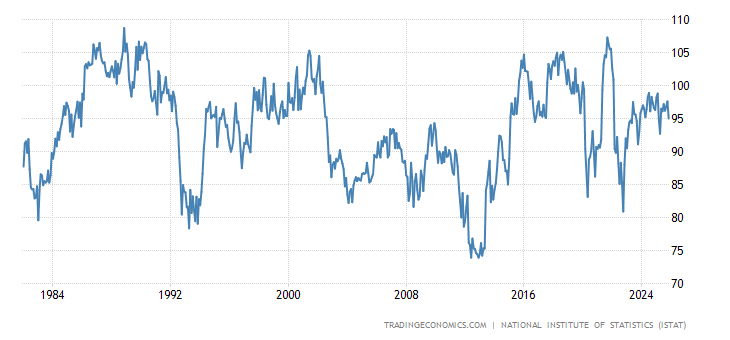
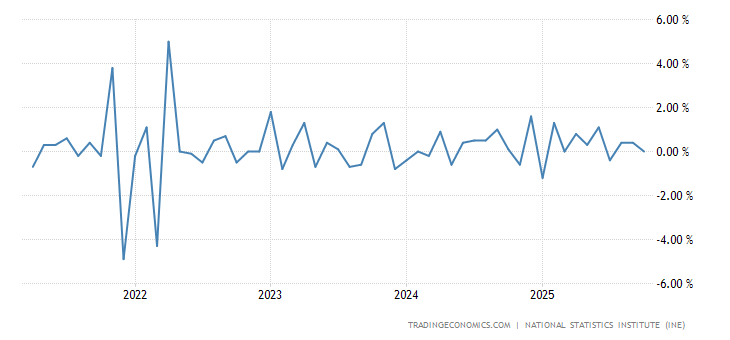
France’s GDP growth hits zero —
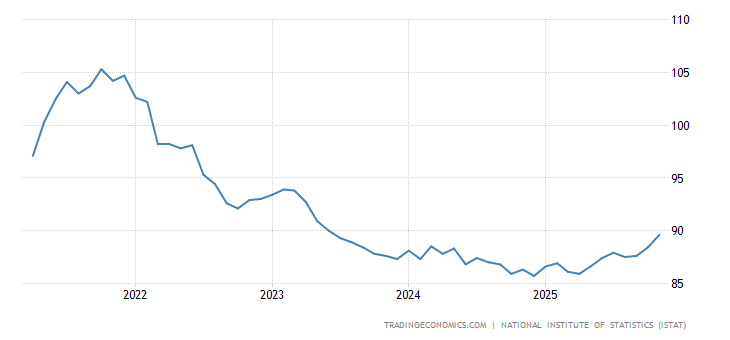
And in Italy, it went into the red (-0.2% QoQ) —
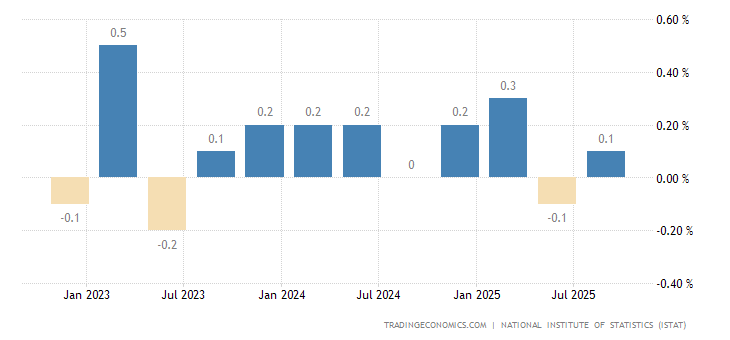
It should be noted that these figures are likely to be significantly lower in reality, owing to underreporting of inflation.
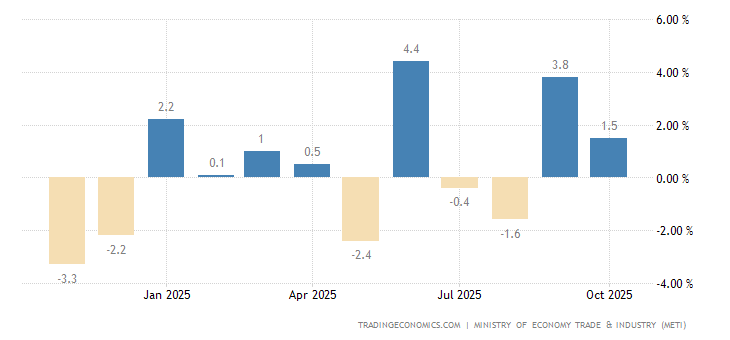
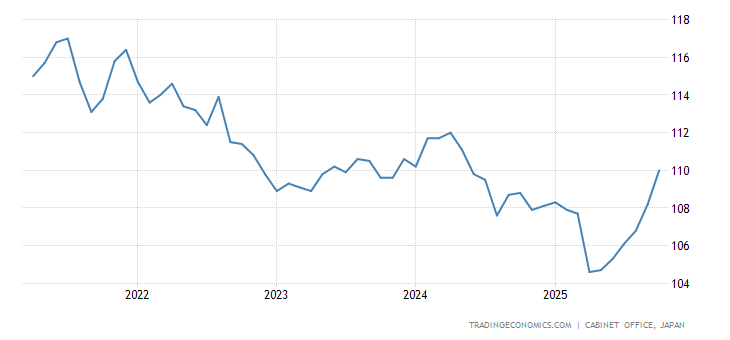
Industrial production in Japan again in the annual negative (-1.7%):
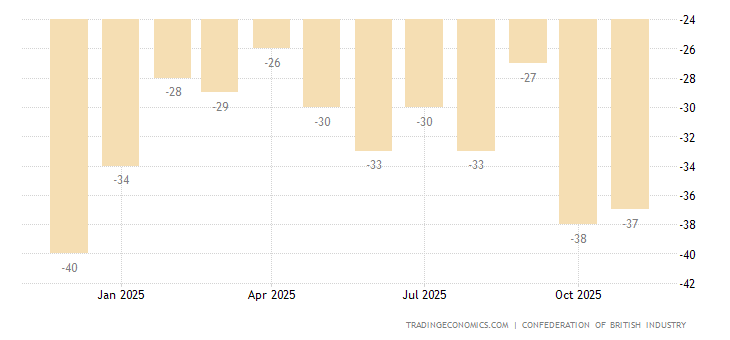
United Kingdom CBI Industrial Trends Orders are the weakest in six months —
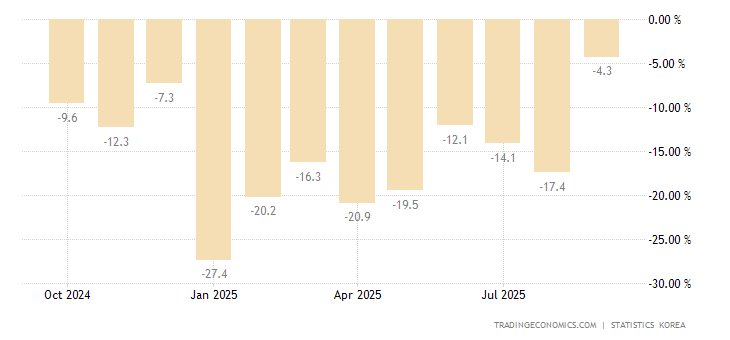
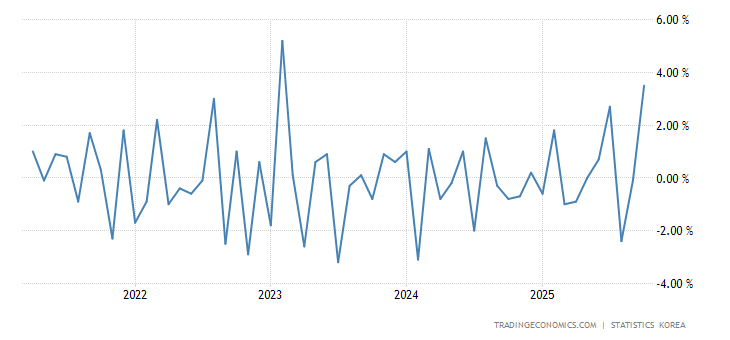
Output in the construction of South Korea returned to a well-defined negative (-7.3% per year) —
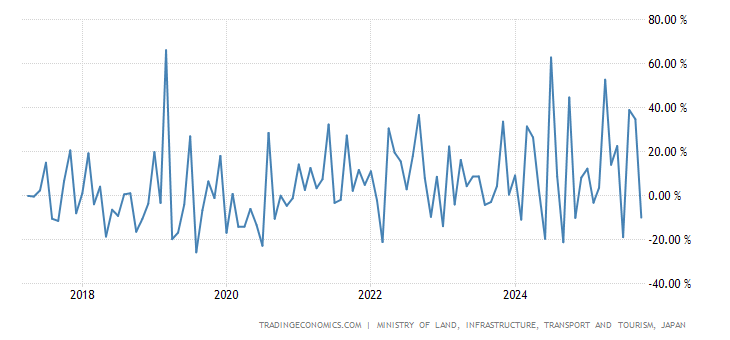
Construction orders in Japan -21.2% per year — 2-year low:
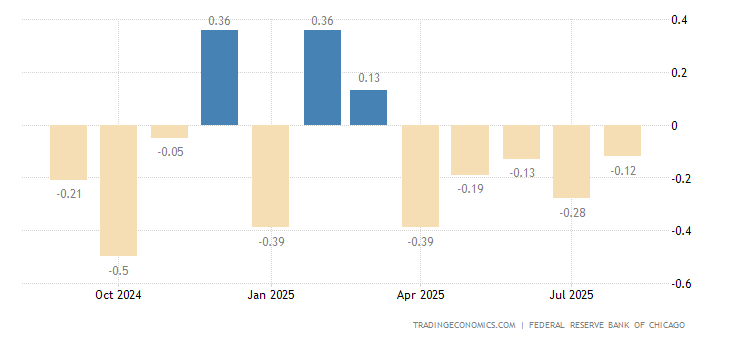
United States Chicago Fed National Activity Index is gradually slowing down —
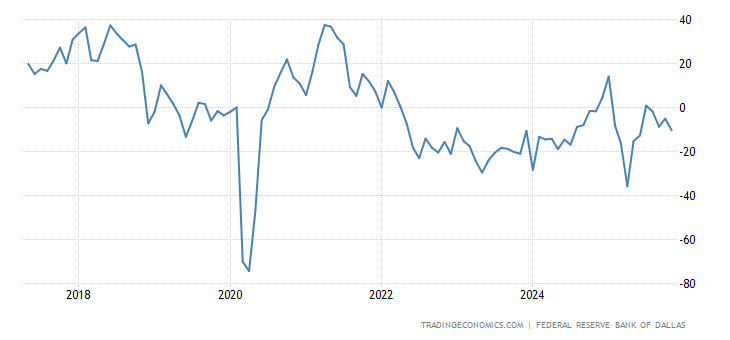
United States Dallas Fed Manufacturing Index is at its lowest in 1.5 years —
Business confidence in Italy is the worst in a year —
Leading indicators in Japan are approaching the annual trough —
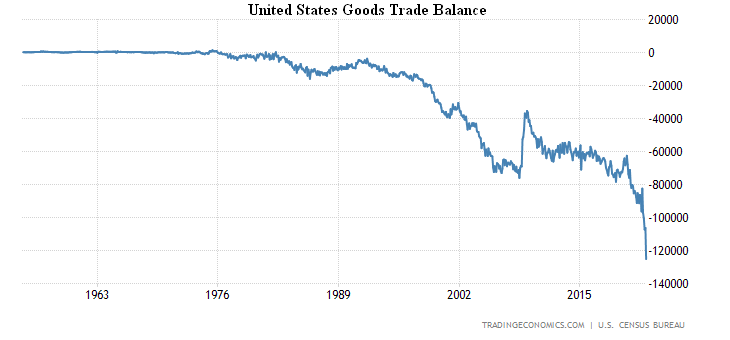
United States goods trade balance hits record high by a long shot:
New home sales in the US -8.6% m/m, 3rd consecutive negative, median price +21.4% y/y, average +26.3%:
U.S. pending existing home sales -1.2% m/m (5th consecutive negative) and -8.2% y/y (10th) to 2-year trough —
Mortgage applications in the US another -8.3% per week — 7th consecutive time in the red:
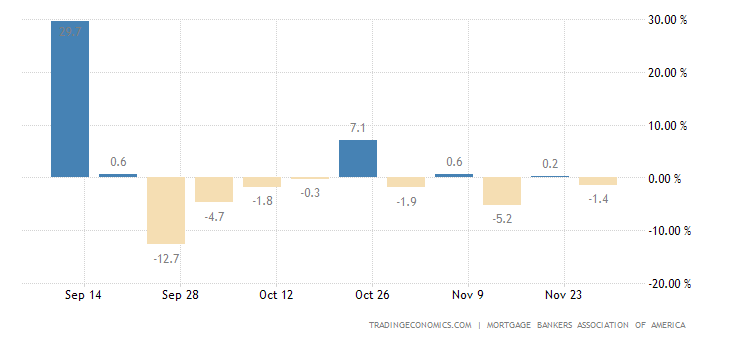
To the lowest since 2018 —
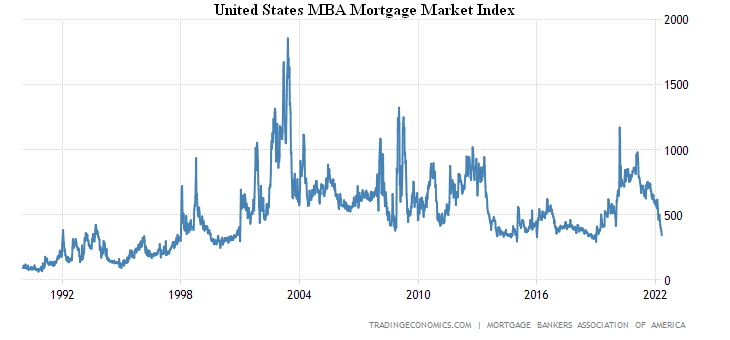
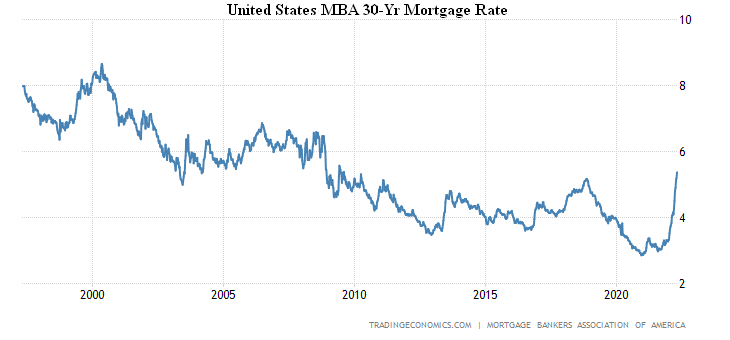
Against the backdrop of skyrocketing mortgage rates to a peak since 2009 —
House prices in the largest 20 US cities from S&P / Case-Shiller +20.2% per year — a record for the time of data acceptance since the beginning of the century:
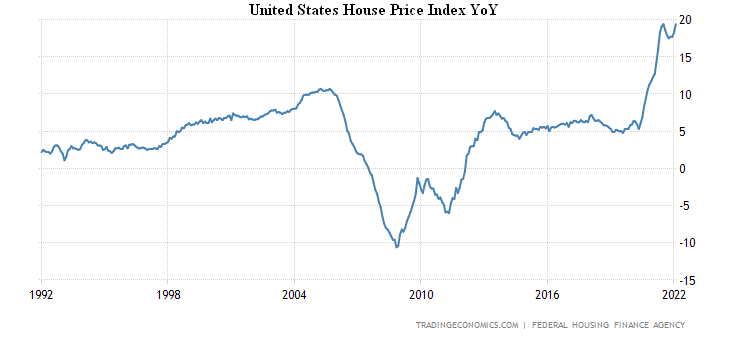
The official estimate, in general, does not vary much, according to FHFA, the record for 30 years of statistics +19.4% per year:
You can assume that we have already started to present inflationary data that routinely break numerous records.
Personal consumer expenditures (PCE) in the US +6.6% per year, this is a 40-year peak:
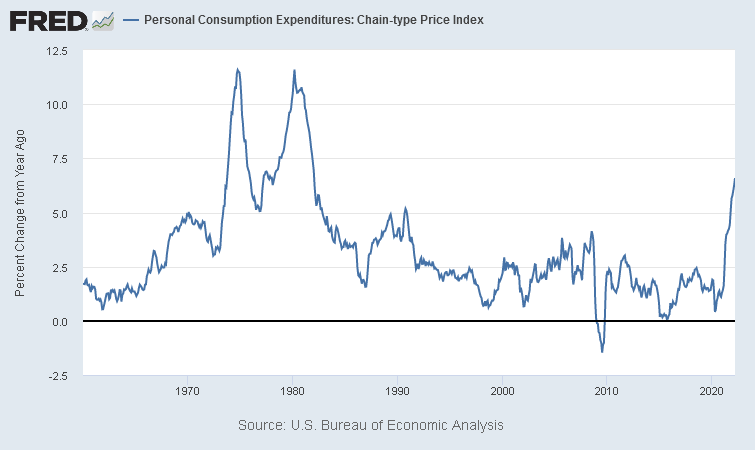
United States Personal Consumption Expenditure Price Index
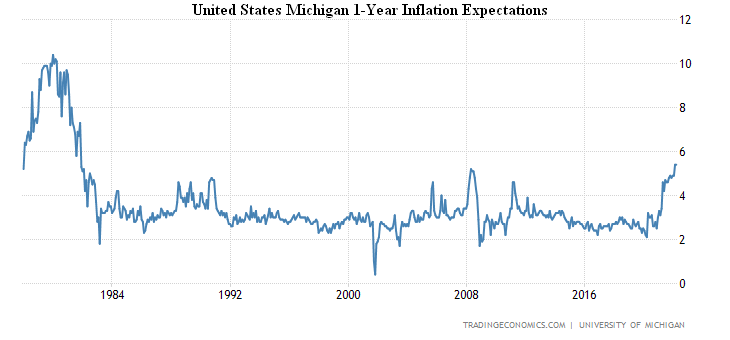
US inflation expectations (University of Michigan version) have climbed to the top since 1981 (+5.4%) —
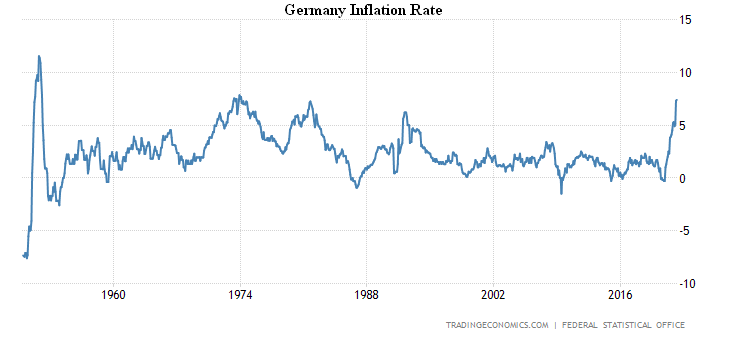
CPI (Consumer Price Index) Germany +7.4% per year, the highest since 1974 —
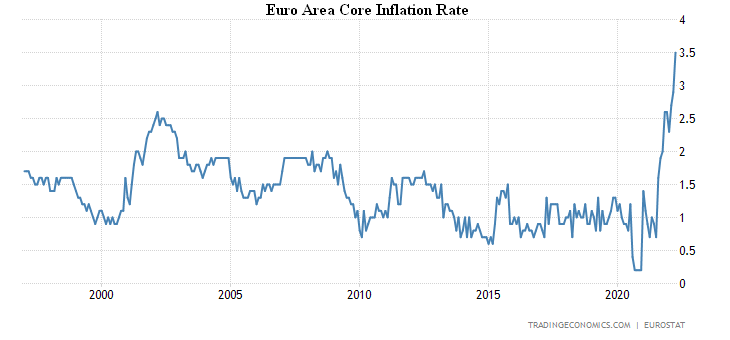
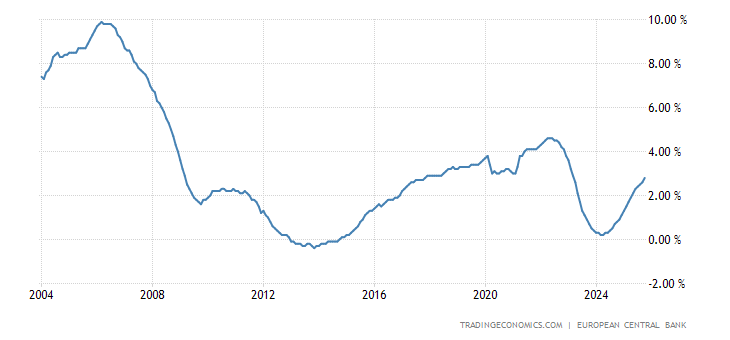
The Euro Area CPI +7.5% per year, record for 31 years of survey:
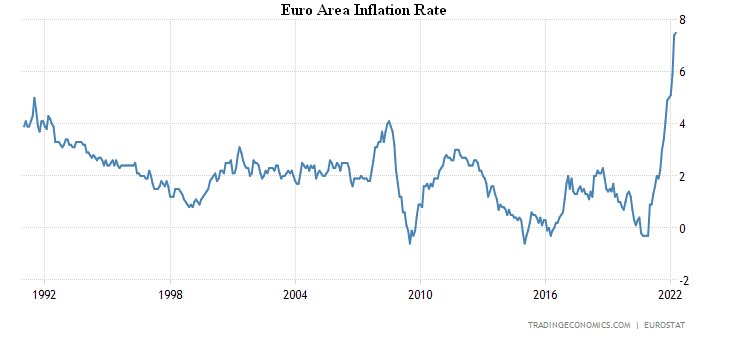
Core inflation rate (less energy, food, alcohol and tobacco )+3.5% per year, that is also a record, but for 25 years of survey:
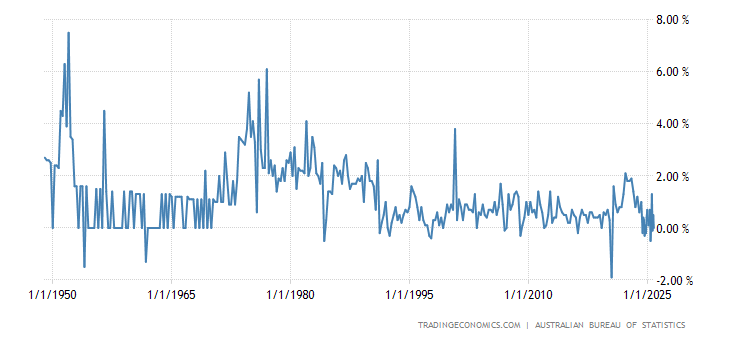
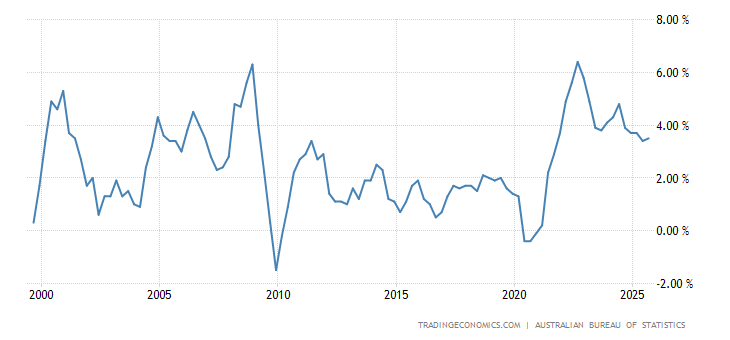
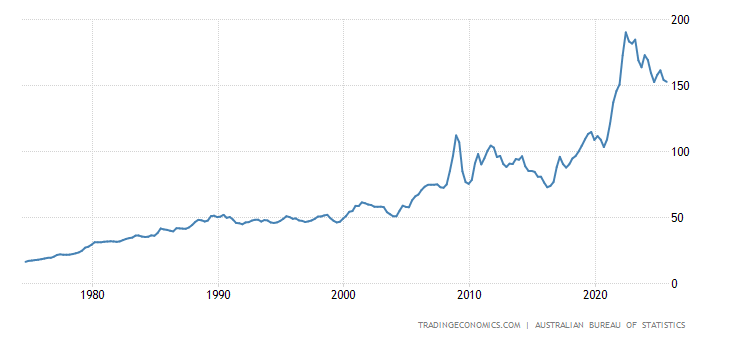
Australian CPI +2.1% q/q and +5.1% y/y, both the highest since 2001:

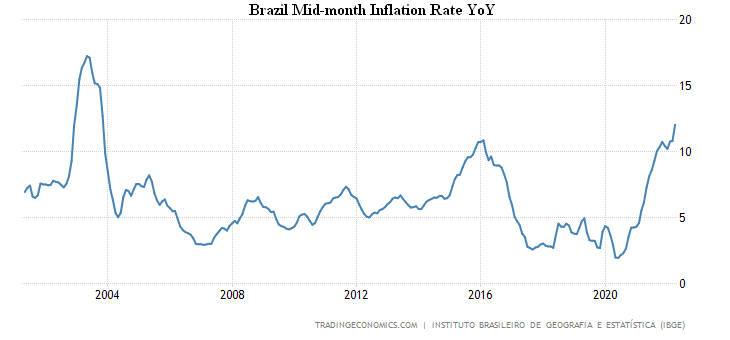
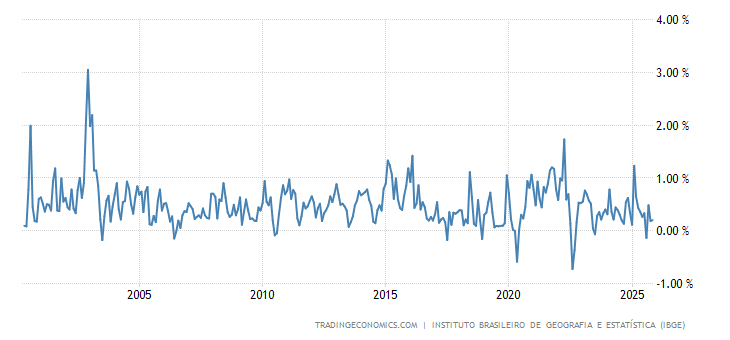
Brazil CPI +1.7% per month and +12.0% per year, both at their highest since 2003:
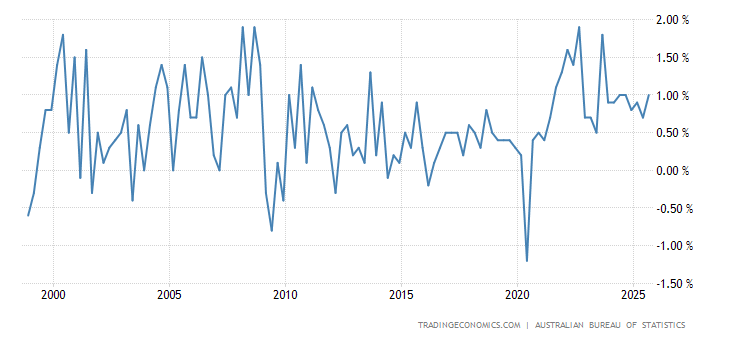
PPI (Producer Price Index) Australia +1.6% per quarter and +4.9% per year, highs since 2008:
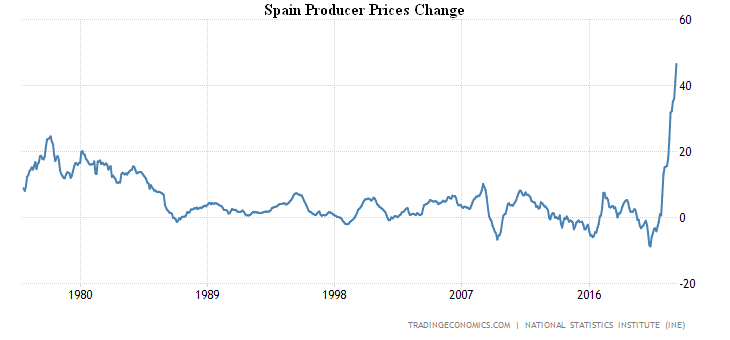
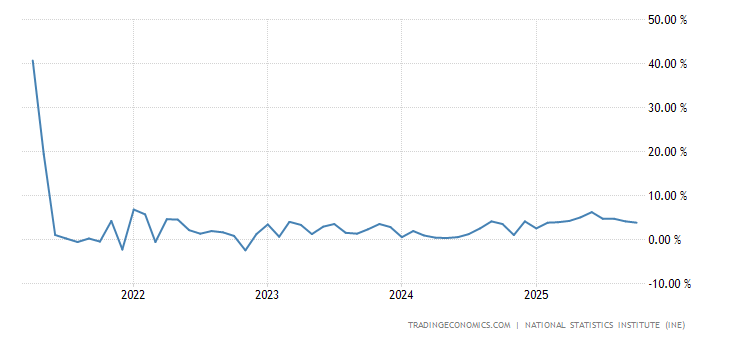
PPI Spain +46.6% per year, a record for 46 years of observations:
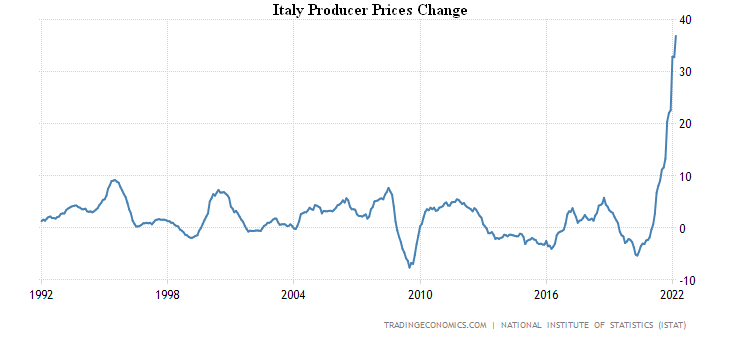
PPI Italy +36.9% per year — a record for 30 years of data acceptance:
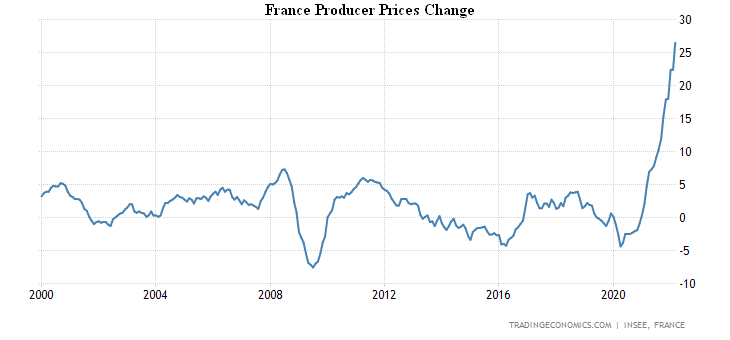
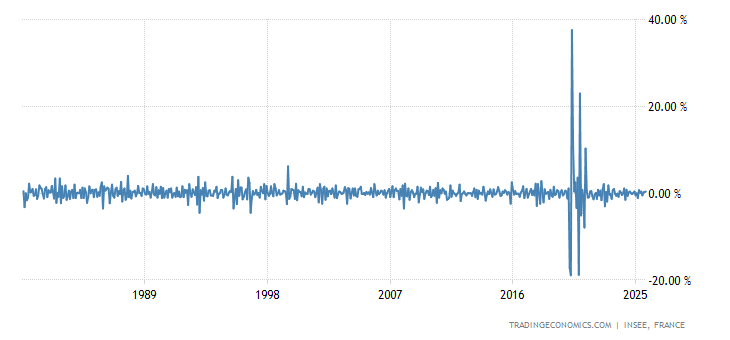
PPI France 26.5% per year, the record for 22 years of statistics:
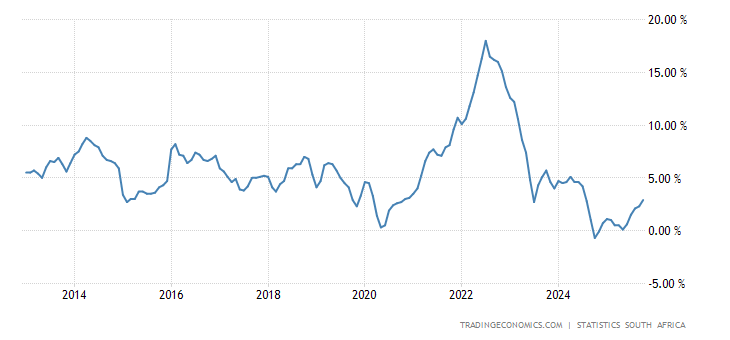
PPI of South Africa is also a record (+11.9% per year) —
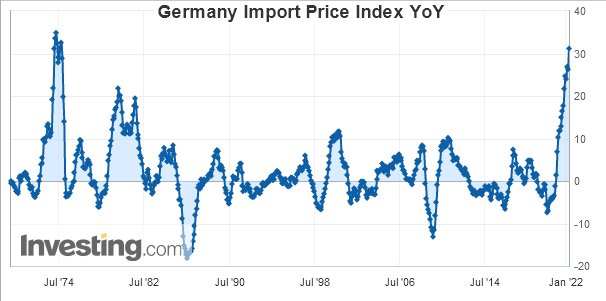
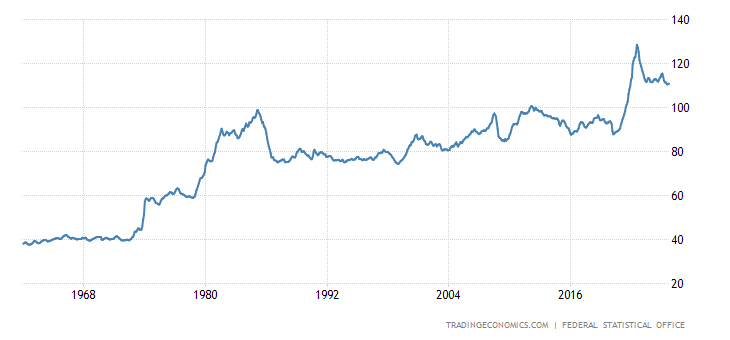
Import prices in Germany +31.2% per year, the highest since 1974:
Export prices in Australia +18% qoq – the highest in almost half a century of data acceptance:
Household credit growth in the Euro Area +4.5% per year, this is the peak since 2008:
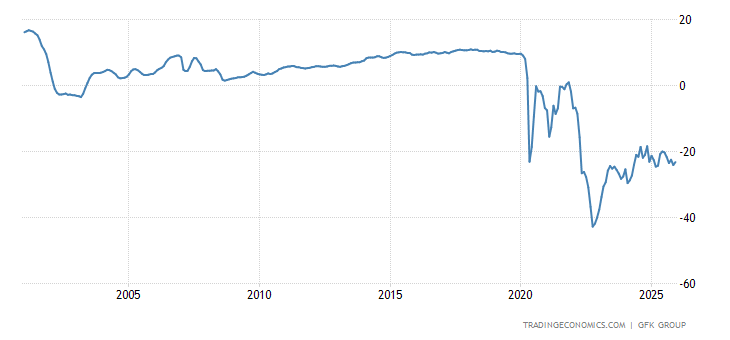
Germans are extremely pessimistic —
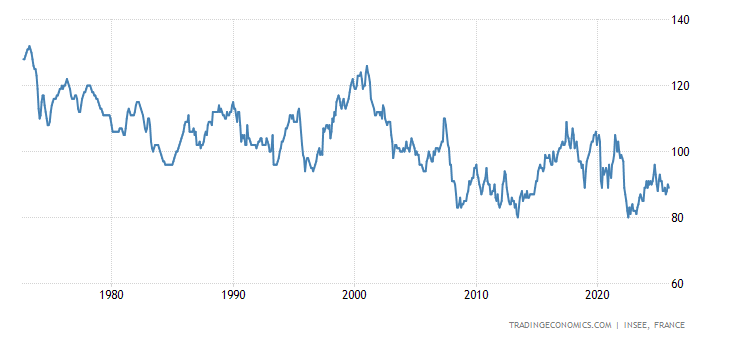
The French — the most since 2014:
Italians — for 1.5 years:
France household consumption -1.3% per month, over the past 4 months there was only 1 positive figure —
Retail sales in Spain amounted -3.8% m/m and -4.2% y/y —
Retail South Korea -0.5% per month, 3 months in a row without a positive figures —
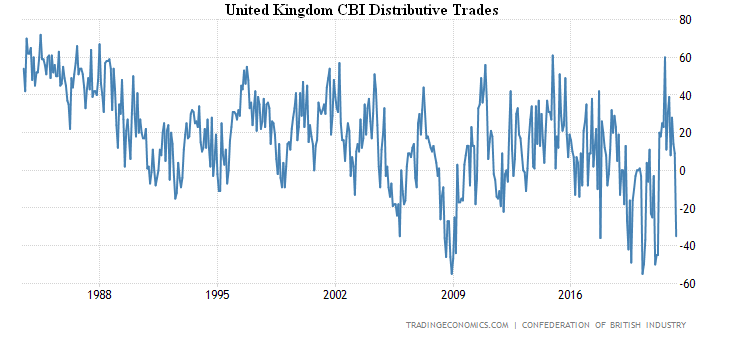
UK retail sales balance close to record lows (-35) as prices skyrocket:
The Central Bank of Japan has not changed its policy, acquires unlimited volume of government bonds in order to prevent growth of their yields above 0.25%. The Central Bank of Russia cut the rate to 14%.
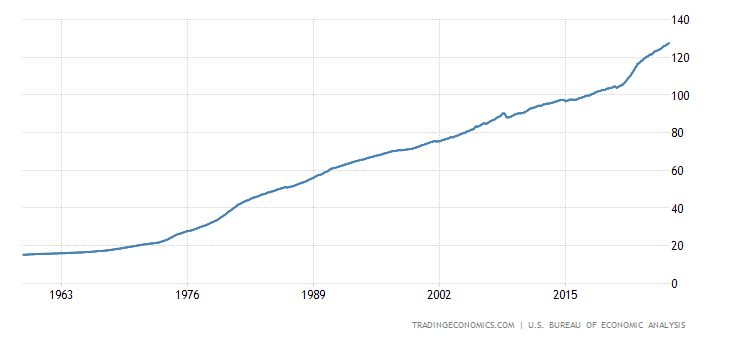
Summary. In addition to the first section, US households have not only reduced consumption (which is why GDP fell), but their savings have started to decline:
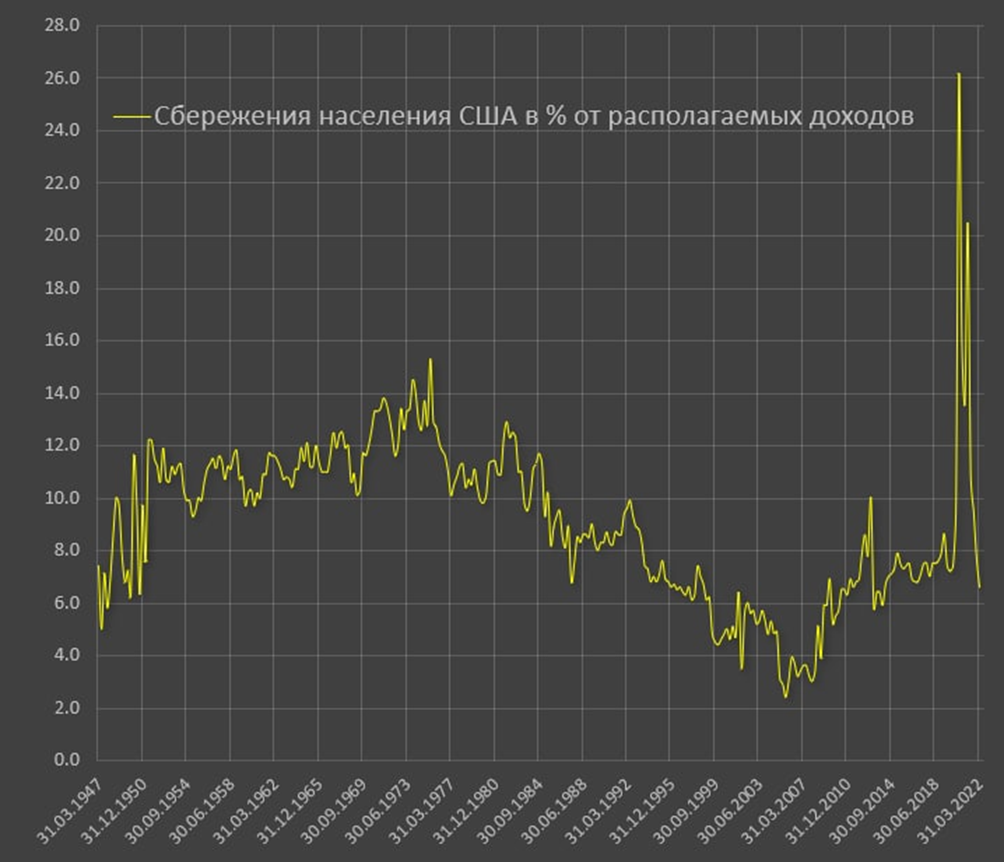
- US Population Savings as % of Disposable Income
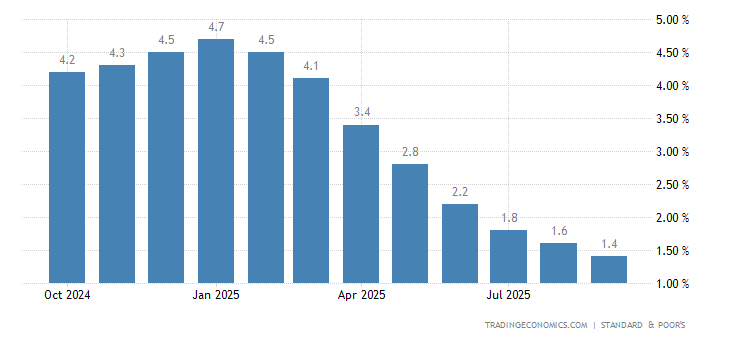
In the face of unheard-of income, savings have soared out of fear of losing jobs, but they have now collapsed below historical levels, for the US — about 10% of real disposable income. In general, to support current consumption, US households have to go into savings (a similar situation in Russia). But this does not help, because the rate of growth of consumption expenditure in real terms is dramatically reduced. At an annual rate of 4.7% vs. 16% in the second quarter of 2021, but this is the base effect. Quarterly performance does not exceed half percent, which forms an annual rate just above 2%. There is no doubt that by the end of 2022 the pace of spending will go deep into the red zone. So US GDP will fall rapidly, even without real inflation, and if we take into account the macroeconomic nature of the crisis, we have already noted that this is a 6-8% annual decline. However, if the US Federal Reserve hikes the rate seriously, the pace of decline will increase.
The sharp decline in living standards associated with the end of budget support came as a big surprise to the US monetary authorities. Otherwise, they would not have demonstrated such a sharp decline, but the trouble is that the economic system has almost ceased to respond to macroeconomic (monetary) regulation, so its scope has to be increased all the time. As a result of the first quarter, it is necessary either to return budget subsidies to households (banks have been refusing to do this for a long time) or to write off debts of households in order to increase their expenditures.
The first will inevitably increase the already critical level of inflation, the second will bring down the banking system. You can, of course, collect all the debts in a few large institutions and bring them down, but the problem is that the global dollar system is subordinate to these large institutions. And so the economic system has come to a point where support for the Bretton Woods system is actually lowering household spending — US GDP. This relations used to be much more indirect. Last but not least, the rate hike already announced by the US monetary authorities will inevitably reduce the standard of living of households, which already fell sharply in the first quarter of this year.
It is impossible to make appropriate decisions at the level of monetary authorities; these issues are resolved in the field of politics. For this reason, we expect inflation to rise in the United States, a significant drop in household incomes and, accordingly, an already legalized fall in GDP. As for the European Union, the fate of the victim is clear. In fact, the only countries that will break free from the crisis are those that can jump into two of the four emerging currency areas, Eurasian and Indian. In China, a US-scale crisis is almost inevitable, but it has a completely different political model.
We wish all our readers a quiet and peaceful working week!