
Time period: 28 August – 3 September 2021
Top news story. According to official statistics, the US economy was the first to recover from the crisis. All we can do is admire.
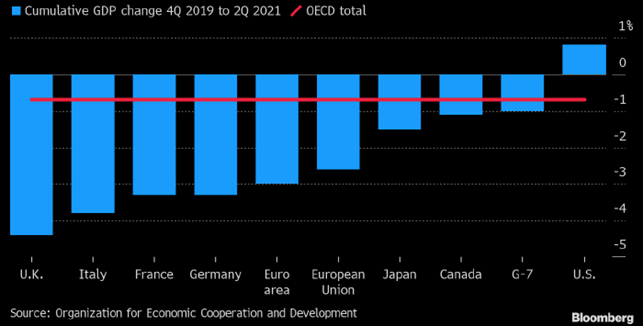
While readers of our Reviews realize that, given an official value of industrial inflation in the US of less than 7% and real around 20%, the optimistic figure should subtract quite a lot (namely, with a small error, the excess of real inflation over official inflation). This kind of distortion of statistics already reaches double-digit numbers – the difference between official US statistics on index PPI and official but complete data on industrial inflation now exceeds 13%.
In several previous Reviews, we have examined in detail the official figures for current GDP growth and have shown that at best by the end of the year it will be around zero relative to the beginning of 2021. So there is every reason to believe that the remarkable picture painted by official statisticians is not true.
Macroeconomics
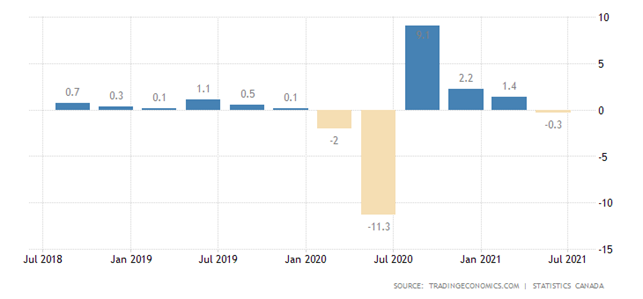
Canada’s GDP slumped unexpectedly by 0.3% per quarter in the second quarter. Separately in June, it was on the plus side (+0.7% per month), but in July it fell again (-0.4%):
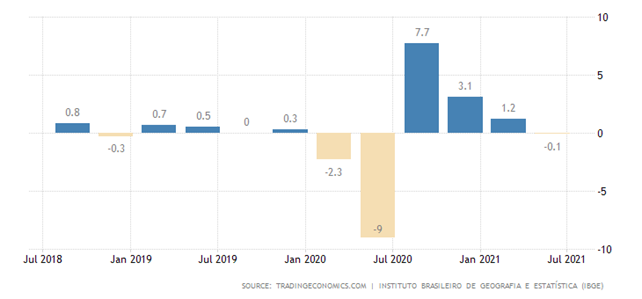
Brazil’s GDP returned to quarterly negative values, and the coronavirus had nothing to do with it, as industry and agriculture fell:
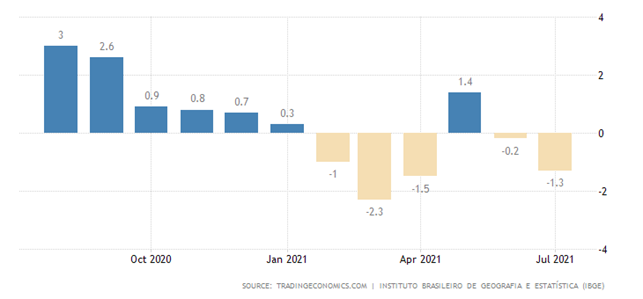
And Brazilian industrial production has shown 5 monthly negative values in the last six months:
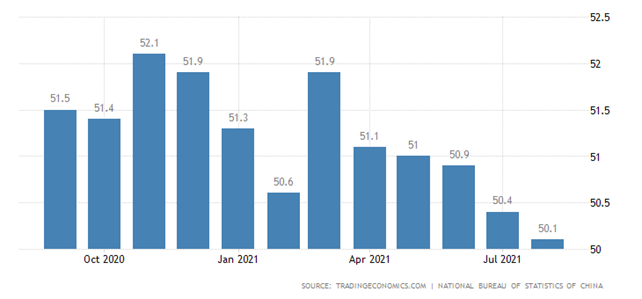
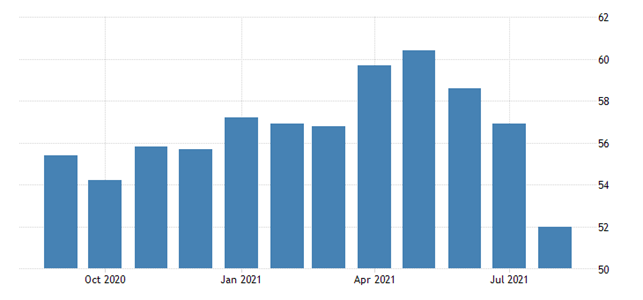
Manufacturing PMI (Purchasing Managers’ Index describing the state of an industry; index value below 50 signifies stagnation and decline) China at the official trough since February 2020 – there are new orders, export sales and employment in the recession zone:
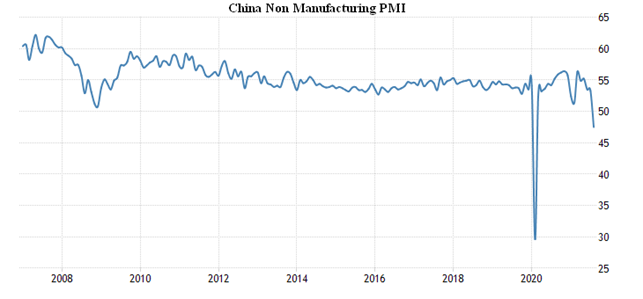
In the service sector, the PMI itself went into a recession (47.5 points, the lowest since February 2020):
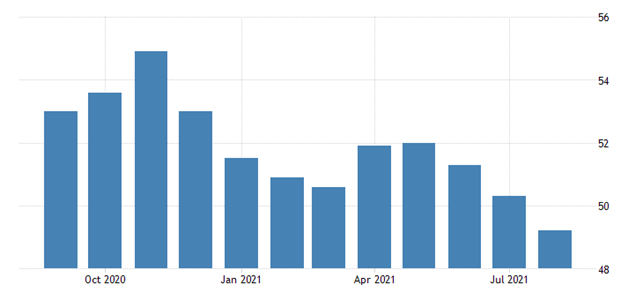
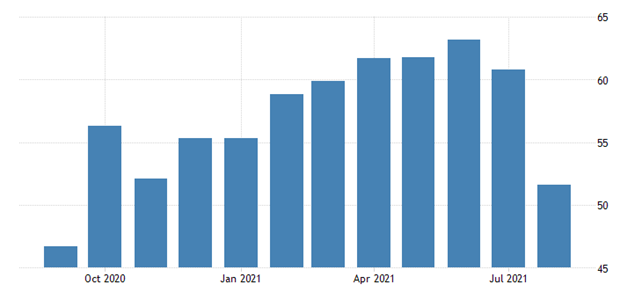
An independent assessment of China’s PMI production indicates that the recession is already evident:
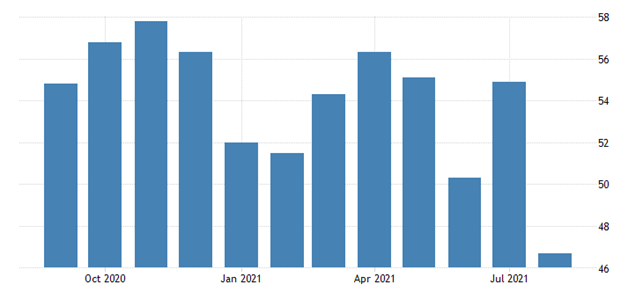
The picture in the service sector coincides with the official data:
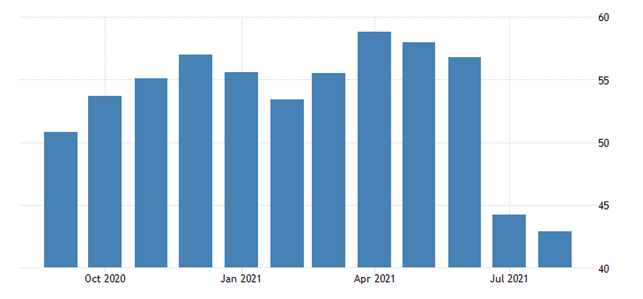
In Japan, the service sector is the weakest since May 2020 and is clearly in the recession zone (42.9 points):
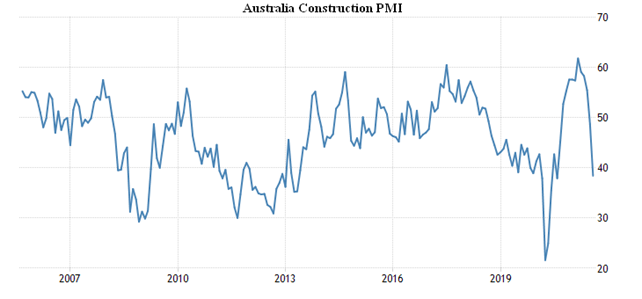
The manufacturing PMI Australia has an annual minimum in all versions:
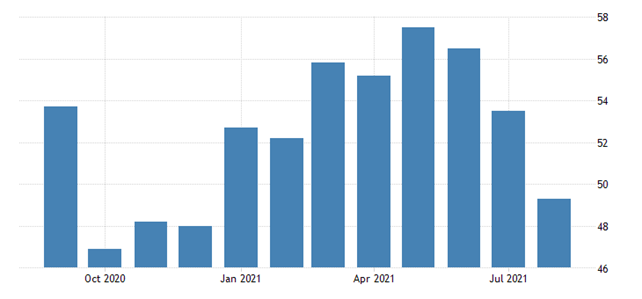
But in the service sector, the lowest since May 2020, and this minimum is deep in the recession zone:
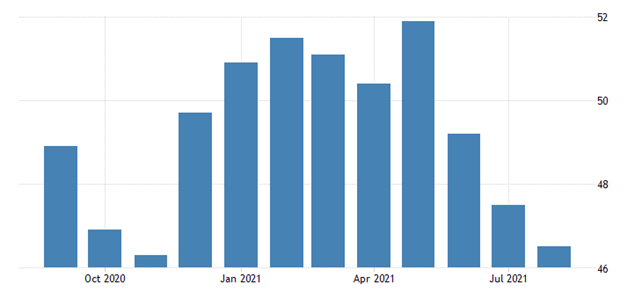
In construction, the annual minimum is very low (38.4 points):
Manufacturing PMI in Russia has plunged deep into recession:
And the Russian PMI of the services sector was in a recession zone for the first time since the beginning of the year:
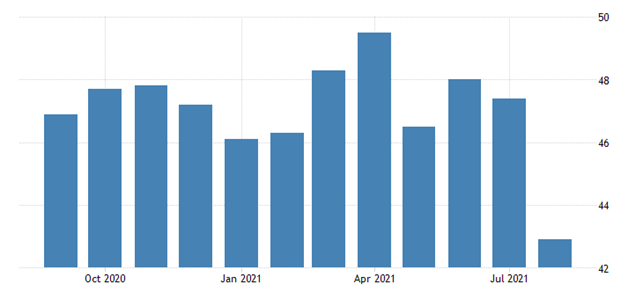
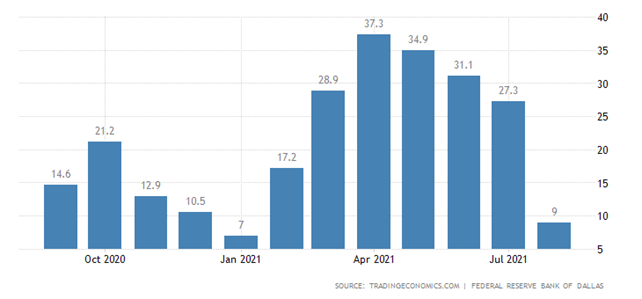
United States Dallas Fed Manufacturing Index has fallen three times to a minimum since January, which, incidentally, supports our hypothesis that the US growth rate is a little overvalued:
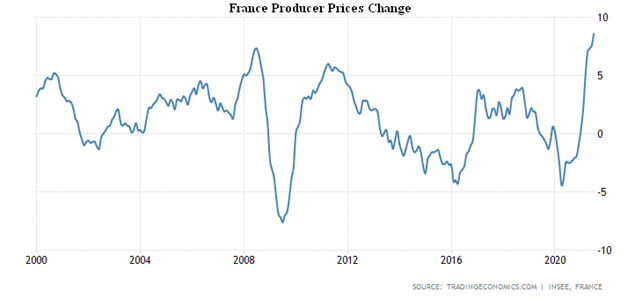
And then there’s inflation. Let’s remind you, they’re probably very low compared to reality. PPI (Producer Price Index) of France 8.6% per year – the peak for 21 years:
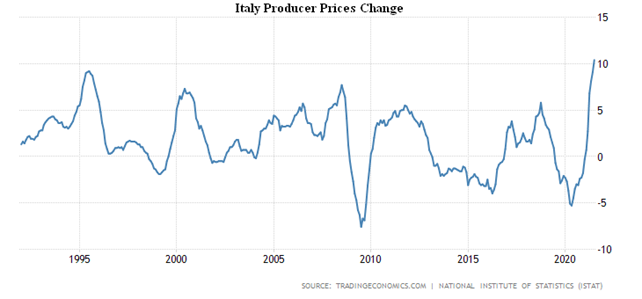
Italian PPI + 10.4% per year – a record for 29 years of observation:
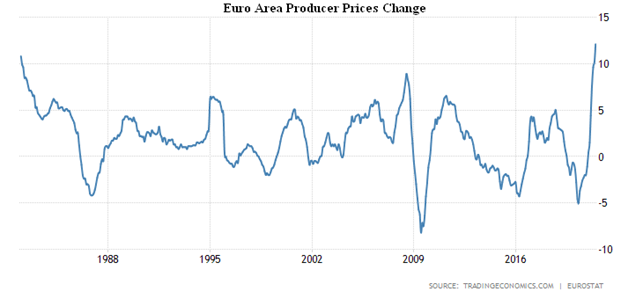
PPI of the Euro Area as a whole +12.1% is an unprecedented rate in 40 years of statistics:
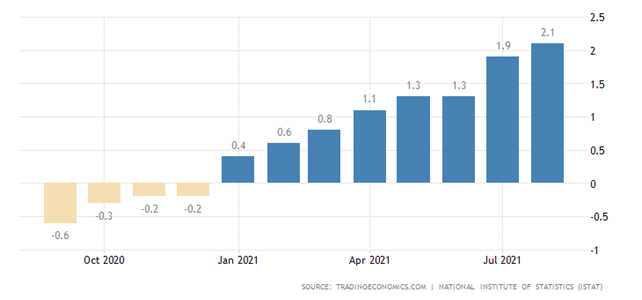
Consumer inflation figures are more encouraging, but they also set records: Italy’s CPI 2.1% per year peaks since 2013:
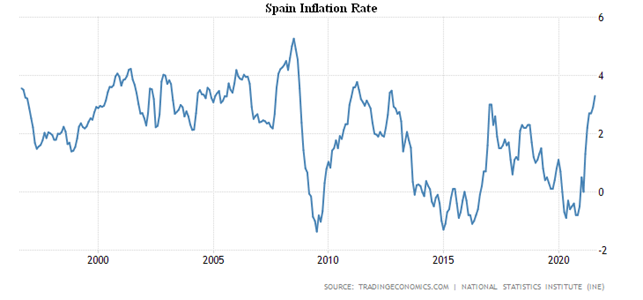
CPI of Spain + 3.3% per year, the highest since 2012:
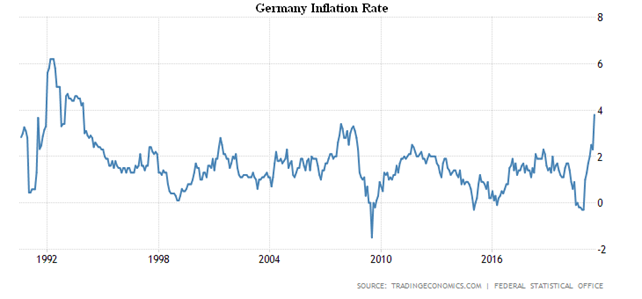
CPI of Germany + 3.9% per year – the highest since 1993, and recently food prices have been actively rising (+ 4.6%):
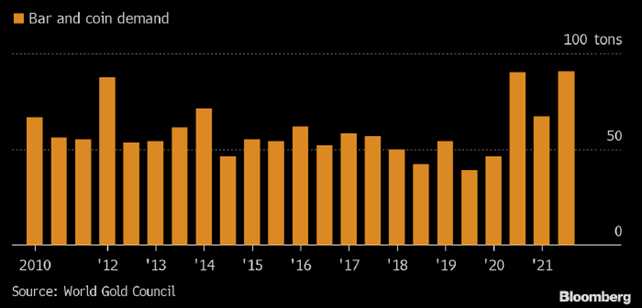
Not surprisingly, Germany has become active in buying gold as a means of protecting its savings:
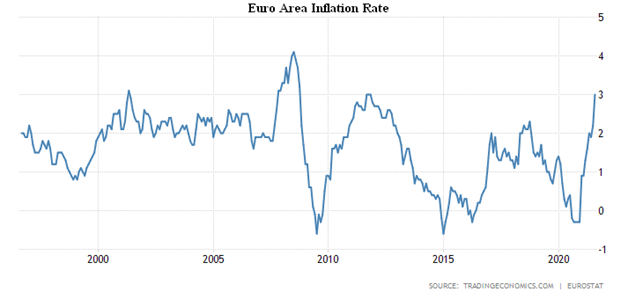
CPI of the Euro Area as a whole + 3.3% per year, peak since 2011:
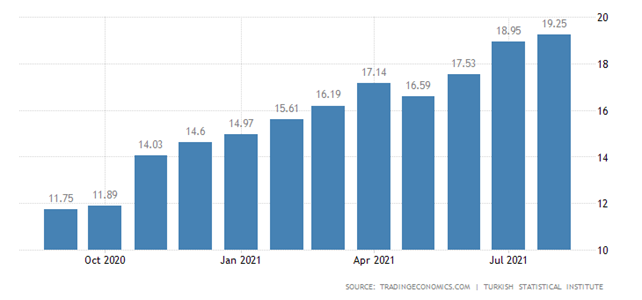
In Turkey, everything is completely sad, CPI + 19.25% per year is the highest since April 2019:
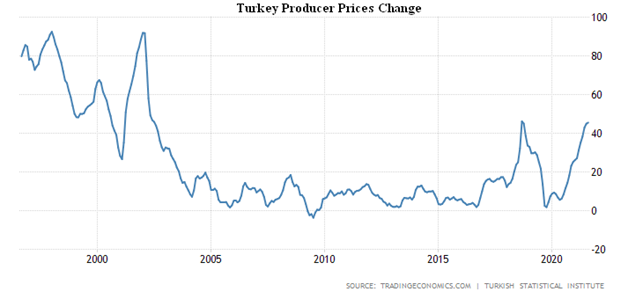
And Turkey’s PPI is + 45.5% per year, which is only 0.6% below the 19-year high set in 2018:
Net mortgage lending in the UK went to negative by a record value in 35 years of observations:
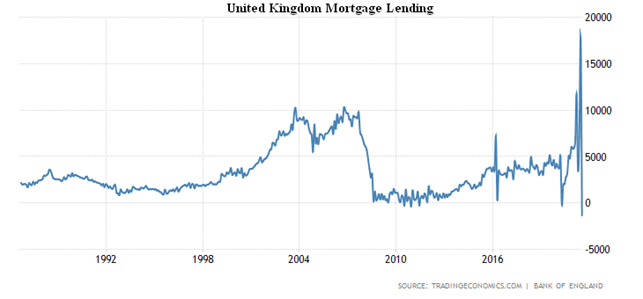
Not surprisingly, housing prices are rising at a record rate of 11% per year.
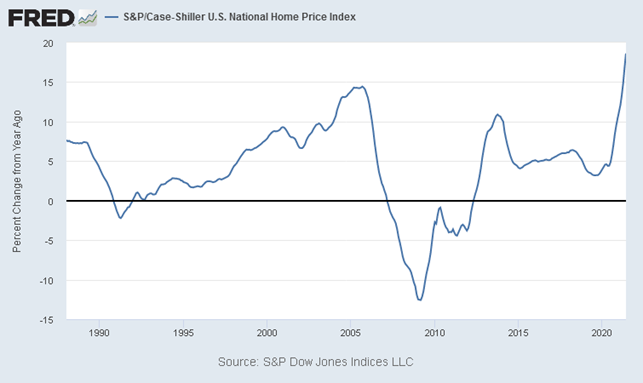
US National Home Price Index from S & P / Case-Shiller in June + 18.6% per year, it’s a record for 33.5 years of observation:
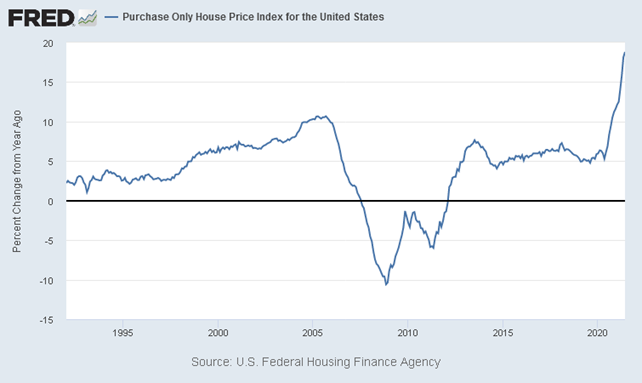
A similar pattern among official entities is 18.8% per year:
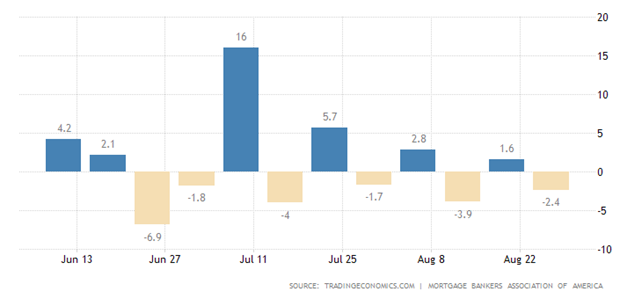
US mortgage applications are falling again:
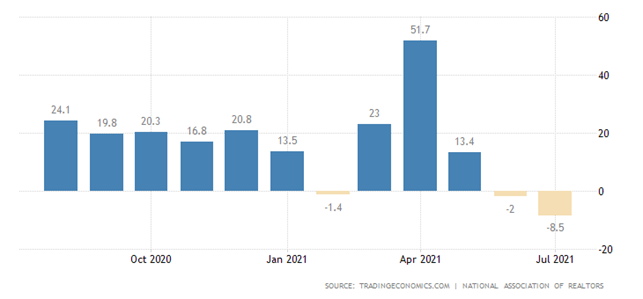
Unfinished sales of secondary housing in the United States -8.5% per year – an anti-record since April 2020:
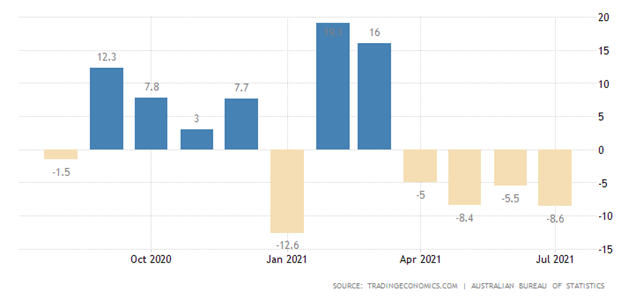
Dwelling approvals in Australia are -8.6% per month, the fourth consecutive negative value, and overall since the beginning of the year the trend is clearly negative:
The Euro Area consumers’ confidence is the worst in four months, and the propensity for large purchases has fallen:
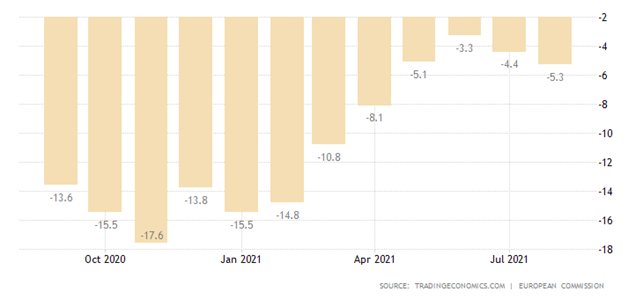
At the same time, their inflation expectations were at their peak in 10 years:
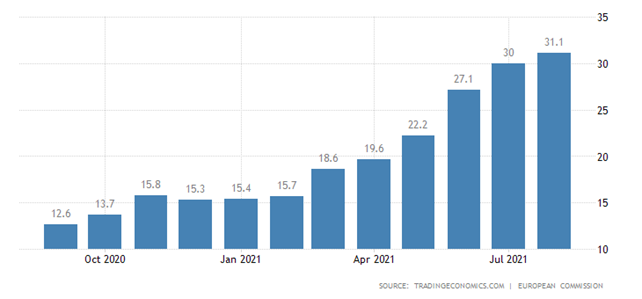
Incidentally, it is very interesting to compare expectations with official inflation rates.
Consumers in the US have been pessimistic at the most since February:
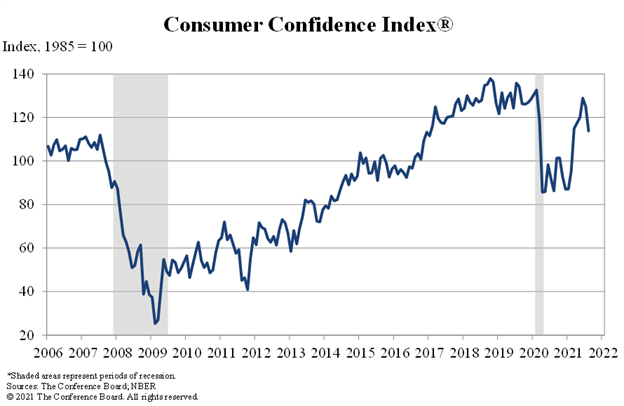
The forecast did not foresee such a fall, and the expected index would be around 125.
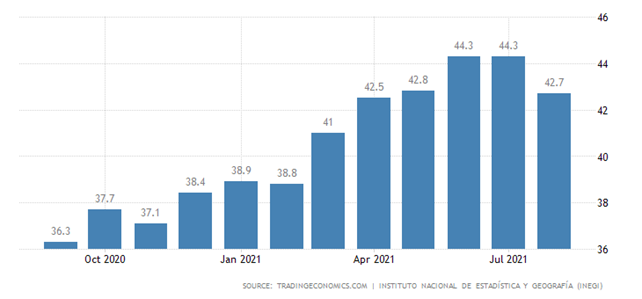
The usually optimistic Mexicans are getting more grim too:
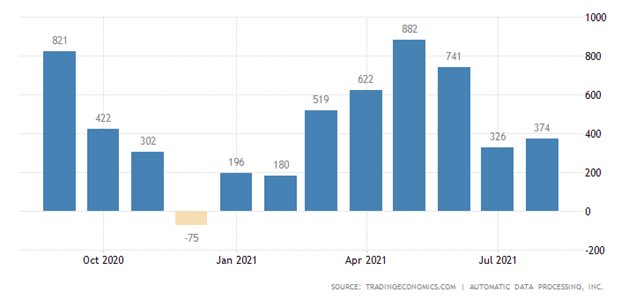
Private sector employment in the US (ADP survey) grew twice weaker than expected:
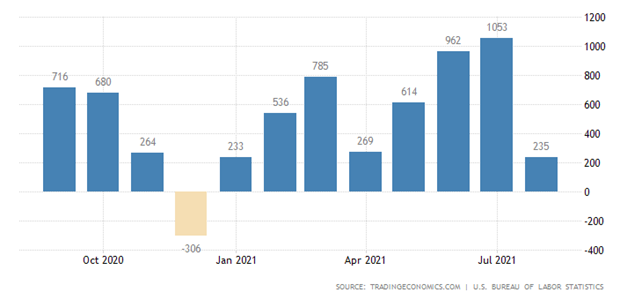
Job growth in the economy as a whole has been three times lower than forecast and minimal since January, and retail employment has fallen sharply:
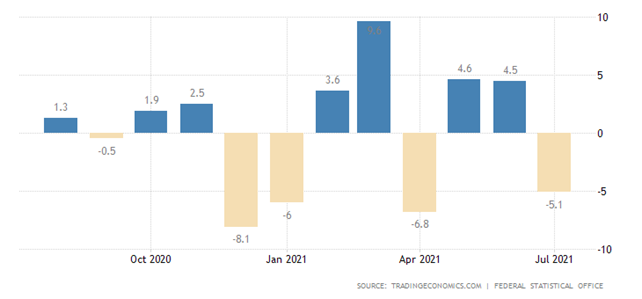
Retail in Germany unexpectedly dropped sharply by 5.1% per month:
France is also down (-0.7% per month):
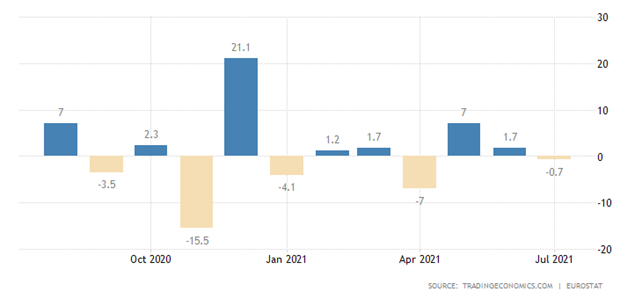
The same situation prevails in the Euro Area as a whole (-2.3%) and in Switzerland -2.8% per month, the fourth consecutive negative, and the sixth in the seven months since the beginning of the year.
Summary. At the end of the summer, statistics are abundant. We do not say everything – mainly those that show a clear pattern or, on the contrary, break a previous pattern. It is easy to see that these figures are not encouraging. The economic crisis is not only continuing; it is intensifying.
At the same time, the world economy has firmly entered the situation which in the late 1970s became called “stagflation”: high inflation combined with economic recession. From this, by the way, it immediately follows that it is impossible to call this situation a “recession”, it is a structural crisis. More details about this crisis can be read in M. Khazin’s book “Reminiscences about the Future”, we will return to specific features of the structural crisis in the next review, this and so turned out to be very rich.
I wish all readers successful business despite the general market conditions!