
Period: 4 – 10 July 2020
Top news story: The main news of the week was the increase in gold prices, which exceeded the highest values of 2011 (at the end of the week – 1802.20 USD per troy ounce). Although in real terms the price is still below the highest, taking into account inflation, this increase shows that professional market participants have a realistic view of the world economy and the United States dollar.
Gold preceded the dollar as a single measure of value and it was debased as an asset in many ways for many decades. This has now been reversed and is a very good marker of the situation: the better the economy, the lower the price of gold. The worse it gets, the more gold becomes valuable.
Macroeconomics
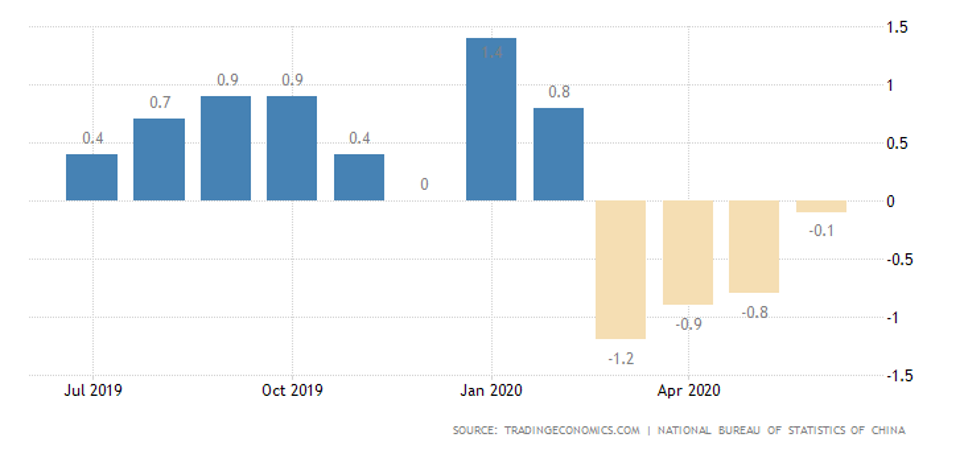
In China, deflation continues in June, but annual growth is sustained by high food prices:
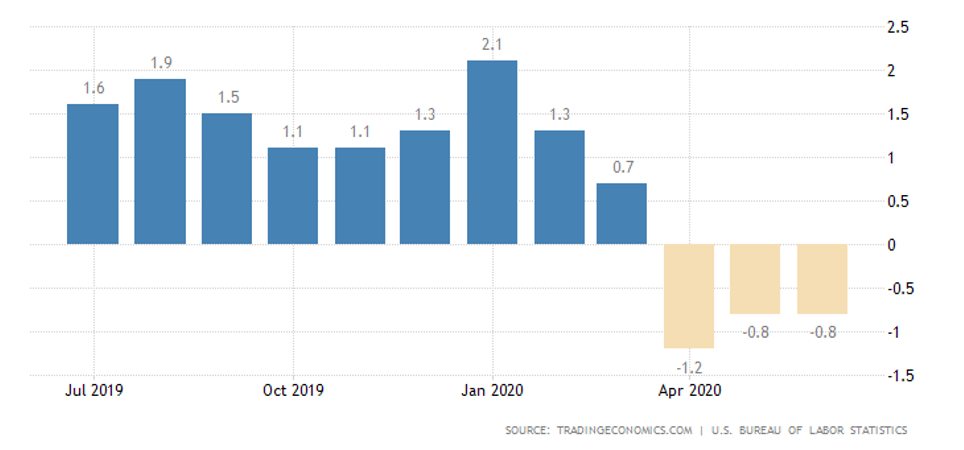
US PPI was lower than expected:
Australian vacancy announcements increased by 42% per month in June, but remained 45% lower than last year.
Industrial orders in Germany increased by 10,4% per month in May, but slumped to 29,3% per year (and by 30,8% by February of this year). A similar picture emerges in German industrial production: 7,8% per month but -19,3% per year. The situation is similar in Spain: 14,7% per month and -24,5% per year.
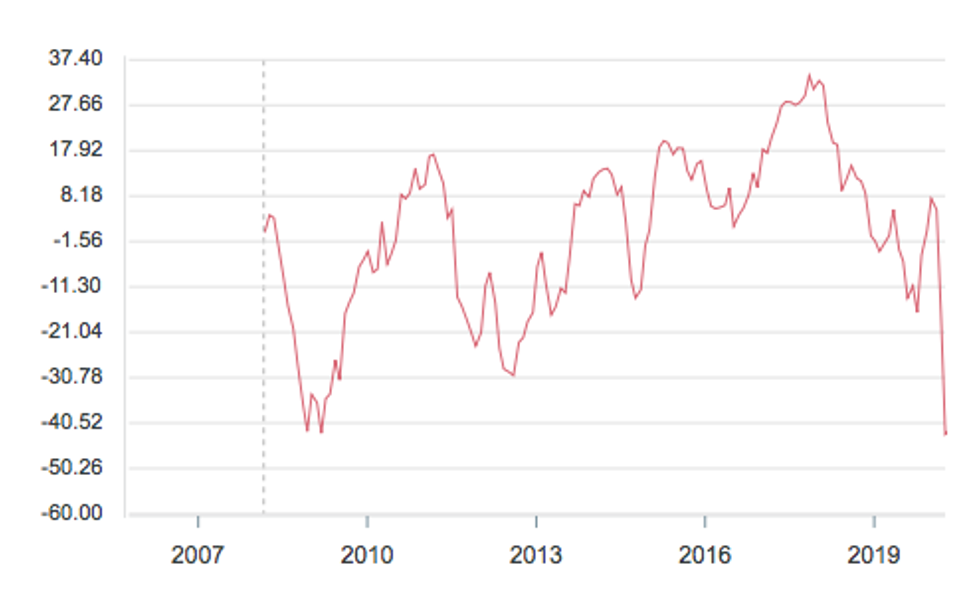
Sentix eurozone investor confidence is recovering slower than expected:
Retail sales in the eurozone in May surged 17,8% per month (on pent-up demand), but remained 5,1% lower than a year ago.
Japanese incomes and salaries declined by 2,1% per year in May, to the lowest in five years, and expenditures by 16,2%per year (and 0,1% per month instead of the expected gain): a 19-year negative view.
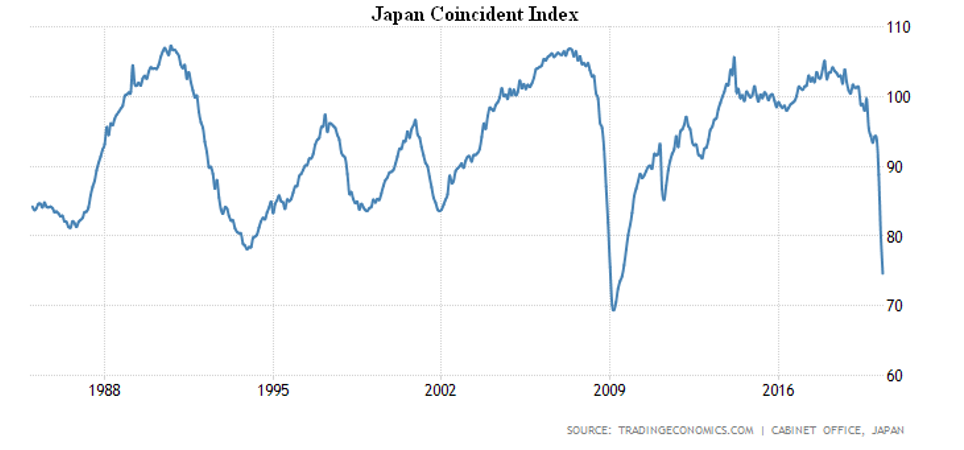
Japan’s leading indicators recovered slightly in May, but remained very low:
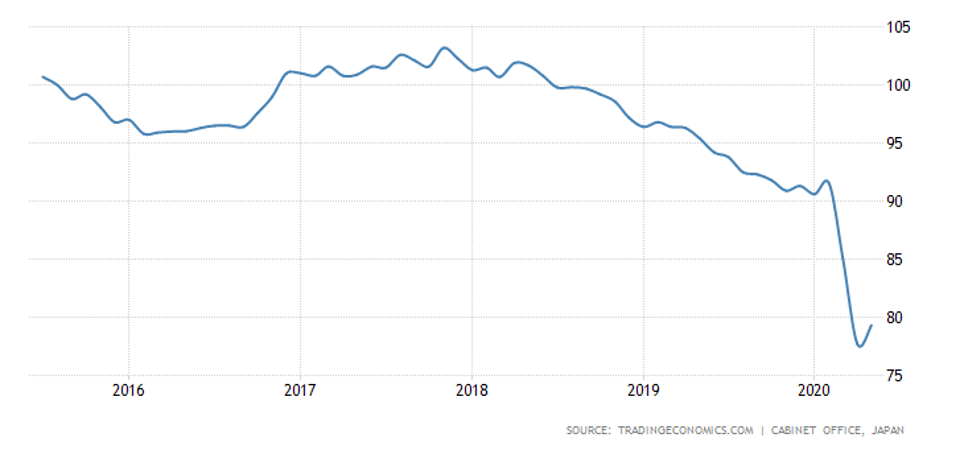
And the coinciding indicators fell to an 11-year low:
Machine-building orders in Japan in May increased by only 1,7% per month after -12,0% in April; the year-long decline remained strong (-16,3% after -17,7%).
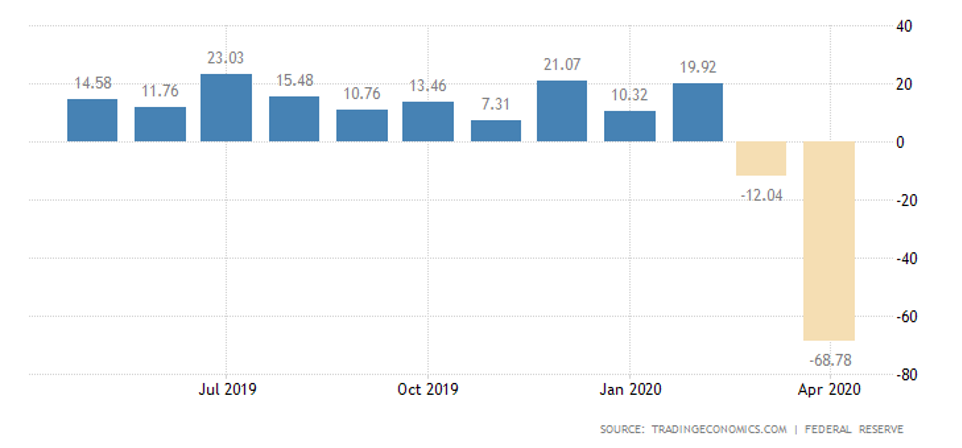
Consumer credit in the US remained negative in May:
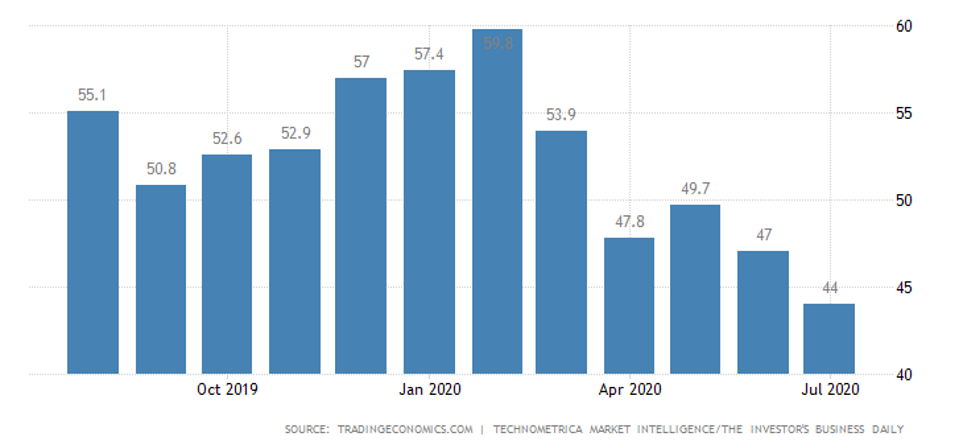
Car sales in the USA by June made up only half of the spring losses, while the IBD / TIPP economic optimism index was the lowest in 5 years – already in July:
New US vacancies are slowly increasing:
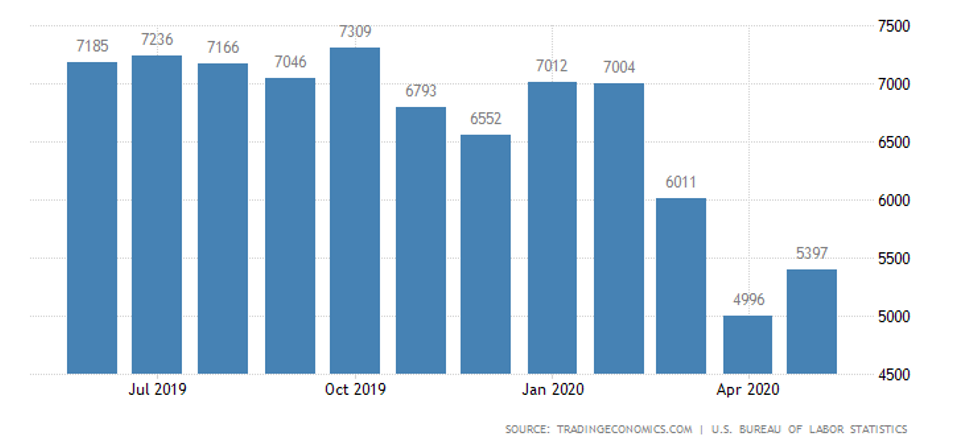
The number of recipients of unemployment benefits is also slowly decreasing:
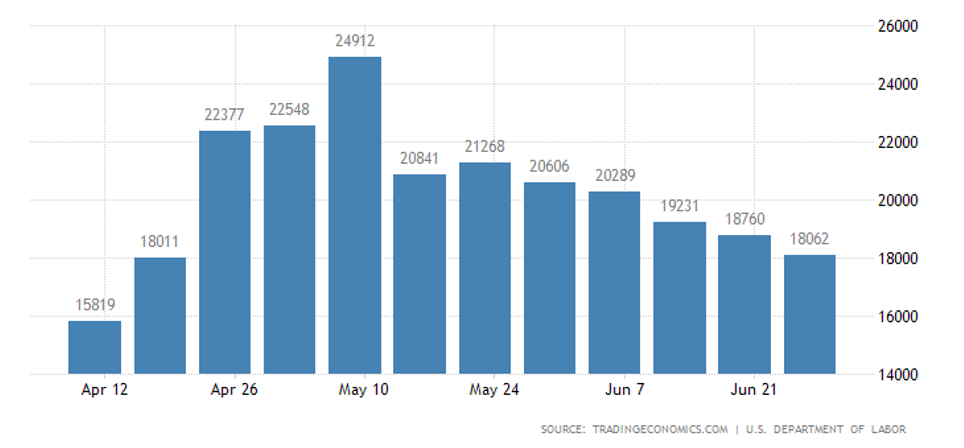
In this case, the topic raised in a previous review should be revisited. This is a distortion of labor statistics by the US Department of Labor. The fact is that real unemployment in the USA does not decrease, since in addition to the regular benefits system, there is also an emergency (linked to the COVID-19 epidemic). In this system, the number of requests increases every week. According to an official week-long report, the total number of beneficiaries for all programmes has been increasing for a month and by the end of June almost reached 33 million.
This is more clearly displayed in the graphs in the CBS article.
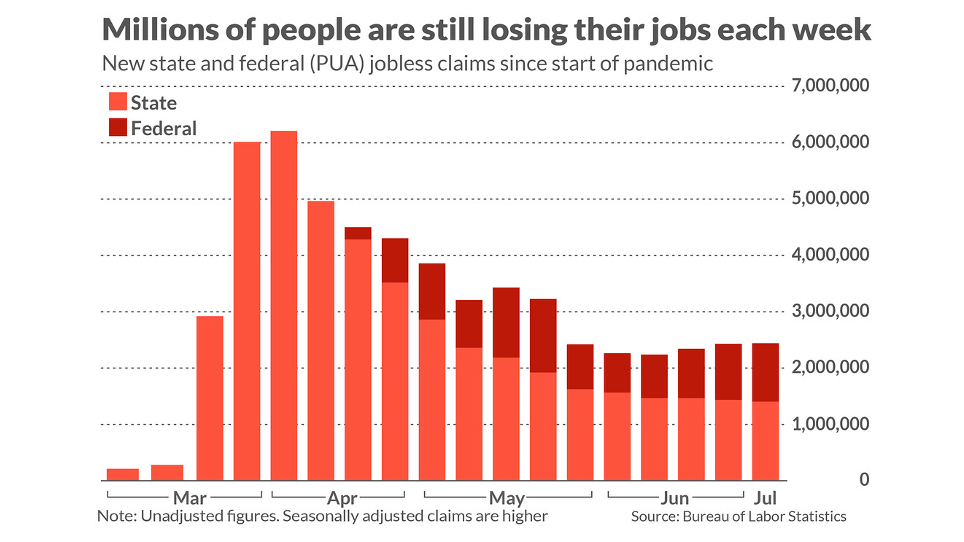
It also shows that the weekly increase in new unemployed also increases throughout the last month – the same is larger on the graph MarketWatch:
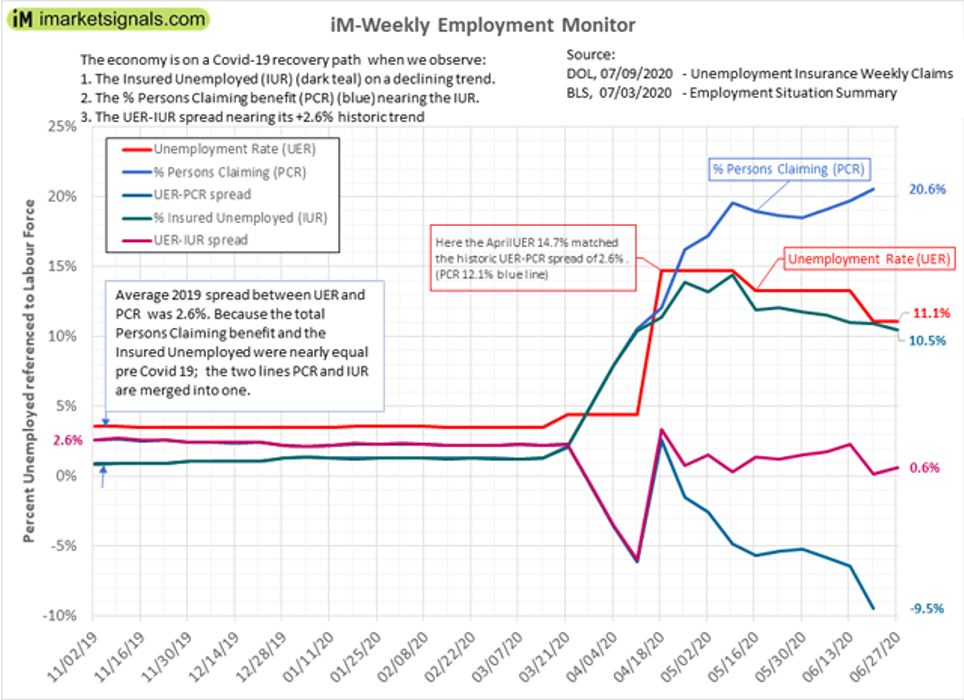
Finally, a very graphic picture emerges from this material:
The Central Bank of Australia left interest rate at a record low of 0.25% and has pledged to maintain the economy.
Summary. An example of a detailed analysis of the unemployment situation in the US shows the extent to which the basic statistics offered by official bodies are incorrect. In the US, even official unemployment rates are now well above 20% – not at all the 11% reported by the Department of Labor. The same situation in all other countries, as political leaders cannot afford to panic.
In order to understand the real situation, it is necessary to closely follow the less «public» indicators, in particular, for example, a good indicator is the price of gold. But this is indicative of global trends, and in each region or industry the situation may be more complex and non-trivial.
In our analysis we are based on the theory of crisis, developed for 20 years (the first book on this topic, which, by the way, has a chapter dedicated to gold is «Sunset dollar empire and the end of the Pax Americana» dating back to 2003). Therefore, we hope that our reviews will provide readers with a more objective picture than official and corporate reports.