
Period: 10 – 16 October 2020
Top news story: The US election is literally weeks away, and it is the pre-election situation that has begun to shape the current economic agenda. In particular, the stock market stabilized against forecasts of Joseph Biden’s victory. On the other hand, however, fears have increased that the Democrats will not be able to gain control of the upper house of the Congress – the Senate – making it difficult to agree on new aid programmes for the economy.
The 2016 elections revealed the highly speculative nature of these arguments. Trump voters are reluctant to talk about it, and pollsters themselves are mostly inclined to support Democrats (Joseph Biden), and voting patterns are changing dramatically. As a result of these factors, survey samples are becoming increasingly unrepresentative. However, in the face of mass propaganda, they are quite important.
However, the general news background is not encouraging. We’ll see the exact data in the next section, but before we look at the results, we can see that there are no signs of any optimism. And this only increases the general nervousness. For our part, we can only note that there is a strong likelihood that, after the elections, regardless of the outcome, an attempt will be made to at least temporarily suspend the stimulus measures. Another question is for how long will the authorities have the will to tolerate a dramatic deterioration of the situation?
Macroeconomics
Machine-building orders in Japan increased by only 0,2% per month in August, and the annual downturn remained huge (-15,2%).
Industrial production shows a similar pattern, with monthly growth falling to +1,0%, reducing the annual decline from -15,5% to only -13,8%.
The situation is similar in the Euro Area: monthly growth in August slowed to + 0,7% and the annual decline stopped decreasing ( -7,2% against -7,1% a month earlier).
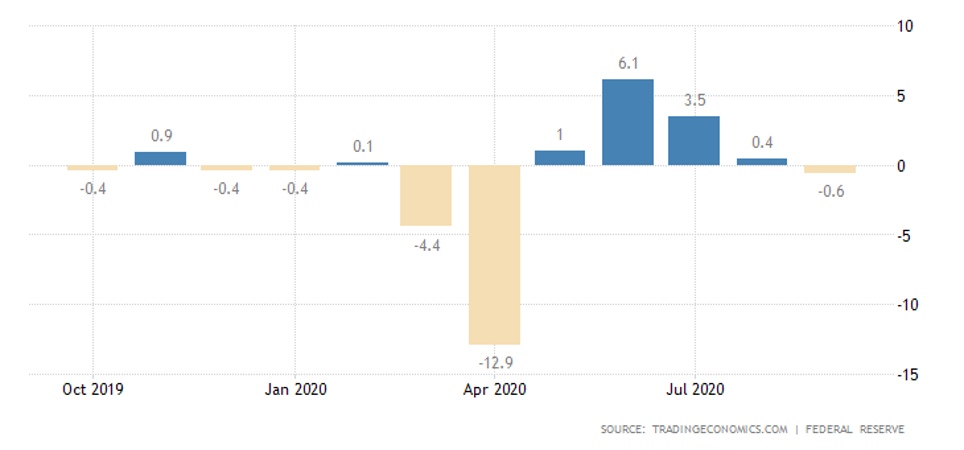
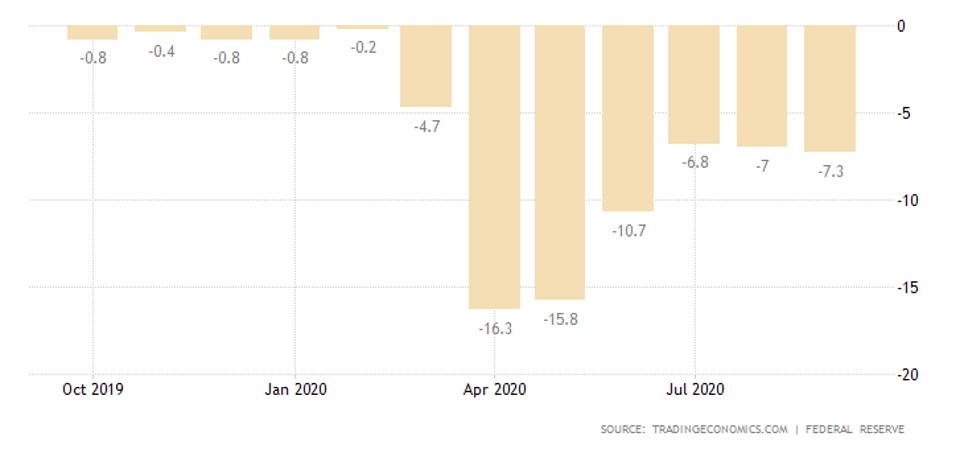
And in the US, the situation has been deteriorating for two months: in September -0,6% per month (instead of the expected 0,5%) and -7,3% per year:
According to ZEW, economic sentiment in Germany suddenly deteriorated to a 5-month low in October:
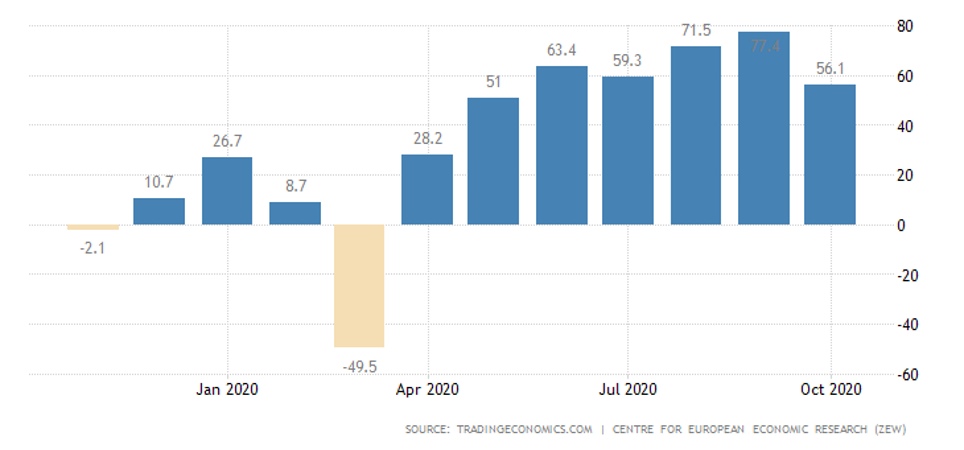
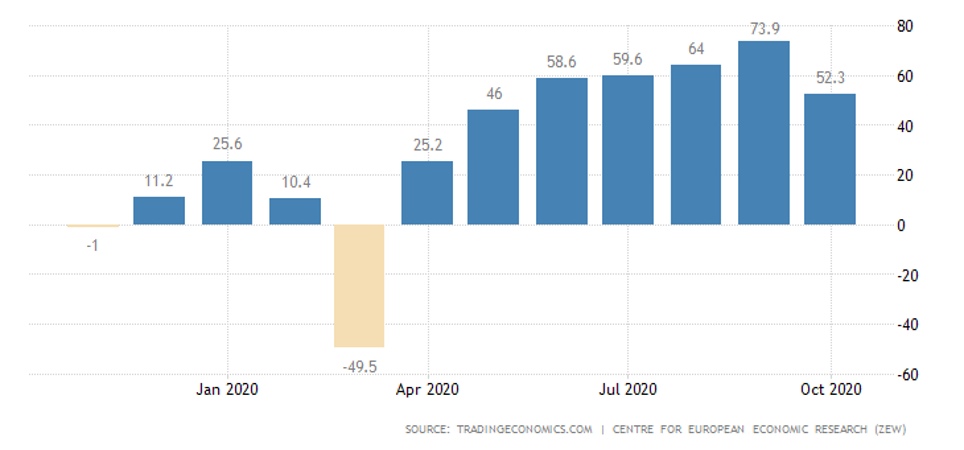
Similar for the Euro Area as a whole:
China’s trade surplus at six-month minimum, exports and imports at record peaks:
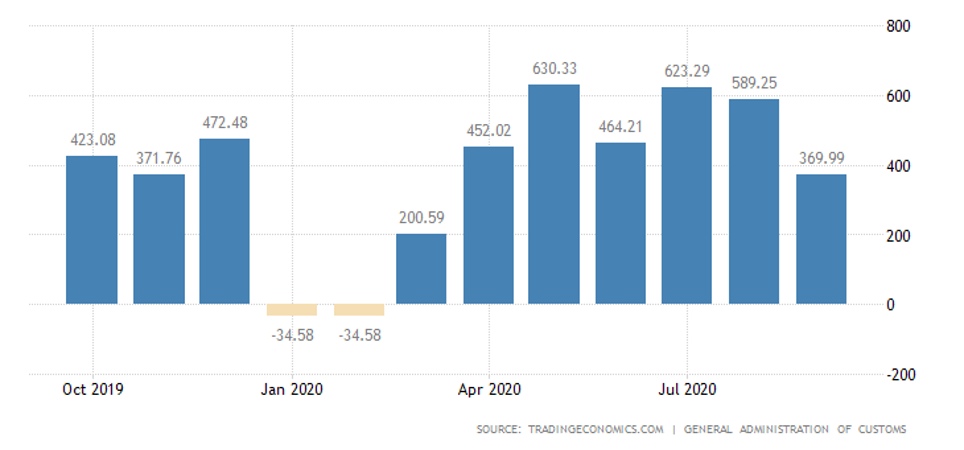
Note that this low surplus (in annual terms) has two meanings. First, it means that world demand for Chinese imports is dropping, and consequently prices have to be lowered. Second, it suggests that China has begun to have problems with the sterilization of excess money supply.
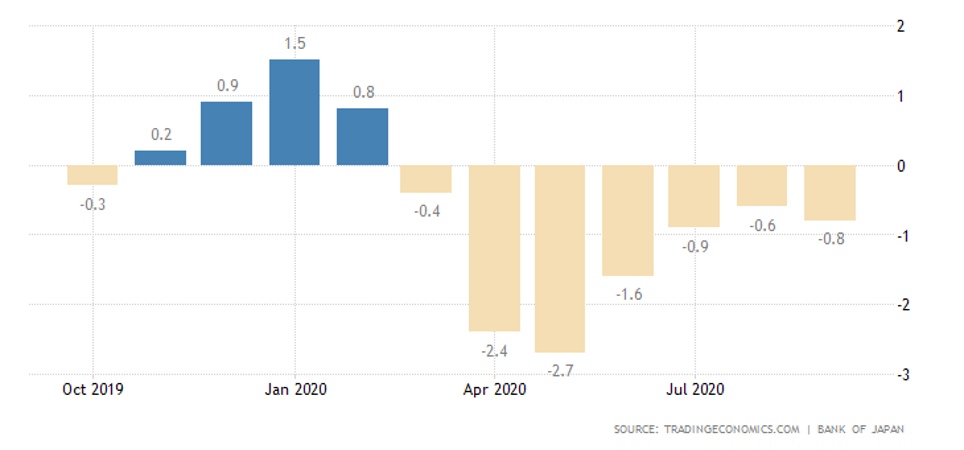
The Japanese PPI deteriorated again:
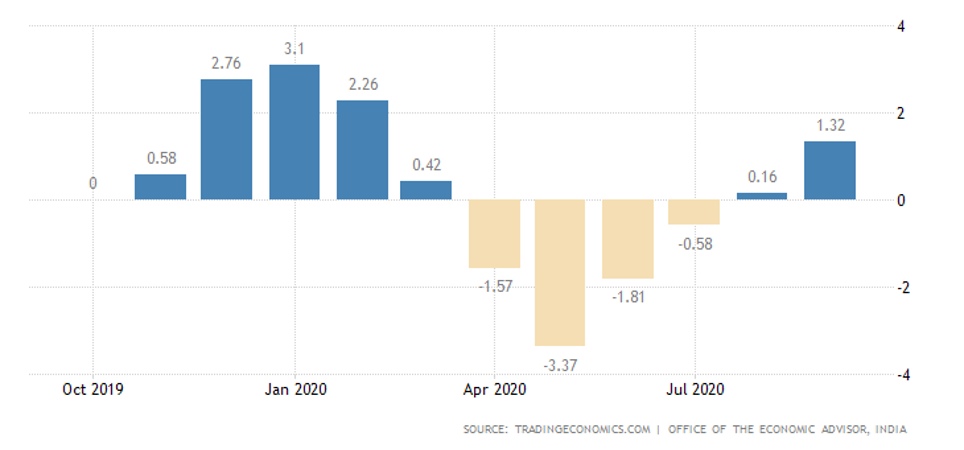
In India, September CPI is at its highest since January and is approaching a peak in 6,5 years. Wholesale prices in India are also increasing, especially for foodstuffs (it has 8,3% per year):
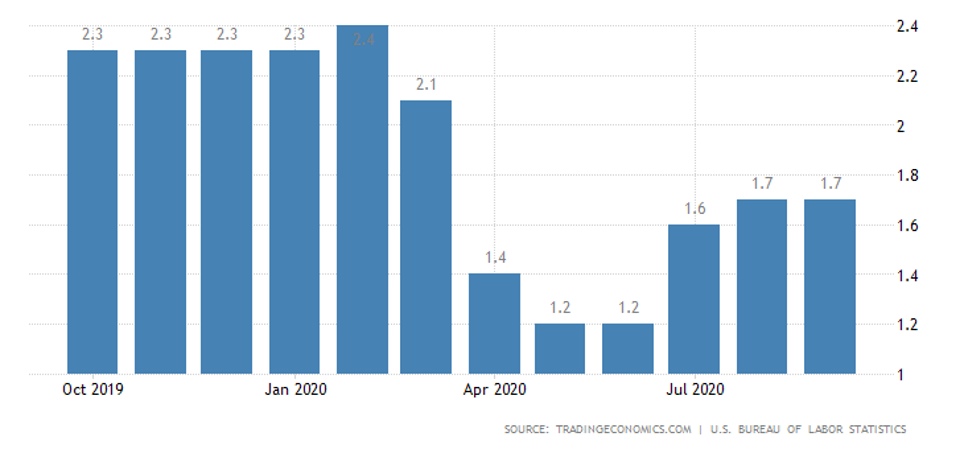
The US CPI growth continues to slow down (+ 0,2% per month in September), despite a record surge in used cars (+ 6,7%). But the annual increase is getting stronger (+ 1,4%; semi-annual peak).
Without food and fuel, the pattern is similar:
The US PPI surged by 0.4% per month instead of the expected 0,2%, annual growth peaked in 7 months (+0,4%). Without food and fuel, 0,4% per month and 1,2% per year, clearly exceeding projections. In fact, it is the beginning of inflationary processes that can be greatly accelerated if the financial markets are sagging, because it is they that are now being used in the US to sterilize the excess money supply.
In China, the process is reversed: in September the CPI has only 0,2% per month, so annual growth has been minimal since February 2019 (+1,7%):
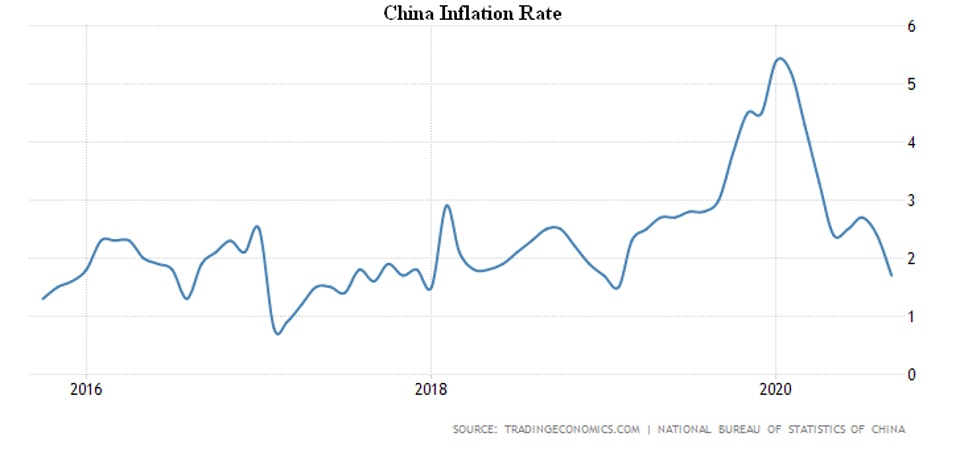
The PPI also weakened (-2.1% per year after -2,0% a month earlier).
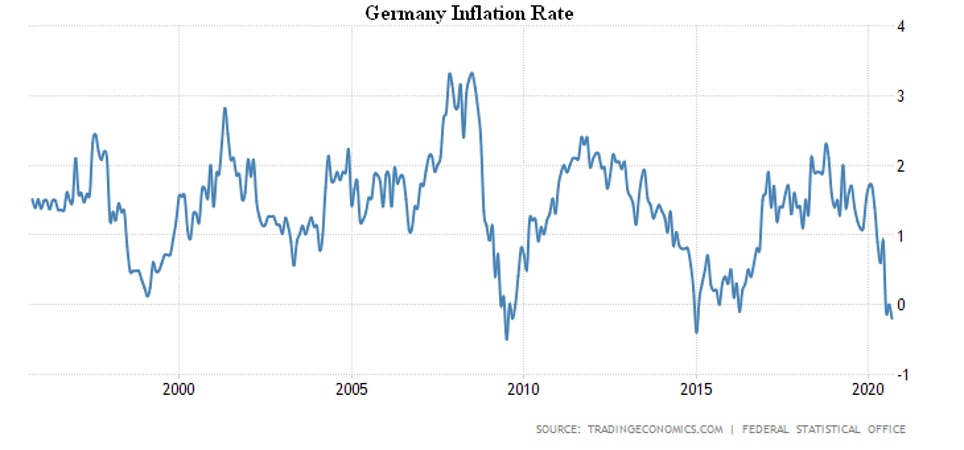
The same is in Germany: CPI -0.2% per month and per year (the lowest since January 2015):
And in France, the CPI (0,0% per year) has been minimal since May 2016.
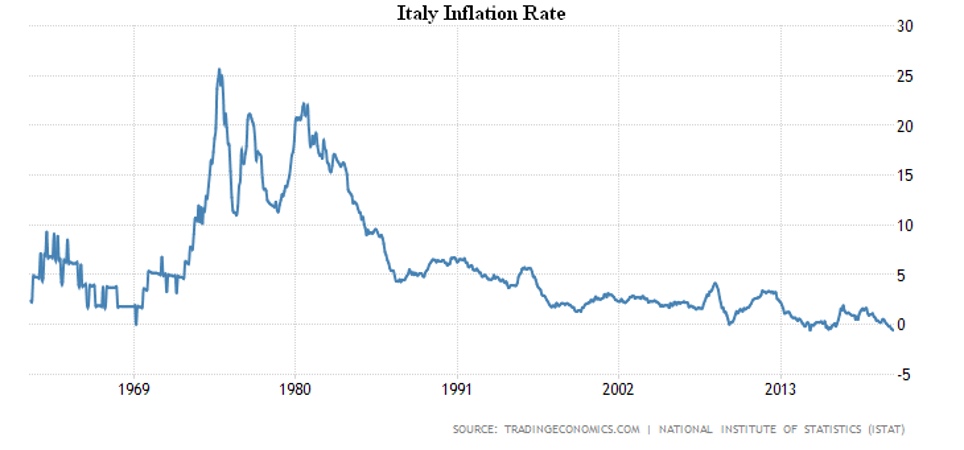
In Italy, it’s really tough: -0,7% per month (61-year low) and -0,6% per year (repeating the anti-record for 58 years of observations):
For the Euro Area as a whole -0,3% per year – the lowest since April 2016.
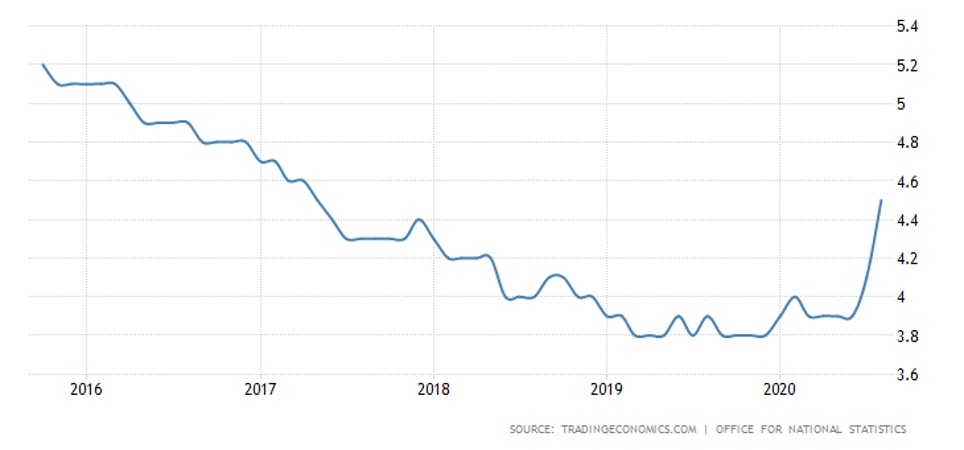
In Britain, summer unemployment has peaked since the spring of 2017:
In Australia, employment declined in September.
In the United States, jobless claims are maximum for seven weeks; without seasonal adjustments (which were recently changed) are in the highest in two months:
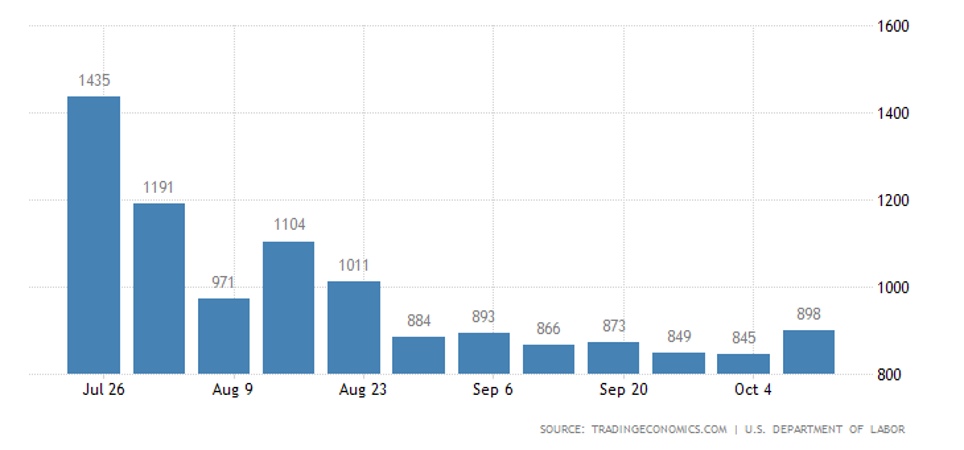
The total number of recipients of all types of benefits is still huge (more than 25 million).
The Central Bank of South Korea left rates at a record low of 0,5%.
Summary: The Euro Area data almost unambiguously say that the recession continues. And not only are the data on real production (they are a couple of months behind) but also data on prices – if there were prerequisites for growth, prices would start to rise. In the US, the situation is more complicated, most likely due to the onset of inflation. In any case, statistics released at the very end of the week indicate that capacity utilization in September fell to 71,5% with a projection of 71,8% and an August figure of 72,0%.
At the same time, production in manufacturing in September -0,3% month-on-month against the forecast +0,6% and August +1,2% m/m. Equally bleak picture of industrial production: September -0,6% month-on-month against the forecast of +0,5% m/m and an August figure of +0,4% m/m.
Unemployment figures confirm this picture. Since the different data correspond to different time intervals, it should be noted that the situation deteriorated again in the autumn. This can be seen in unemployment and price indicators, which confirm that our forecast is being fully realized. However, due to the US elections, the picture for a few more weeks will be extremely fragile and, for this reason, long.