Time period: 9 – 15 October 2021
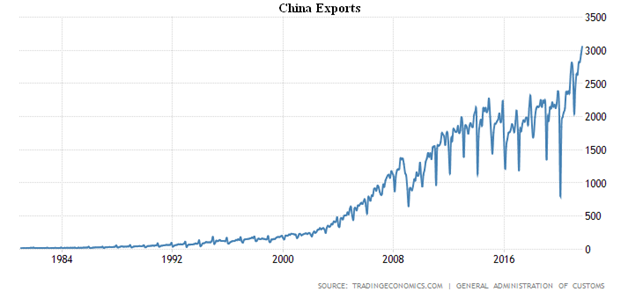
Top news story. The main news of the week was a sharp increase in exports from China:
If this is true, production in the US (which replaces China) has fallen dramatically. In particular, it can’t be excluded that this is the cause of the deadlock in ports on the west coast of the United States. It may be that official data greatly underestimate inflationary processes (for official inflation statistics in China, see the next section of the Review).
In this case, we have a significant increase in China’s economic problems. Taking into account the difficulties in the energy sector (mass blackouts, the scale of which, however, is not clear), it can be assumed that structural problems have begun to increase significantly. In any case, this situation is bound to trigger another round of inflation associated with increased transaction costs (including higher insurance premiums).
On the basis of macroeconomic data, it is difficult to make an accurate choice between these options. The Mikhail Khazin Foundation for Economic Research will soon try to consider these two options on its models and give a more or less objective picture of what happened. It is possible, however, that the situation will become clearer in the coming weeks, if US GDP/demand figures show a sharp decline.
Macroeconomics
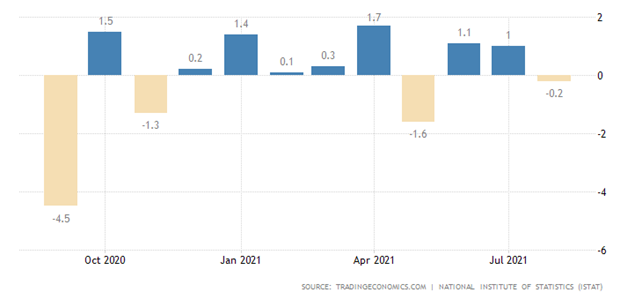
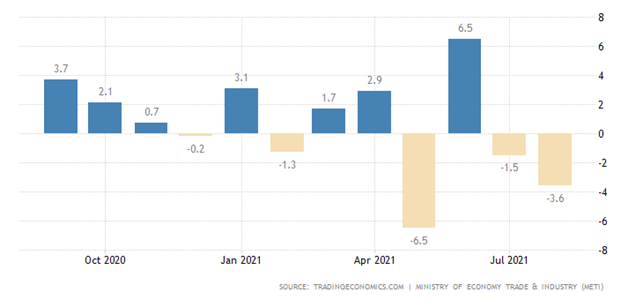
Industrial production in Italy fell to negative values (-0.2% per month):
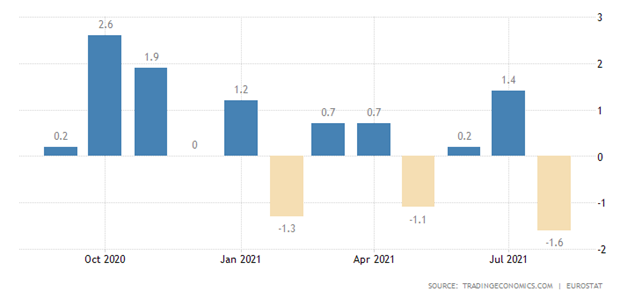
For the Euro Area as a whole, -1.6% per month – the trough since April 2020:
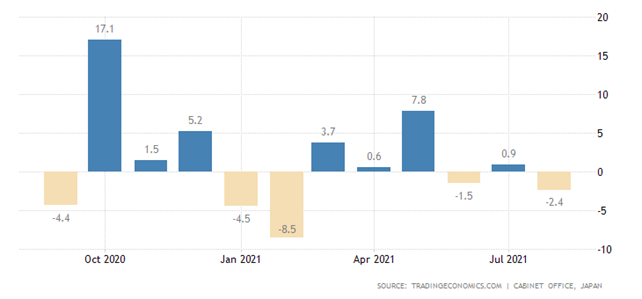
Japanese industrial output -3.6% per month – the third negative in the last 4 months:
Machinery orders in Japan -2.4% per month, in the manufacturing industry -13.4% (a record low since February 2016):
Here and below, we should not forget that if real inflation exceeds official data (which happens almost everywhere), the figures given will be even lower. Of course, if real inflation is lower than official inflation, these figures will have to rise, but we have not seen this in recent months.
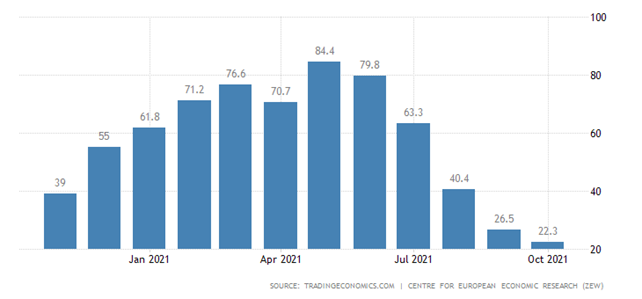
Germany ZEW Economic Sentiment Index is the worst since March 2020, compared to the May peak, it fell 4 times:
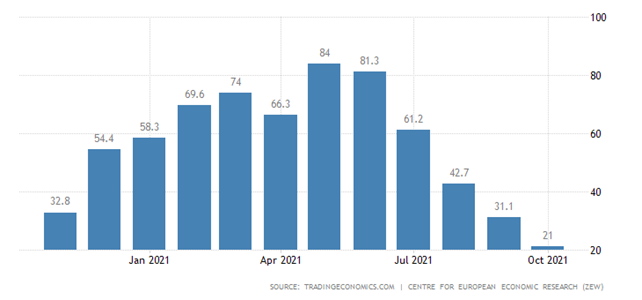
The same picture for the Euro Area as a whole:
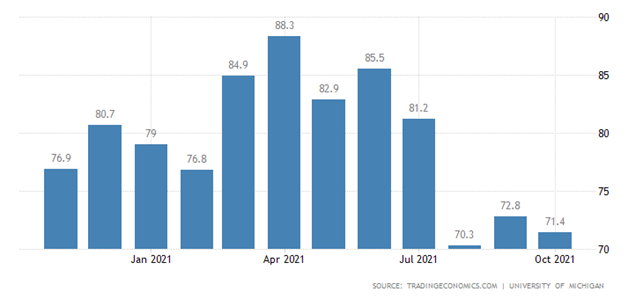
The optimism of small businesses in the United States at half-year trough, the share of wage-raising (but still unable to hire staff) companies is unprecedented in 48 years of observation:
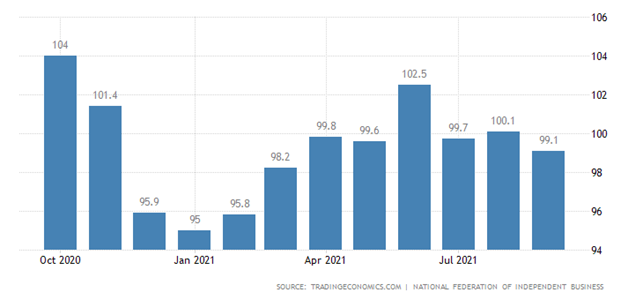
We cannot rule out that it was labor shortages that caused logistical problems in the US. And, as this has been going on for months, GDP could fall for the same reason. It may also be noted that the decline in small business sentiment suggests that GDP growth figures are likely to be highly inflated.
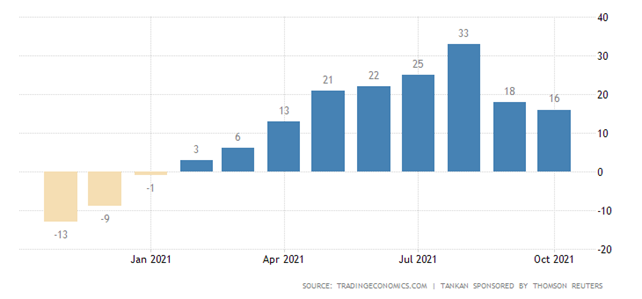
Confidence in Japan’s manufacturing industry is the weakest in six months:
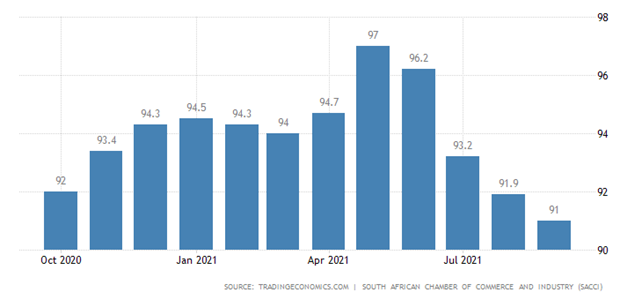
Business confidence in South Africa is the worst in a year:
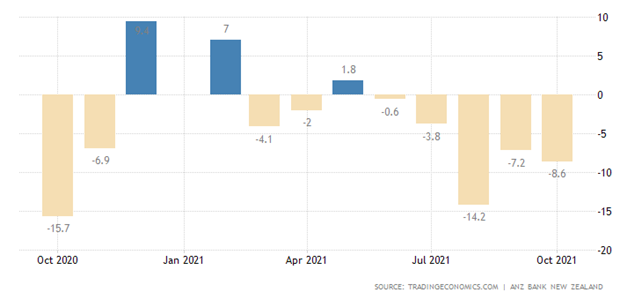
Business confidence in New Zealand has been negative for 5 consecutive months and 7 out of the last 8 months:
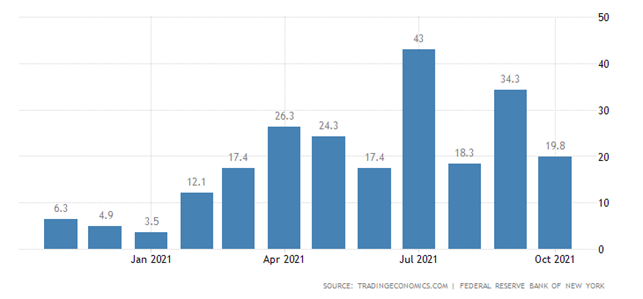
United States NY Empire State Manufacturing Index became slightly weaker:
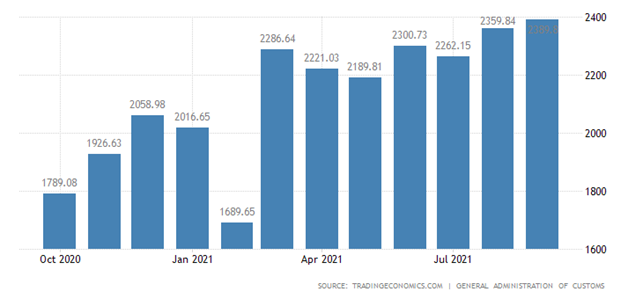
China’s balance of trade is growing against a backdrop of record exports and imports:
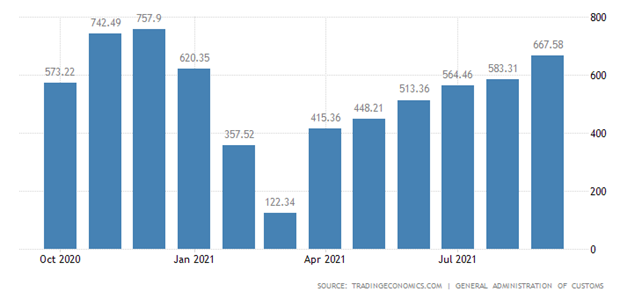
Exports are +28.1% per year, with the fastest rate of export to the US (+30.6% per year), and Europe (+28.6%) is not far behind. While import growth is markedly slower (+17.1%), it is still a record:
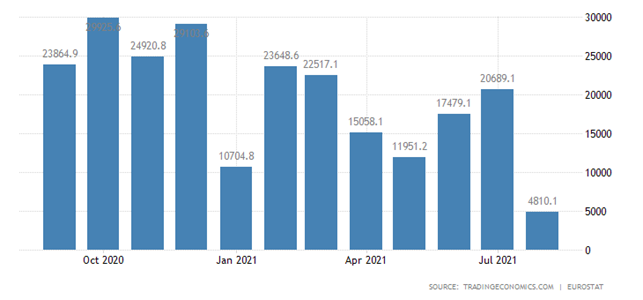
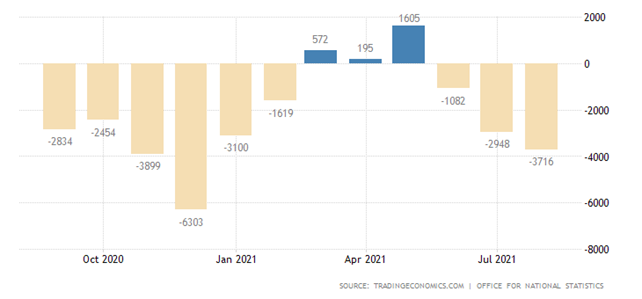
But the Euro Area surplus is the lowest in 1.5 years:
Britain has the worst deficit in 8 months:
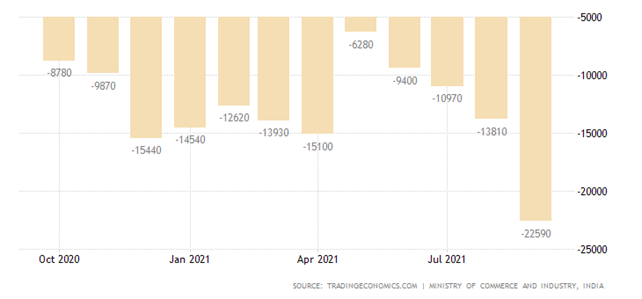
And in India, the deficit has updated the historical maximum:
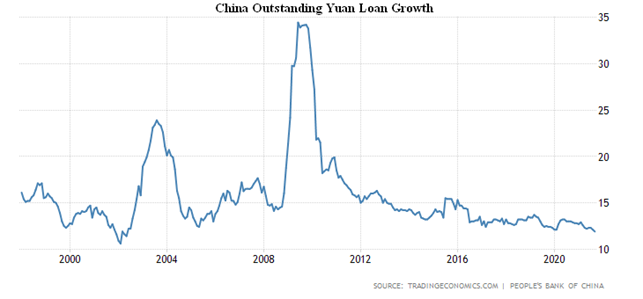
The volume of debt on loans in China +11.9% per year, the lowest since 2002:
Next, we start with inflation data. Once again we remind you that the official figures given below are overwhelmingly much lower than the real figures, which is especially good in the US case (see below).
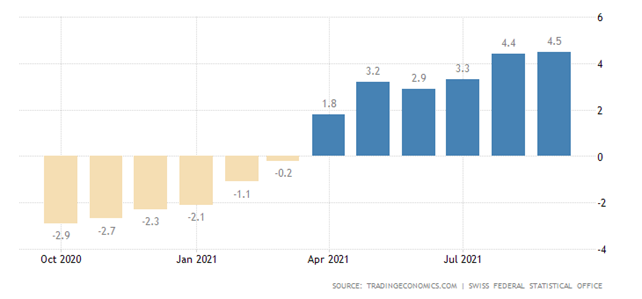
Prices of Swiss producers and importers 4.5% per year, it’s a peak since 2008:
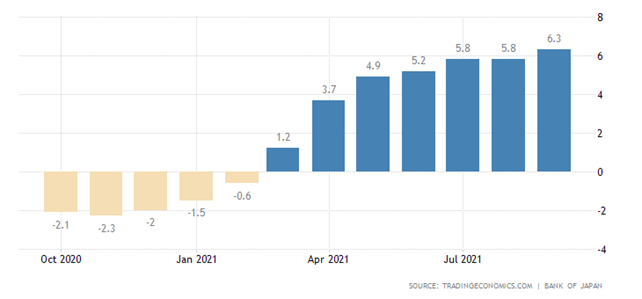
PPI (Producer Price Index) in Japan + 6.3% per year, the highest since 2008:
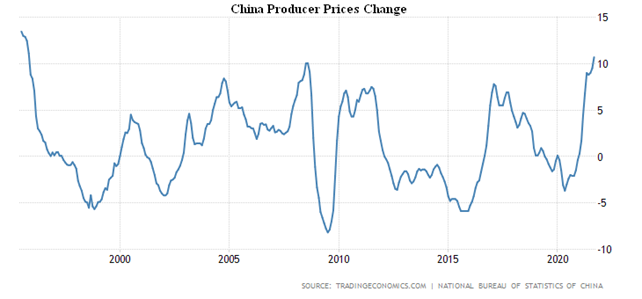
China’s PPI + 10.7% per year, on the top since 1995:
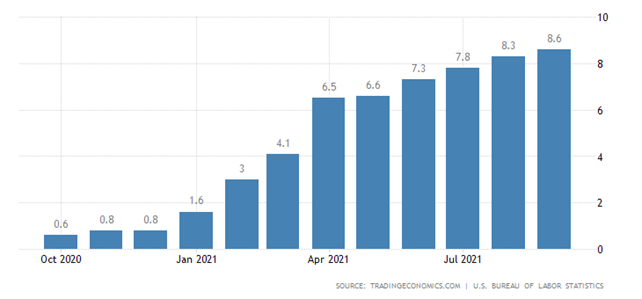
US PPI 8.6% per year, it’s at its highest since 2008:
Goods without food and energy + 5.2% per year, this is the peak since 1982:
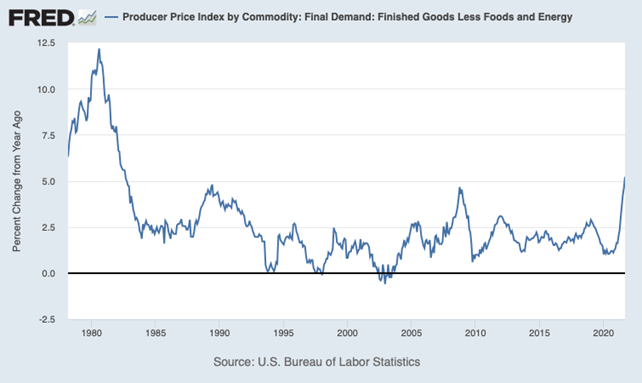
We remind you that the PPI index is defined in the US at final prices in chains. Taking all intermediate prices into account, the situation is even more pessimistic:
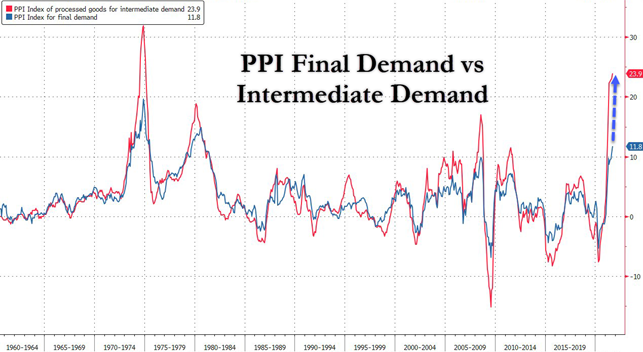
The blue graph is the official PPI index, the red one is the true one. Accordingly, prices move to the level to which the dotted line shows.
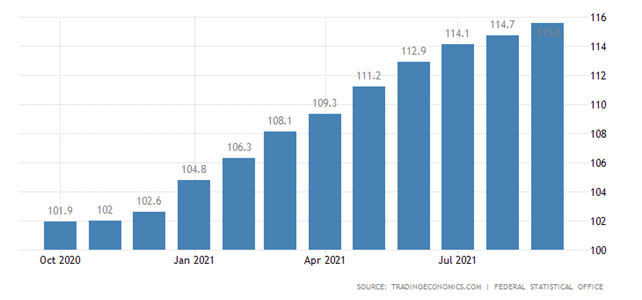
Wholesale prices in Germany + 13.2% per year, which was a record since 1974:
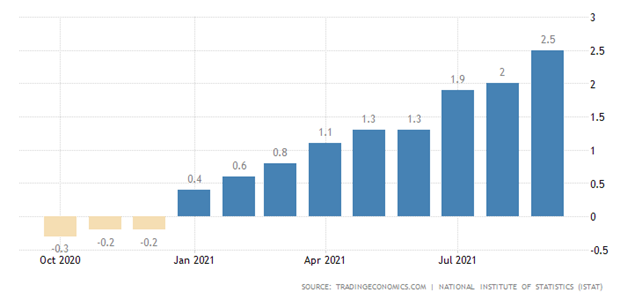
CPI (Consumer Price Index) of Italy + 2.5% per year, this is the peak since 2012:
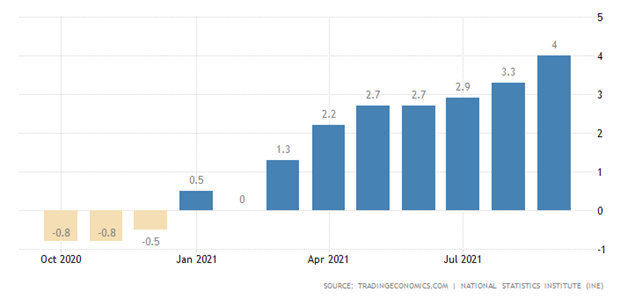
CPI of Spain + 4.0% per year, which is the highest since 2008:
CPI in Germany + 4.1% per year, maximum since 1993:
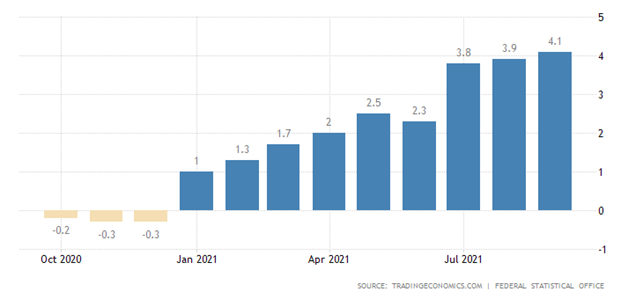
In the current situation, industrial and wholesale prices are higher than retail prices, which means that the latter will pull up to the former. Thus, inflation in the EU, the US, and specifically in Germany, is intensifying.
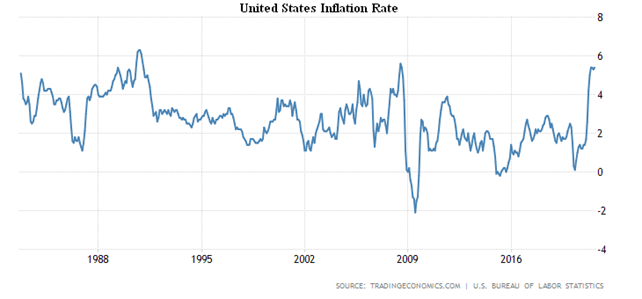
US CPI returned to a 13-year peak of + 5.4% per year:
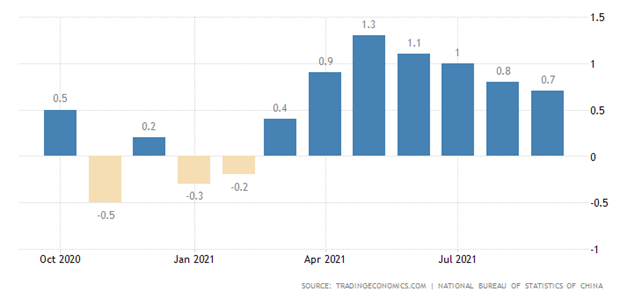
Whereas in China the semi-annual minimum (+ 0.7% per year):
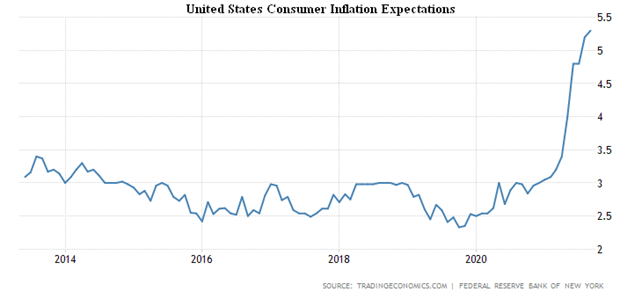
Inflation expectations in the US have renewed the record high (+5.3% per year):
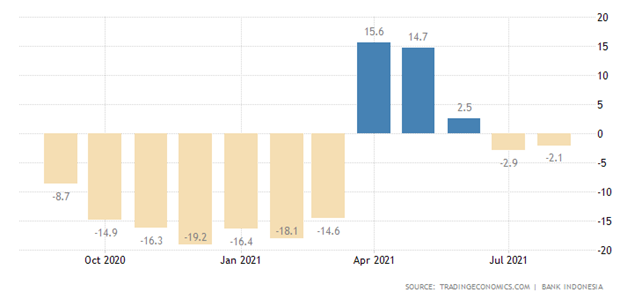
Retail sales in Indonesia remain year-on-year negative (and this when inflation is underestimated):
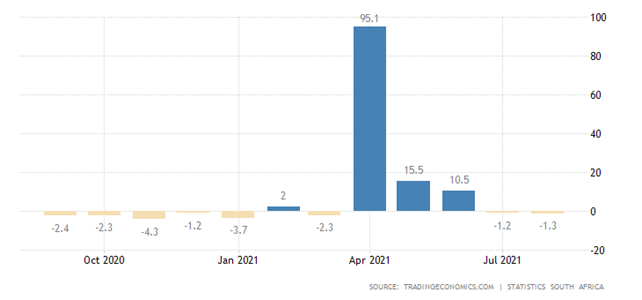
As in South Africa:
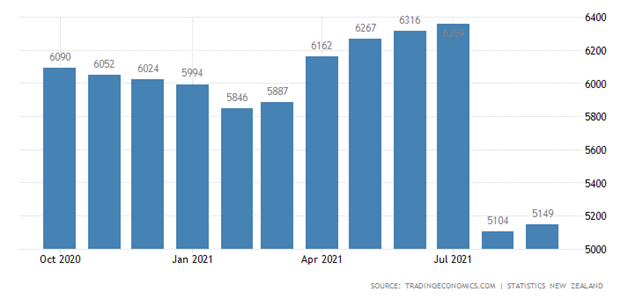
New Zealand credit card charges at 5 years old:
Australians’ consumerism has once again become bleaker:
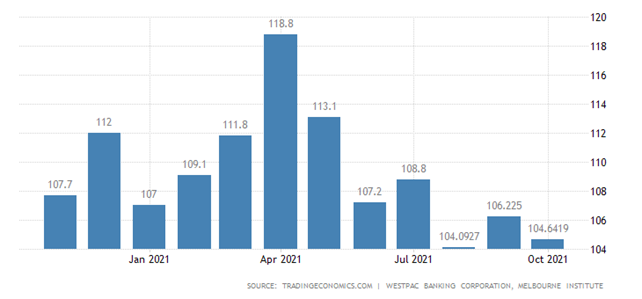
Like Americans, they have almost returned to the 10-year low, and inflationary expectations continue to rise. Here, too, the same observation is made about the mood of small businesses: while the economy is growing, the mood is not worsening, and so (as our inflation estimates show) there seems to be no economic growth in the US.
Job openings in the US have fallen markedly, recruitment is falling, and layoffs are mounting – people are confident that they will find another job on better terms easily:
By the way, the figures for new jobs – 568,000 jobs were created in September, with a forecast of 430,000 – are also quite encouraging. But there is no comparison with this data, as a number of quarantine-related employee support programs are being discontinued in the United States.
The South Korean Central Bank left the rates unchanged after the September hike, but intends to raise them again in November.
The minutes of the last Fed meeting showed that the curtailing of monetary stimulus will begin in mid-November or December.
Summary. Statistics show that logistics has become a major driver of crisis processes. A number of important data characterizing maritime transport are therefore presented:
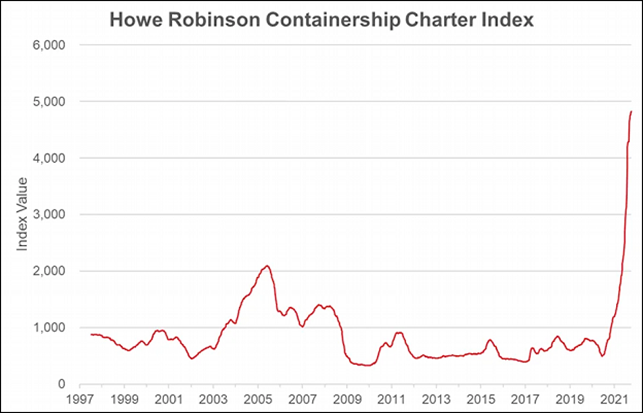
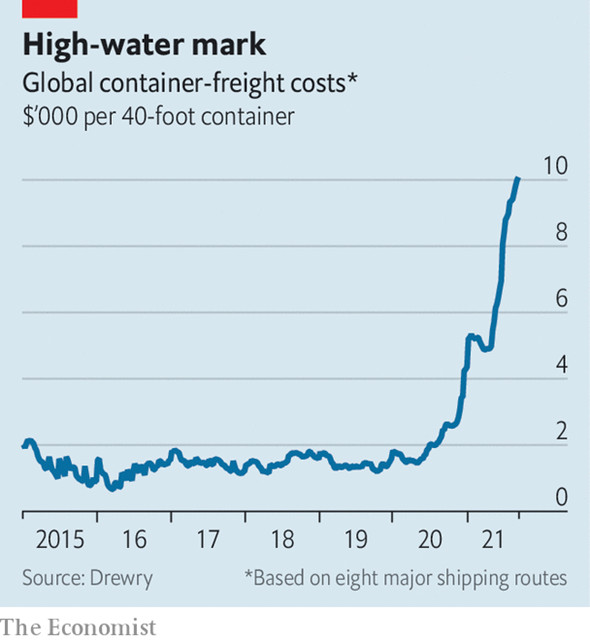
It is important that this is not an abstract index (which is not always defined in an understandable way), but the real price from the large London carrier Howe Robinson – it has increased eight-fold since the average of 2009-2019. Further, the average cost of renting a standard 40 ft container on 8 main routes (CFC_USA) increased 6-8 times compared to the average of the last 10 years.
Commenting on this graph, The Economist writes:
“The average cost of delivering a standard large container (equivalent to 40 feet of equipment – FEU) exceeded $10,000, about four times more than a year ago. The spot price for shipping such a container from Shanghai to New York, which would have been around $2,500 in 2019, now approaches $15,000. Late booking on the busiest route from China to the West Coast of America can cost $20,000.”
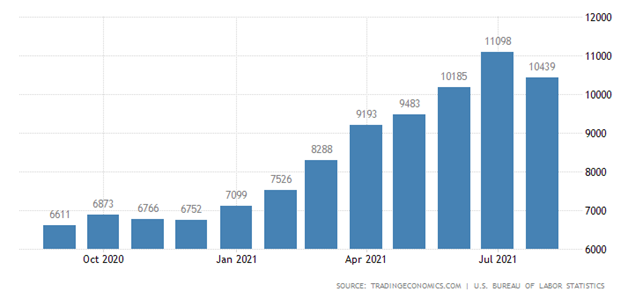
The last graph shows the total volume of container traffic in three main directions (the Far East to Europe and the Americas, as well as within Asia):
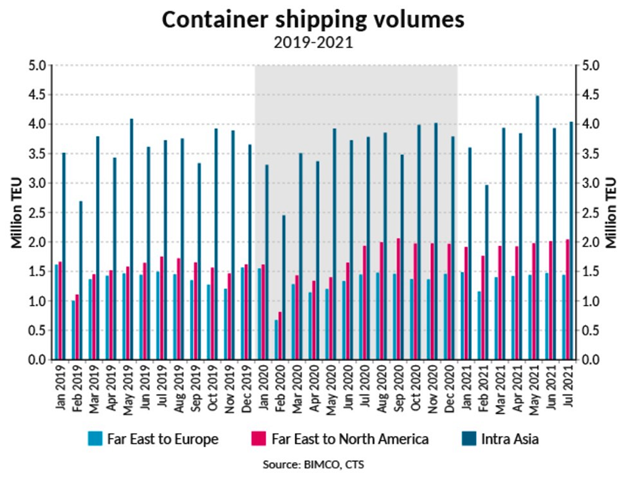
The main point is that there has been no clear increase in traffic, so it is price parameters that are the problem. This problem can be described in very conditional terms within the well-studied problem of traffic jams on the highways: even small difficulties (such as too close approaches of two cars) in critical situations can lead to serious congestion several kilometers away. In our case, quarantine restrictions due to COVID-19 have caused numerous congestions in the transportation system, which has been fine-tuned for many decades. Consequently, transaction costs have risen sharply, with all the attendant problems.
If the economy was going well, one would expect that they would gradually, in a few years, dissipate with falling prices. But today, the situation is more likely to worsen. This can be clearly seen in the case of the British energy industry, where the bankruptcy of small gas suppliers began. It would seem that, with prices rising, they should have fared better, but the lack of financial reserves and long-term contracts for cheap gas have put them at risk. And the restructuring will take a very long time, and the cost will be borne by the consumer.
We wish the readers of our Review a good work week!