
January 28 – February 3 2023
Big news. The main news, of course, is the Fed’s rate hike of 0.25% to the range of 4.50-4.75%. Comments by Fed Chairman Powell:
– To reduce inflation, the economy is likely to grow below the trend and some softening of the situation on the labor market;
– history warns against premature relaxation of policy, we will stick to this course until the job is done;
– the full effect of the rapid tightening of monetary policy is yet to be felt, the slowdown in the rate increase will allow a clearer assessment of the situation;
– the economic index and the average hourly wage have fallen from their highs, but remain quite high;
– We haven’t decided on the final rate yet. We’ll look at data from now through March;
– the final rate, of course, may be higher than we expected in December, but everything will depend on the incoming data. At the meeting in March, estimates of the way to increase the rate will be updated;
– The work has not been completed. It would be worse to come close to beating inflation and then find out six or 12 months later that you haven’t done enough. For the first time we can say that a deflationary process has begun;
– Powell: My and my colleagues’ prediction is that rate cuts this year are inappropriate;
– The Fed will not pause in raising rates.
Powell believes there is a path to a soft landing. Inflation of 2% can be achieved without significant downturns in the economy. And here there are serious questions.
The first is the Fed’s balance sheet:
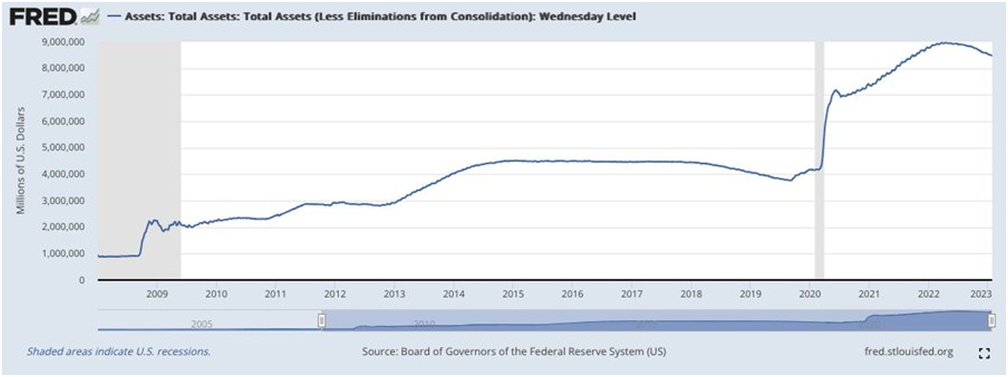
Everything is clear here without explanation: the situation is very far from normalization.
Second, as will be seen in the next section of this Review (and seen in the previous ones), there is a serious crisis going on in the US. Already coming. It is structural in nature and has nothing to do with recession. According to our estimates, the decline in US GDP in 2022 alone was 6-8% (we will try to substantiate this estimate in the last section). And since this decline cannot but manifest itself in the incomes of citizens, politicians must do something (especially in a situation of confrontation between the Republican and Democratic parties).
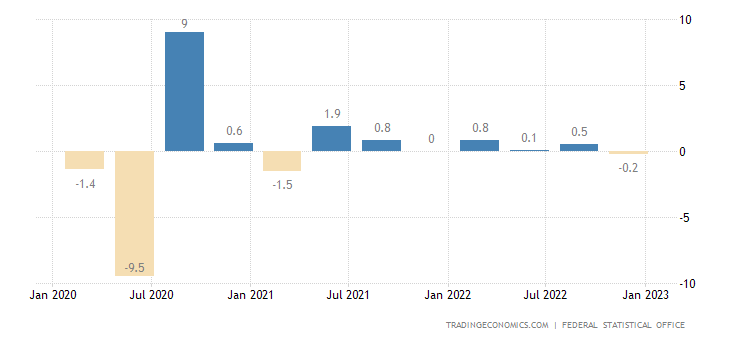
Macroeconomics. German GDP -0.2% qoq – worse than expected (0.0%):
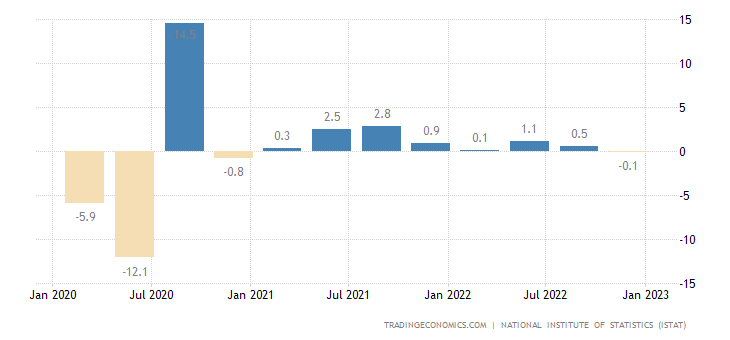
In Italy -0.1% per quarter:
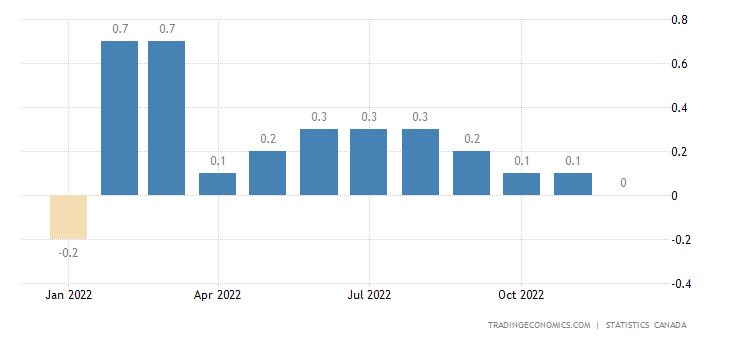
In Canada, monthly GDP growth has been reset:
ndustrial output in Japan -0.1% per month – 3rd minus in the last 4 months:
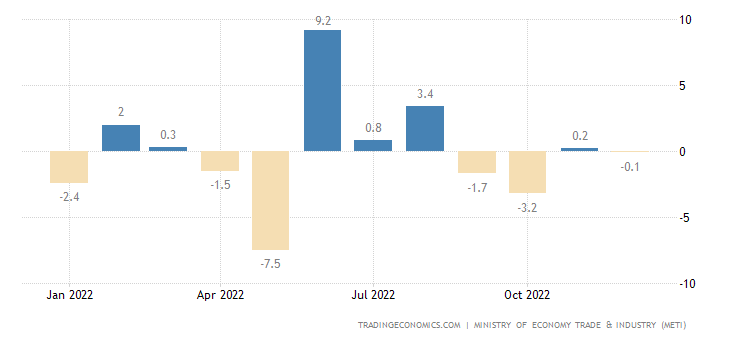
And -2.8% per year — the 2nd negative in a row:
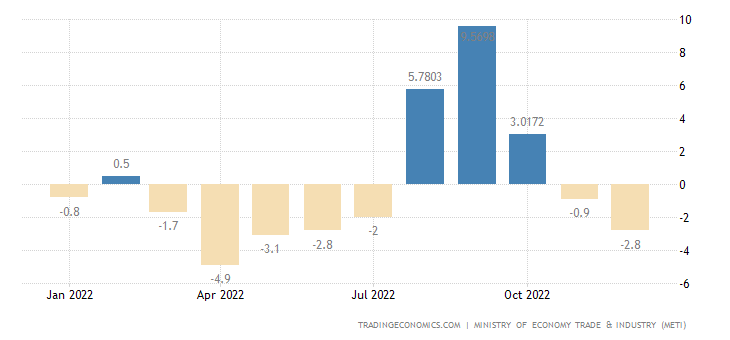
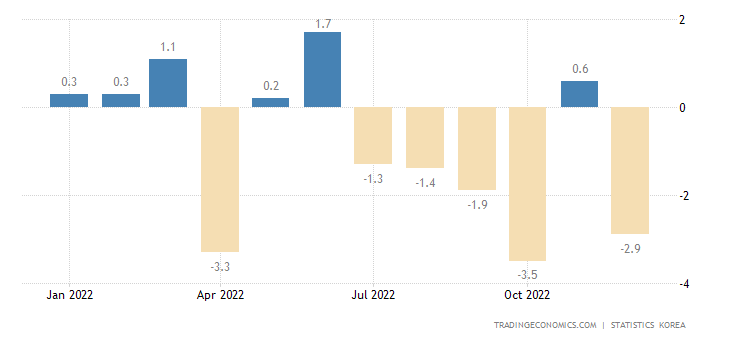
Industrial production in South Korea -2.9% per month – 5th negative in the last 6 months:
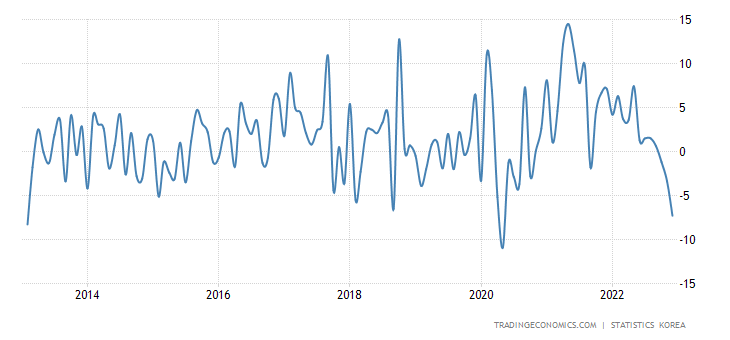
And -7.3% per year – not counting the failure of the spring of 2020, this is the worst dynamics in 10 years:
PMI (expert index of the state of the industry; its value below 50 means stagnation and recession) of the Japanese industry (48.9) 3 consecutive months in the recession zone:
In Brazil (47.5) also 3 months:
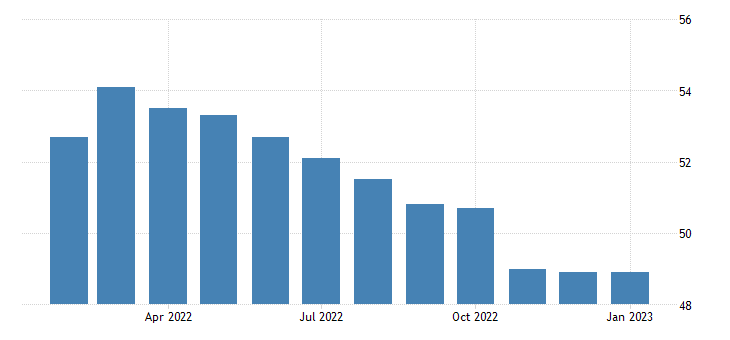
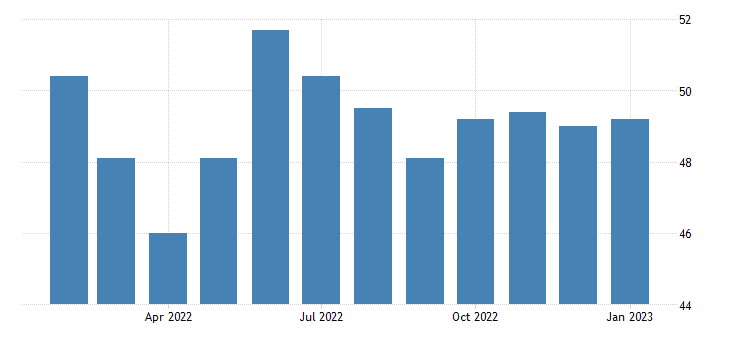
And in the USA too:
Moreover, according to both versions:
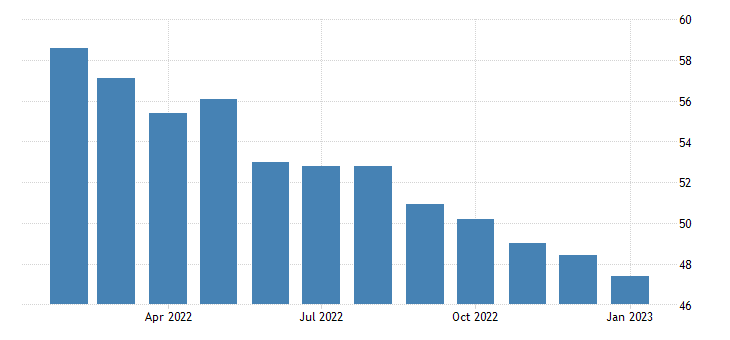
Рис.12
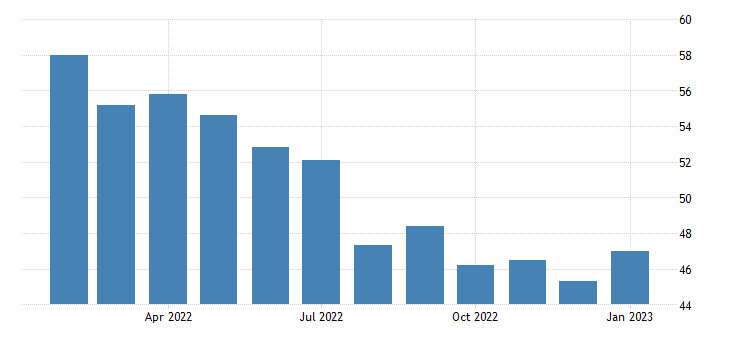
In China (49.2) – 6 consecutive months:
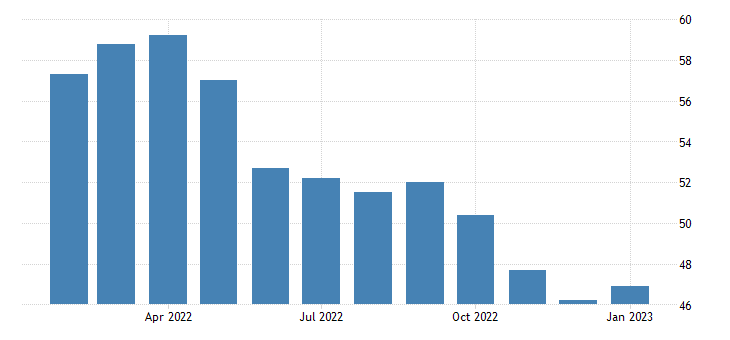
In Britain (47.0) – also 6 months:
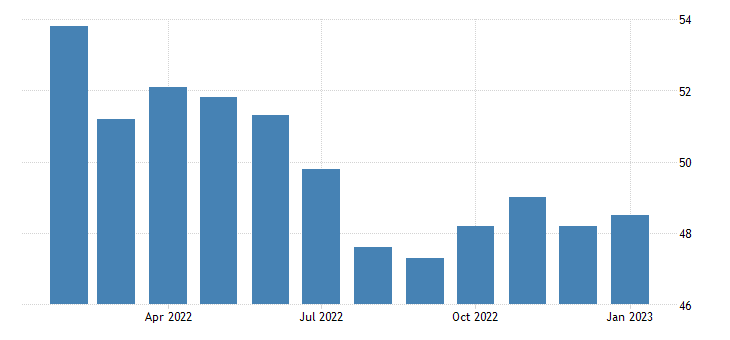
In South Korea (48.5) – 7 months:
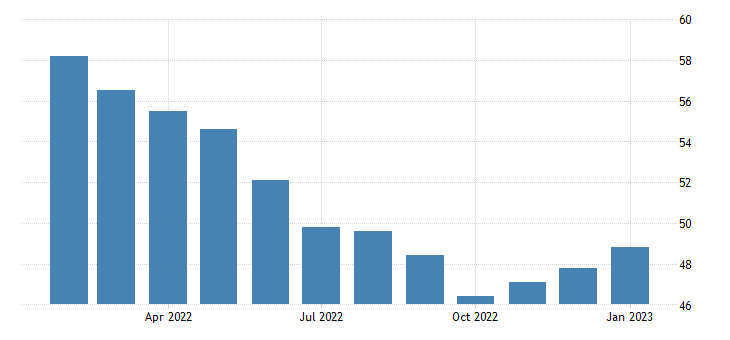
In the euro area (48.8) – also 7 months:
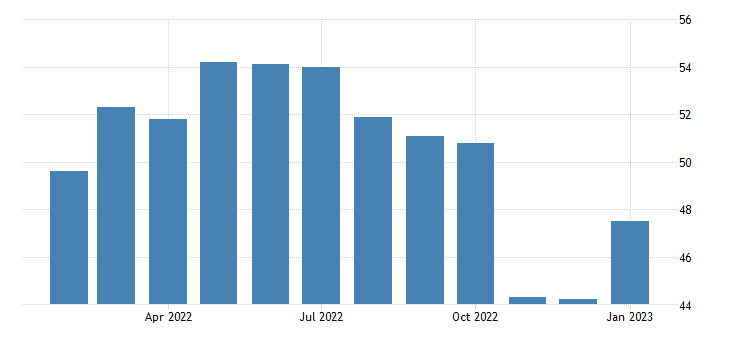
And in Mexico, so far only the first month of the recession:
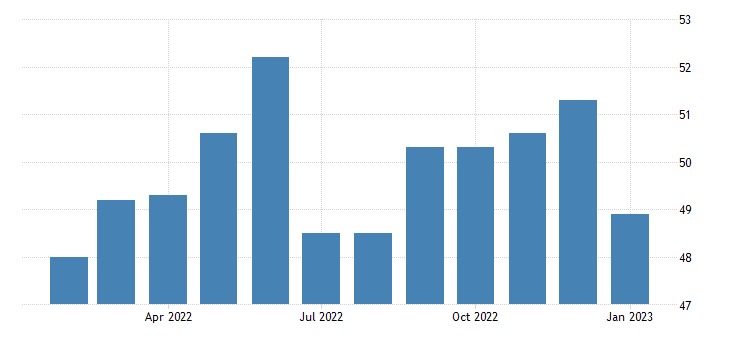
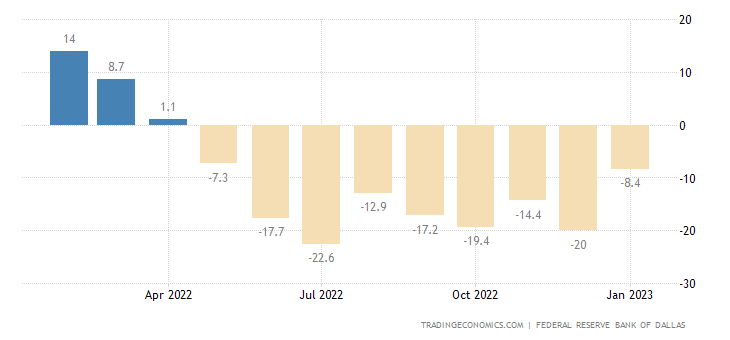
The Texas Fed Zone Manufacturing Index has been in the red for 9 months in a row:
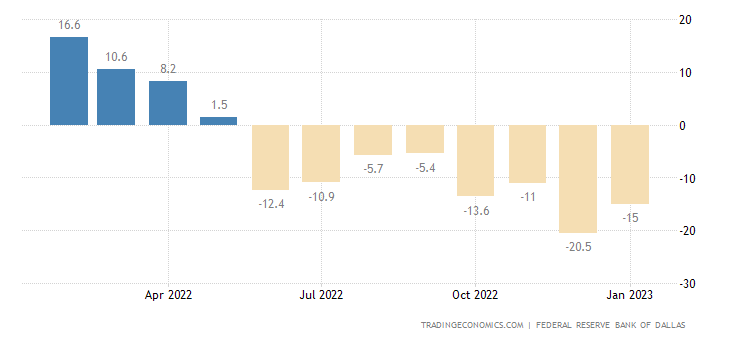
The service sector of the same region has been in the red for 8 months:
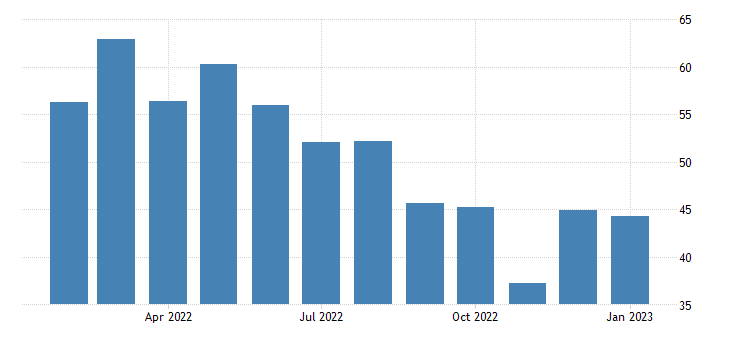
And Chicago PMI is in the recession zone for 5 months in a row:
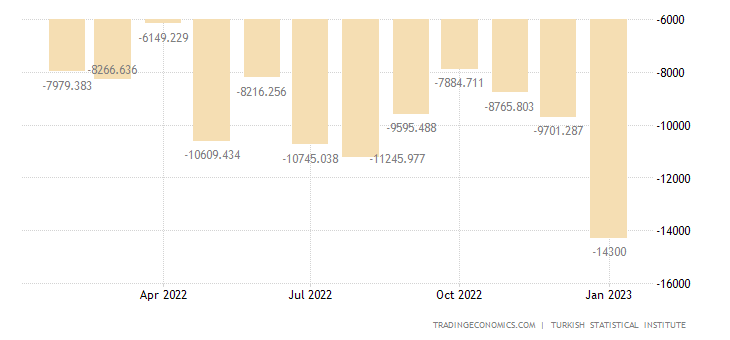
Turkey’s trade deficit hit a record high:
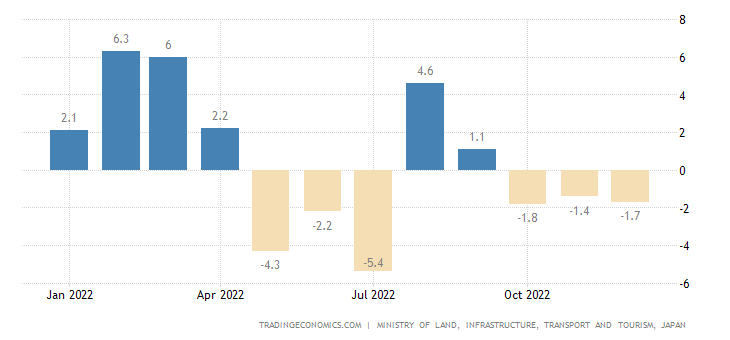
The number of new buildings in Japan -1.7% per year – the 3rd negative in a row:
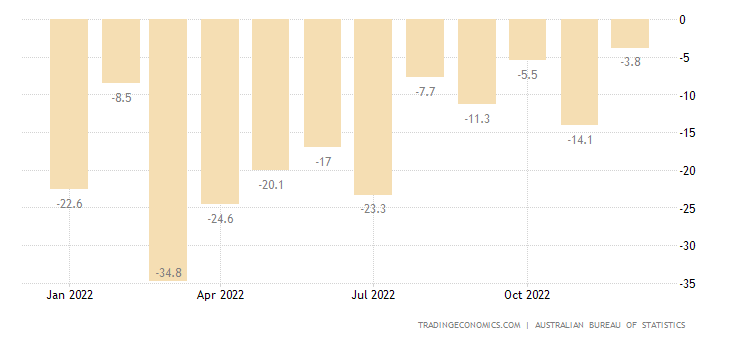
Building permits in Australia -3.8% per year – 15th consecutive negative:
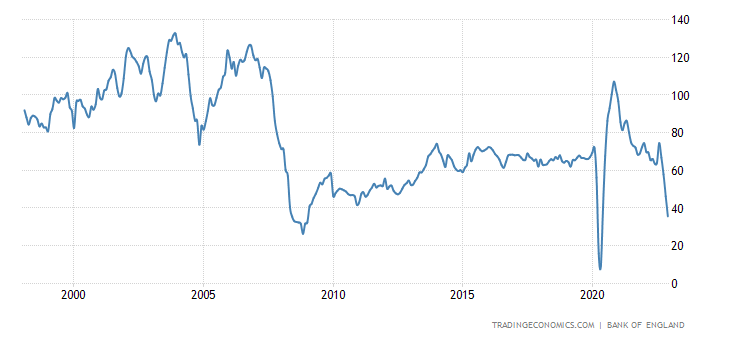
Approved mortgages in Britain are at their lowest since 2020, excluding the covid collapse, they are already near the record low of 2008:
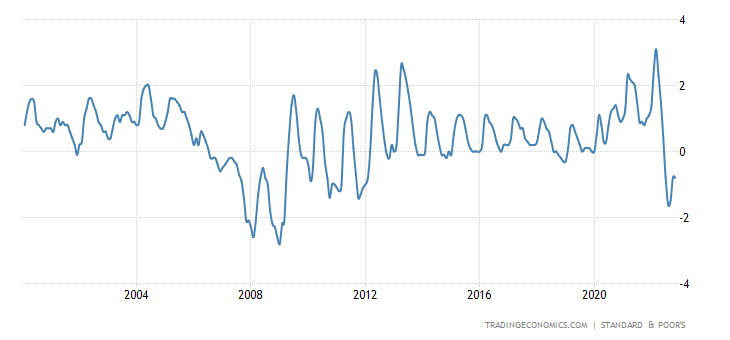
US house prices (S&P/Case-Shiller review) have been falling for 5 months in a row – this was only in 2008/11:
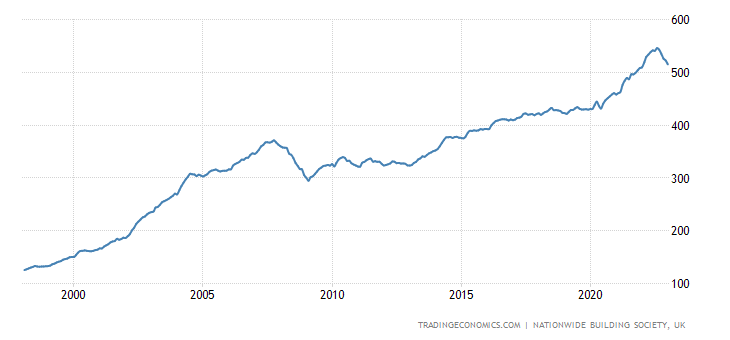
The same in Britain – 5 months of recession, the worst series since 2008:
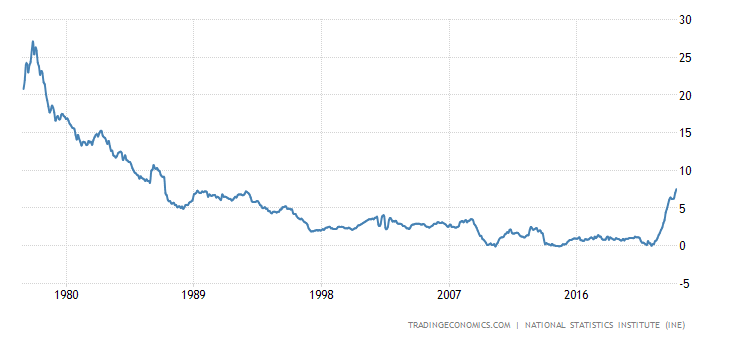
Net CPI (consumer inflation index) of Spain +7.5% per year – the highest since 1986:
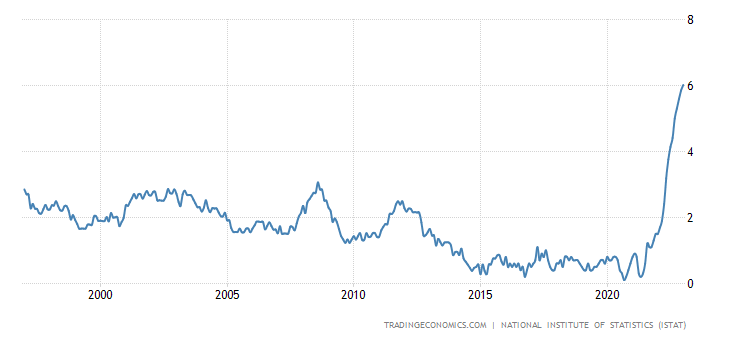
In Italy, +6.0% is a record for 26 years of statistics:
In the eurozone +5.2% per year – a record for 32 years of observation:
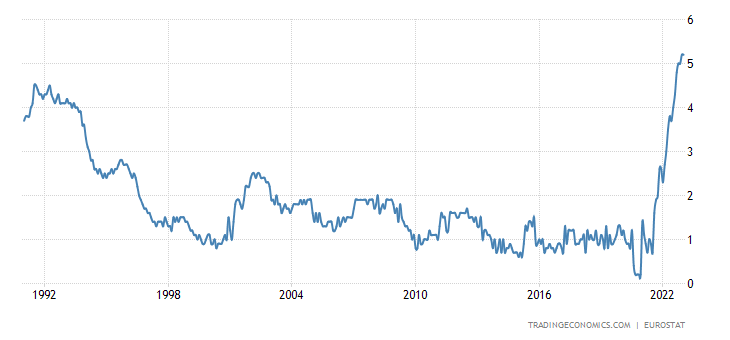
High inflation is back? We’ll check back in a month.
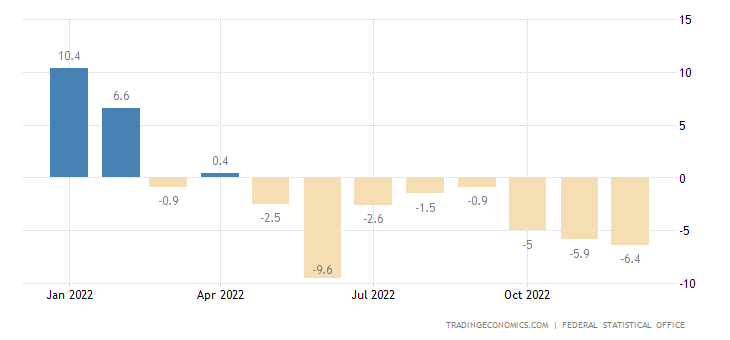
German retail sales -5.3% per month – bottom in 1.5 years and one of the worst performance in history:
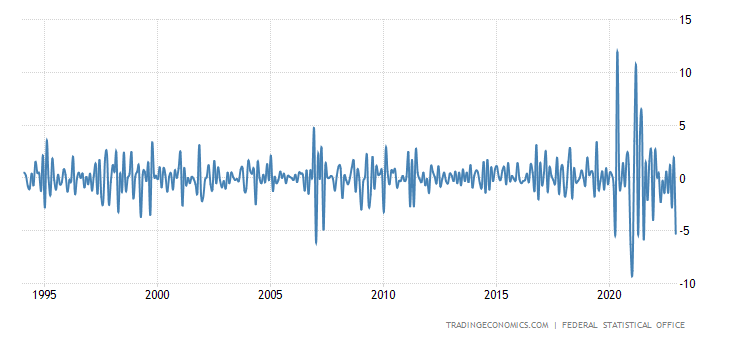
And -6.4% per year — the 8th negative in a row:
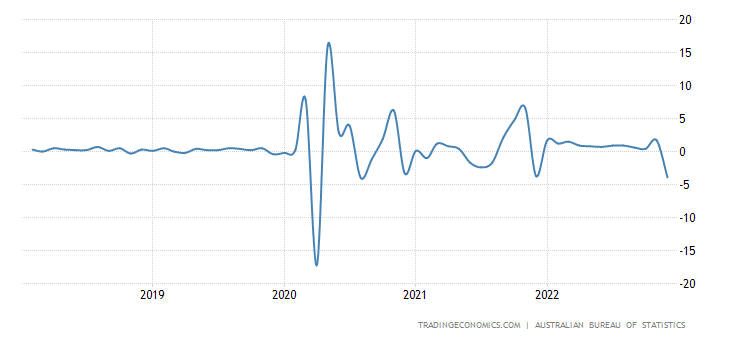
Retail Australia -3.9% per month – the strongest decline since 2020:
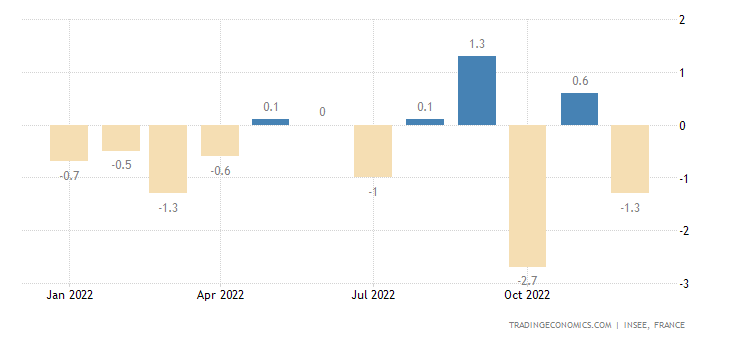
French spending -1.3% per month:
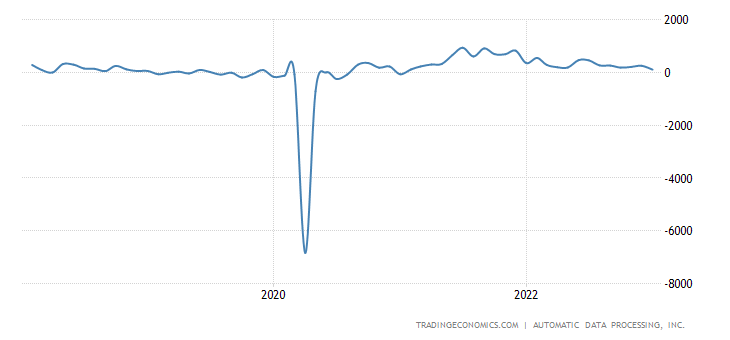
U.S. Private Sector Employment Growth Lowest in 2 Years:
In January, US business planned layoffs of more than 100 thousand people – the worst January since 2009:
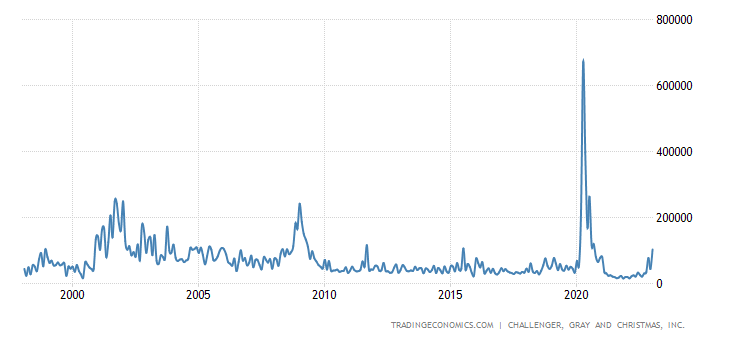
This is private data. The high official level of employment does not mean anything, these statistics are highly distorted, we have repeatedly spoken about this. However, the duration of the working week increased to 34.7 hours from 34.4, which confirms the positive data on employment.
The Bank of England raised the interest rate by 0.5% to 4.0%, further increases are likely – but, apparently, they will be weaker than the previous ones; 2 board members vote for fixed rates.
The ECB raised the rate by 0.5% to 3.0%, promises to do the same in March and still threatens to continue with a “significant” interest rate hike to fight inflation; reduces the purchase of government bonds in the periphery.
The Central Bank of Brazil left rates in place for the 4th time in a row.
Main conclusions. To begin with, the statement of the Bank of England: “We expect a rapid decline in inflation this year. Our job is to make sure inflation returns to our 2% target. We expect a rapid decline in inflation this year. Our job is to make sure inflation returns to our 2% target.”
Note that Powell and the Fed are far from being so optimistic. They are aware that, perhaps, the growth of the rate will have to be stopped. Both main inflation indices, PPI and CPI, are currently more than 6% according to official data, in reality they are seriously underestimated. Many years ago, Sergey Egishyants and I evaluated the contribution of hedonic indices to inflation. In terms of the current situation, it turned out to be about 3%. That is, only due to this parameter it is necessary to increase the inflation figures to 9%, and the US GDP, respectively, to be reduced by 3%.
And there are other indicators (for example, in recent years, only the methodology for calculating GDP has changed at least twice, and each time it increased GDP). In particular, GDP began to include the growth of capitalization of various kinds of financial assets. It is not surprising that the real disposable incomes of households have become increasingly separated from the expenditures necessary for the formation of GDP.
Let’s add Pavel Ryabov’s reasoning about the underestimation of the EU GDP deflator: “It is known that inflation in Europe beats all records, at least for the last 40 years, but does Eurostat transfer this inflation to the calculation of GDP? This is what is worth checking out.
Comparing the consumer spending deflator and the CPI throughout the Eurozone, one can definitely notice a correlation (it cannot be otherwise), from mid-2021 Eurostat really began to translate price increases into the deflator, but it turns out that the conversion of price increases into the deflator is insufficient, if estimated by the CPI.
As of Q3 2022, the CPI increased by 9.3% y/y, and the consumer spending deflator only by 7.4%, i.e., a gap of almost 2% in favor of prices, respectively, real consumer spending is highly likely to be overestimated by 1.8-2.1%.
Is error accumulating in Eurostat’s calculations? The cumulative increase in CPI prices from December 2019 to September 2022 amounted to 12%, and according to the deflator, the price increase was 10%, i.e. this means that the 2% gap does not form every year, but is spread over three years.
If we take the segment from 2017 to 2019, the CPI grew by 4.4%, and the deflator by only 4%. From January 2012 to December 2016, according to the CPI, prices increased by 4.3%, and according to the deflator – 4%. A more significant gap was from January 2009 to 2011, where the CPI is plus 5.5% and the deflator is plus 3.8%.
If we average the period 2009-2019, the CPI is usually higher than the deflator with a discrepancy of about 0.2 percentage points per year, and now it’s just 2% per year, i.e., obviously under-rotated by about 1.7-1.8%, but an import effect is possible.”
Since the methods are, in general, approximately the same, it can be assumed that in the US, the underestimation of the deflator relative to the PPI and CPI also gives about 2%. Since these two understatements operate independently, we can already talk about 5%. And if we add that hedonistic indices are far from exhausting the ways to underestimate inflation, it turns out to be somewhere around 6-7%.
We do not know the exact indicators of various intra-industry indices and parameters; therefore, we cannot give accurate estimates. But the above calculations show the scale of the distortions, and it is safe to say that there are other factors that underestimate inflation. And in any assessment of the economic situation, this must be taken into account.
In other words, it is safe to say that US GDP fell by at least 2% in 2022, and with a high probability that this decline is approaching 6%. Talking about big numbers is still quite difficult.
In the meantime, we wish all readers a wonderful weekend and remind you that the Mikhail Khazin Foundation for Economic Research is organizing a conference in Moscow! On February 25, we will discuss how to live in 2023!
For review readers, the «прорыв2023» promo code gives a 10% discount until February 13!