
Time period: 4 – 10 September 2021
Top news story. Today is the 20th anniversary of the 9/11 attacks. I recall that on September 10, in preparing this Review, I wrote that there was a high probability of planning major terrorist attacks against the US; which could have been blamed for the sharp deterioration of the economic situation by the end of that summer. The following is a graph of the number of companies trading in United States stock markets for which current capitalization is 10 or more times higher than revenue:
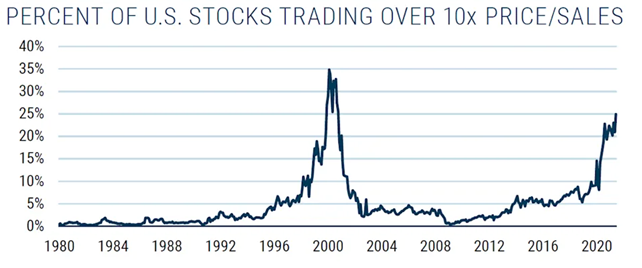
I don’t want to say anything about analogies, but they’re obviously following their lead.
Of course, a single graph says nothing, but in almost every survey we show some indicators that point to the extremely difficult situation in which the world dollar system now finds itself.
At the same time, all the positive official statistics do not correspond to all the statistical information. In fact, officials and institutions give such opinions literally on the basis of two to three indicators, the falsehood of which is conspicuous. And we also write about this in our Reviews. A similar situation persists in the current Review, see the next section.
This situation is extremely dangerous and can in itself provoke serious, unpleasant consequences. But there is nothing we can do about it – the lies have gone on for too long, and as a result, officials may find themselves in the same position as the rating agencies in 2008, when only the lazy one did not accuse them of outright lying.
Macroeconomics
German industrial output 1.0% per month is only the 1st growth in 4 months; from peak to pandemic – 5.5%:
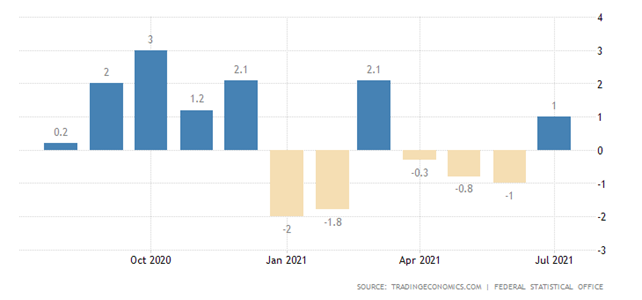
And if we take into account the traditional undervaluation of inflation (output is measured in terms of value rather than quantity, as in the USSR), we may find that there is no growth here.
In South Africa, industrial output -8.0% per month – 4th minus in a row, annual performance returned to negative values:
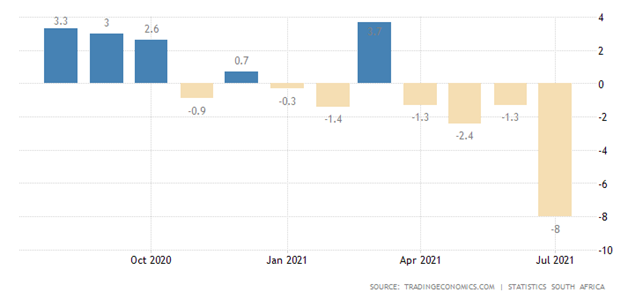
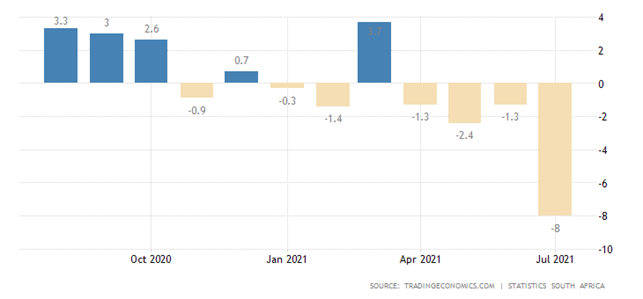
The last picture means that the whole effect of restorative growth has gone to “not at all”. This is actually something that we talked about back in the spring, when this trend was beginning to take shape.
Construction PMI (Purchasing Managers’ Index; its value below 50 means stagnation and recession) of France is confident in the recession zone:
The same situation in Germany:
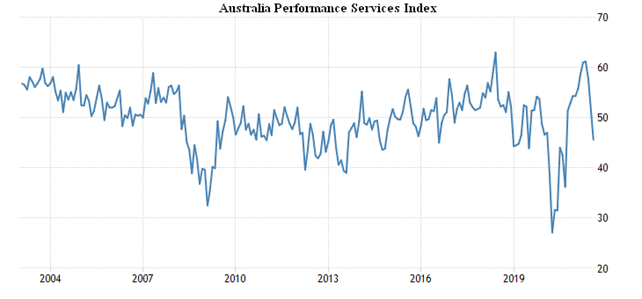
Australia’s PMI service sector is the weakest in a year and clearly in decline:
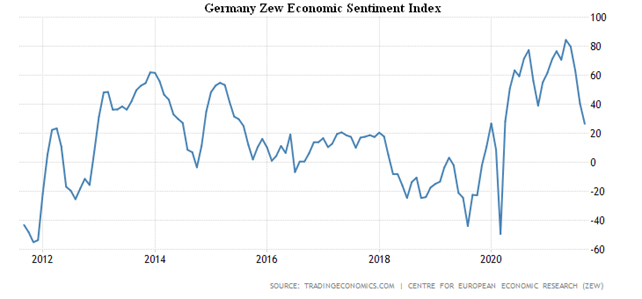
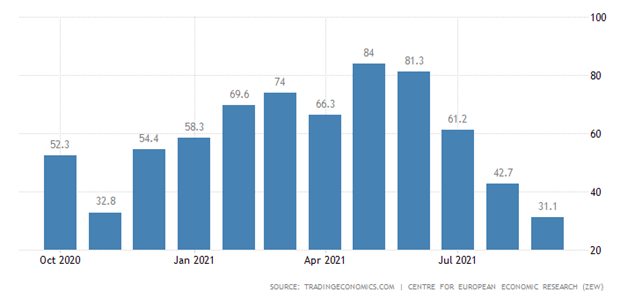
Let us note that talking about a recession is not entirely correct, as it is most likely that the recession is not cyclical, but linked to the economy’s long-term structural problems. ZEW Germany’s Economic Sentiment Index is the worst Since March 2020:
The same picture for the Euro Area as a whole:
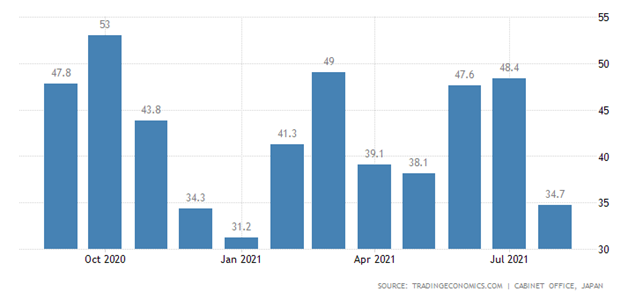
Japan’s Economy Watchers Survey Index is at its trough in 7 months:
IBD / TIPP US economic optimism is weakest in a year:
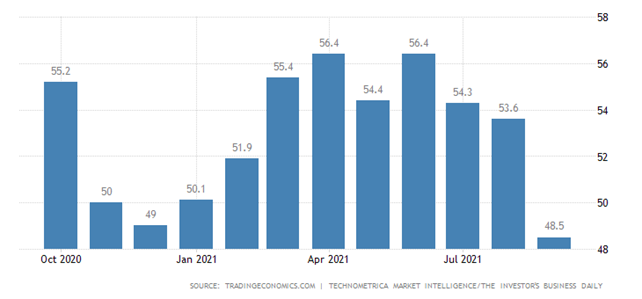
It is interesting to know how official experts in the United States explain such optimism against the background of evidence of a full recovery? I couldn’t find the relevant information.
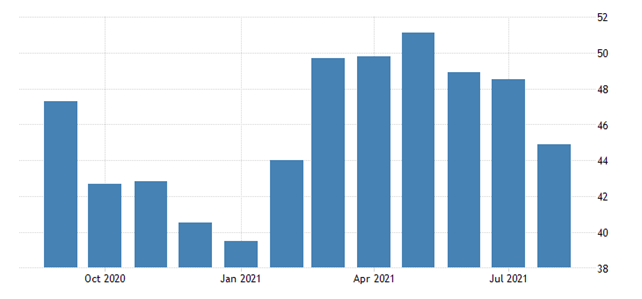
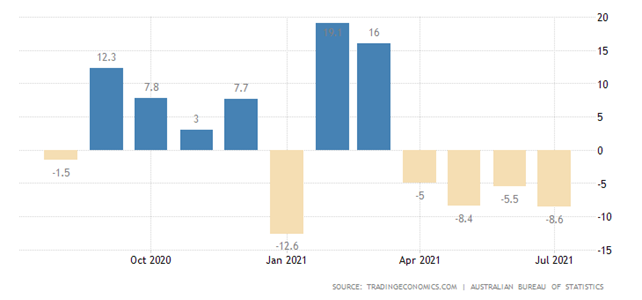
Dwelling Approvals in Australia were -8.6% per month, and -8.6% per month for the fourth consecutive negative time:
Then there’s a lot of data on inflation.
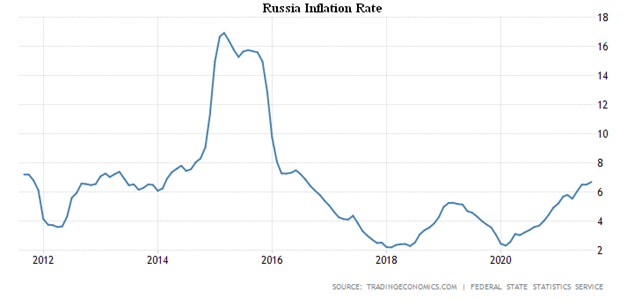
Consumer Price Index (CPI) in Russia is the highest in 5 years (+ 6.7% per year):
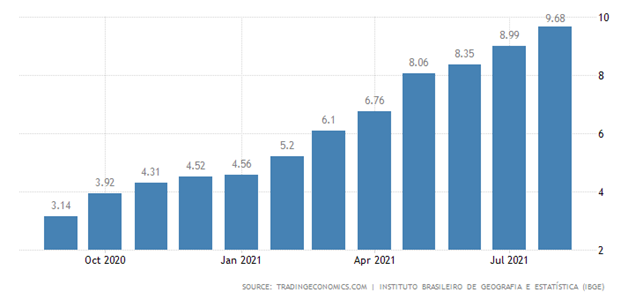
Brazil also has a five-year CPI peak (+9.7% per year):
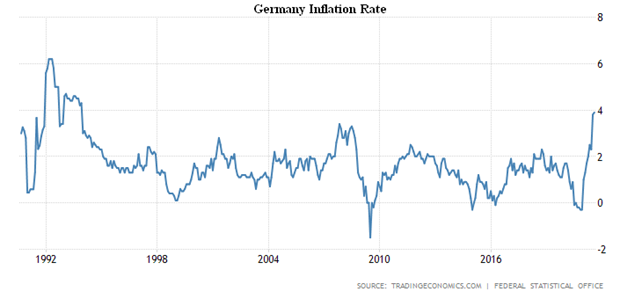
In Germany, the top since 1993 (+3.9% per year):
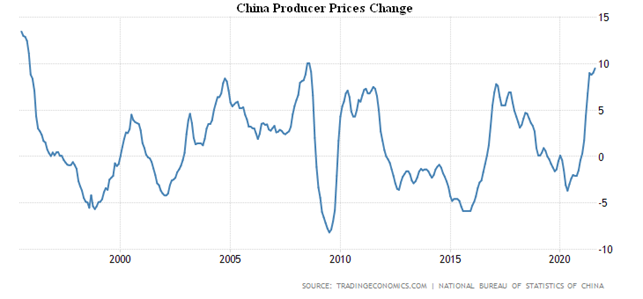
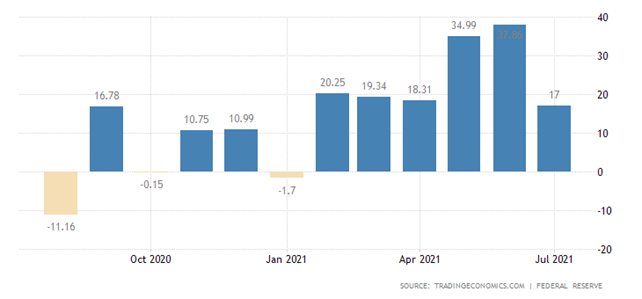
PPI (Producer Price Index) of China +9.5% per year – the highest since August 2008:
Official US PPI + 8.3% p.a. – peak since 2008:
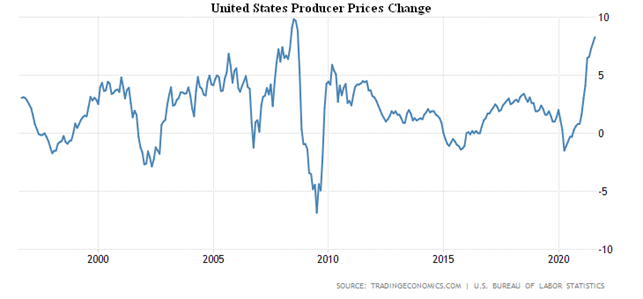
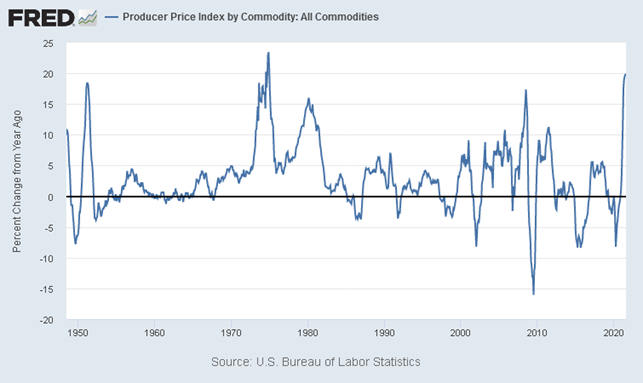
Note that even though emissions have stopped, prices continue to rise even according to official statistics. If the emission program is restarted, the process will, of course, continue. But the real picture in industry is much worse, the rise in prices for all goods (not only final demand) +19.9% per year, which is the peak since the end of 1974:
Without food and fuel +4.6% per year – the highest since 2008 and close to the peak since 1989:
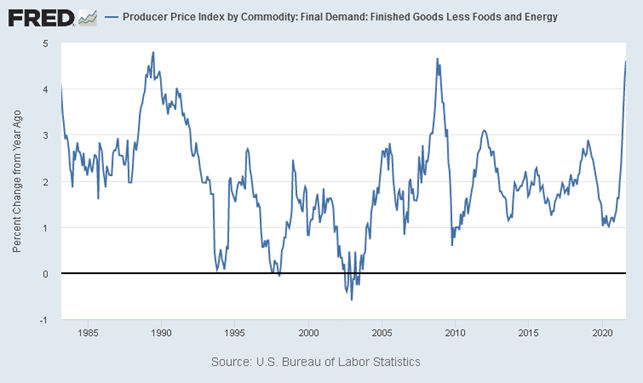
Let us note that these graphs are very well adjusted with the decline of economic optimism in the US.
US consumer credit is the weakest in half a year:
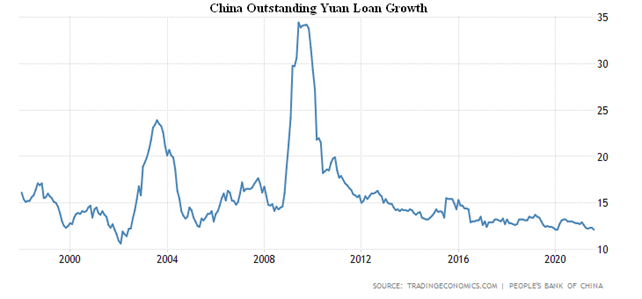
Loan growth in China (+12.1% per year) is the worst since 2002:

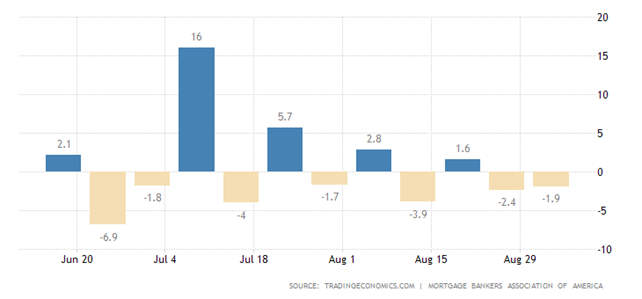
US mortgage applications declined again:
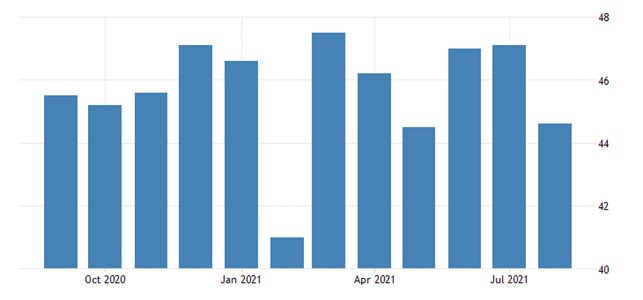
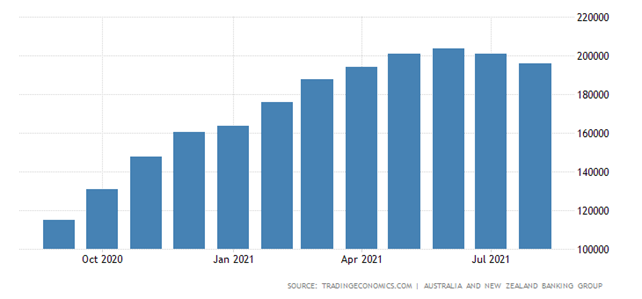
Job advertisements in Australia went down:
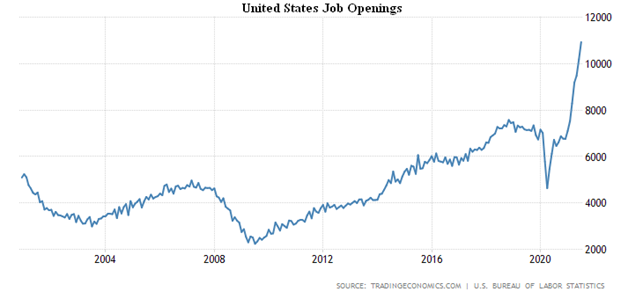
In the US, however, job openings are growing at an unprecedented rate, but people refuse to fill them:
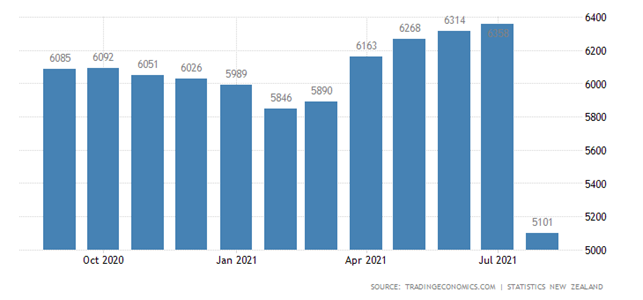
New Zealand credit card charges are -19.8% per month and -11.4% per year due to the new lockdown:
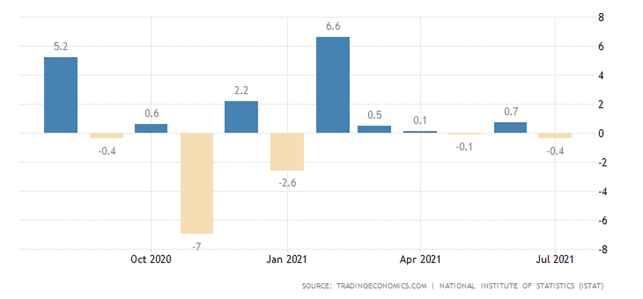
Retail sales in Italy -0.4%, lowest since January:
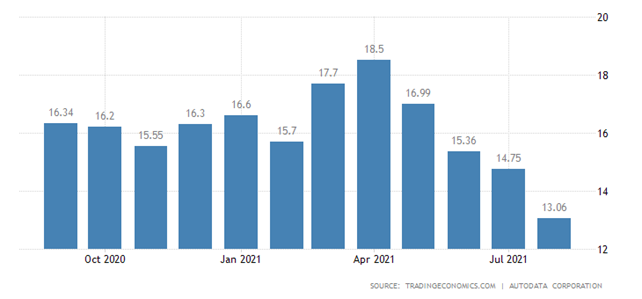
Car sales in China continue to decline:
Even faster, they are shrinking in the United States:
The Central Bank of Canada has left its monetary policy unchanged. The ECB also did not change anything, but promises to start cutting asset purchases in the 4th quarter and raised forecasts for GDP inflation. The Bank of Russia raised the rate again, but now by only 0.25% to 6.75% and intends to raise it further.
Summary. Main conclusion: The secondary indicators that ordinary media readers usually do not look at are becoming more and more in contradiction with those basic indicators that are extremely optimistic. But it is becoming increasingly clear that what is happening in the world economy is completely different from the standard cyclical picture, a typical recession.
From our point of view this is obvious, as the structural crisis that is characteristic of the beginning of the Capital Efficiency Crisis (CEF) is developing actively (see M. Khazin, “Reminiscences about the future”). But to illustrate exactly the structural nature of the crisis, we’ll give you some graphs that are taken from the blog spydell.livejournal.com.
Let us, for example, bring to graphs of total revenues of “old”, traditional sectors of economy (yellow graph) and new, “innovative” (infotech, biotech and financial industry), blue chart:
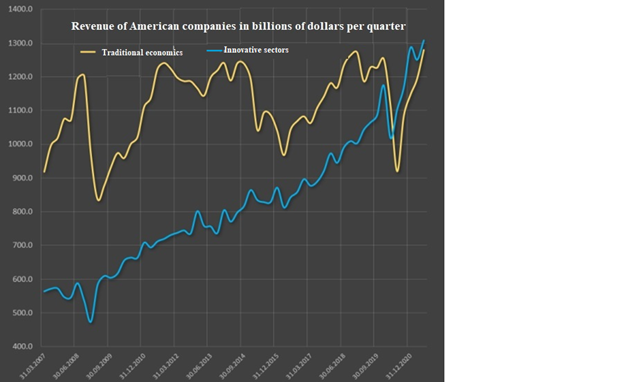
Nothing would seem surprising. The normal process of crowding out obsolete industries with innovation – normal technological progress is taking place. Let’s note that for profit it looks even more convincing:
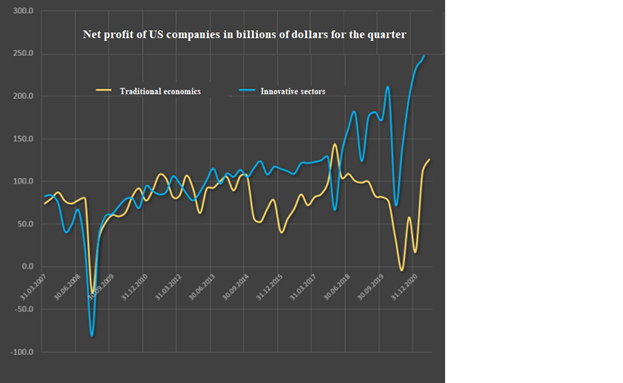
In reality, however, these graphs show that the demand for traditional goods and services is not falling, but is even increasing. But this means that as American citizens’ incomes fall (and they will fall heavily in crisis) these new industries, which are the basis of capitalization of stock markets, will not simply “sag”, but will fall very painfully.
In other words, the fall in the economy will not be evenly spread across all sectors (as was the case during the Great Recession of 1930-32), but very unevenly. The corresponding theory was first described in the book A. Kobyakov and M. Khazin “The Sunset of the Dollar Empire and the End of Pax Americana”, published in 2003, but new graphs show very convincingly the correctness of the corresponding theory.