Time period: May 14-20, 2022
Top news story. The main event of the week most observers will consider the steady decline of financial markets —
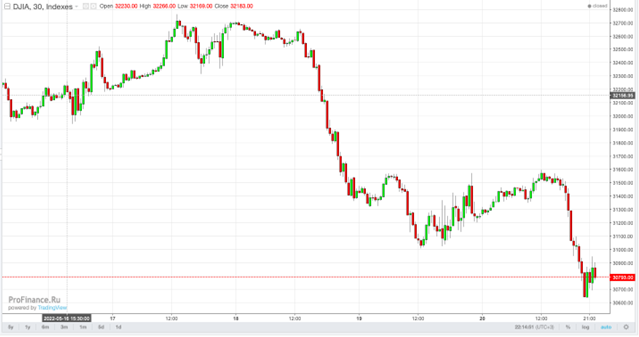
But the key reason for this fall was the announcement by reappointed Fed Chairman Powell, who, for the first time, made it clear that the rate would be hiked as long as inflation was high. Before that, he had hesitated for quite some time and, in general, had difficulty expressing his final opinion.
We have explained repeatedly that inflation expectations are hopeless: monetary tightening does reduce the monetary component of inflation, but increases the structural one. And, as a result, the principle of “adding up the components of force” does not work.
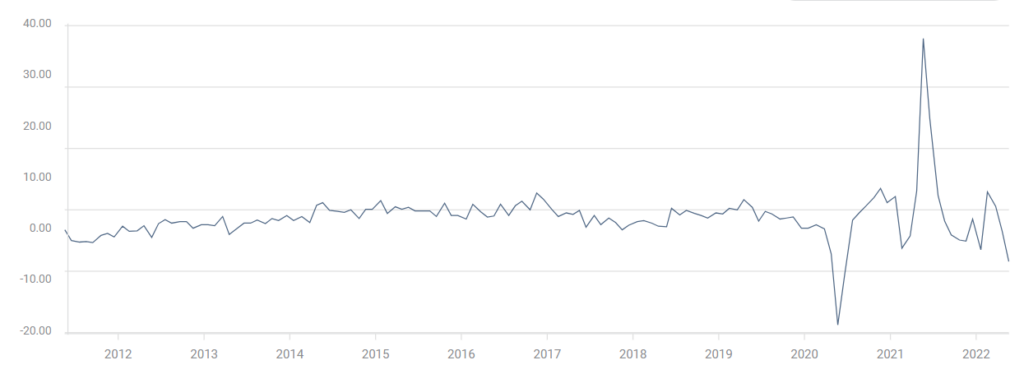
For example, food prices — after the outbreak of the COVID-19 epidemic followed by quarantine, food prices are rising faster than before the pandemic:
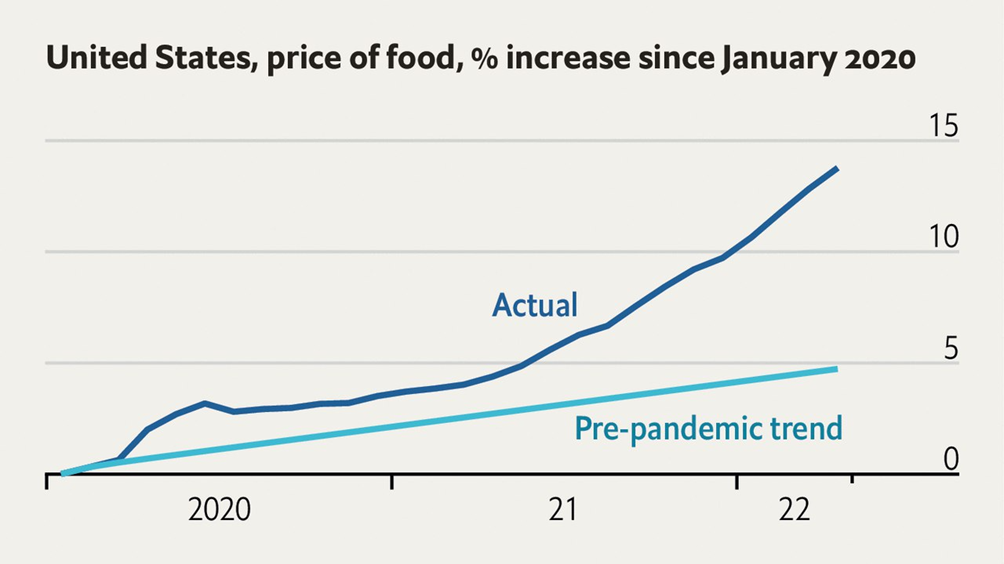
It is possible to assume, of course, that this excess is purely monetary, but at the beginning of 2022 the issue was already limited, while the rate of price growth did not decrease, which indicates a high structural component of inflation, resistant to an increase in the rate.
And the threat of an increase in the rate always has a negative impact on stock indices, and indeed on any speculative assets. And assuming that the Fed really wants to achieve a “neutral” rate (that is, providing at least zero yield on debt instruments), the corresponding amount of its growth will have to be subtracted from the current yield of financial instruments, which, of course, speculators don’t like.
Macroeconomics
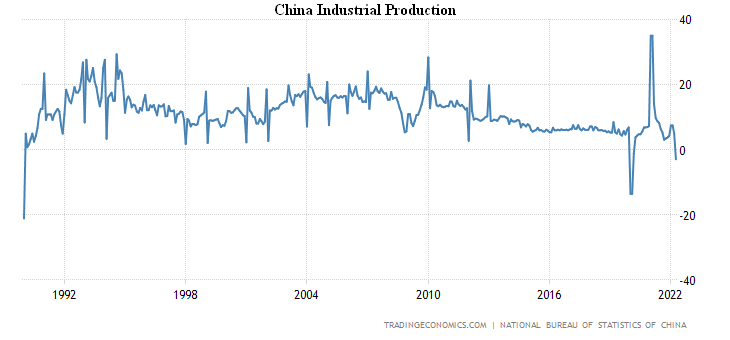
Chinese data for April is very bad, investments are slowing down:

Industrial production -2.8% per year, except for the decline of early 2020, this is the trough since 1990:
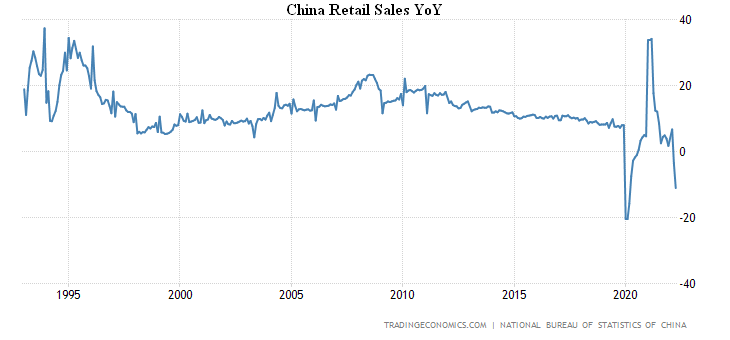
Retail sales went up to -11.1% a year, only worse at the beginning of the COVID-19 pandemic:
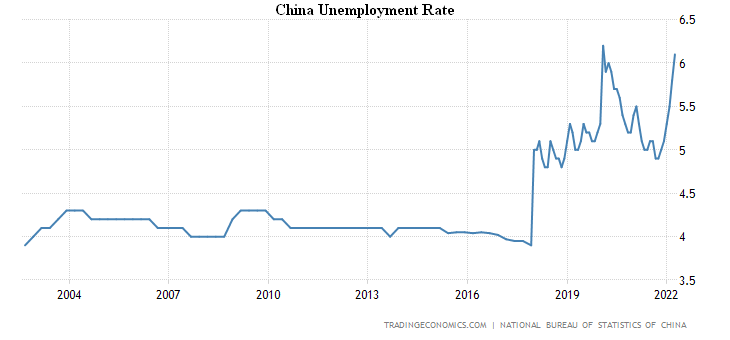
And the same with unemployment (6.1%, near the peak of 2020):
Finally, housing prices in China’s largest cities +0.7% per year, at their lowest since 2015:

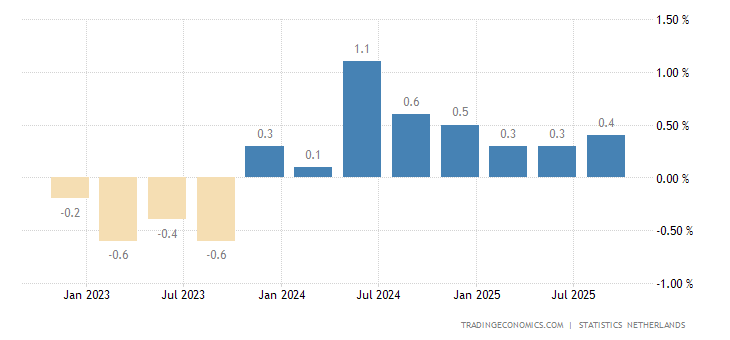
Dutch GDP growth in 1Q came to zero:
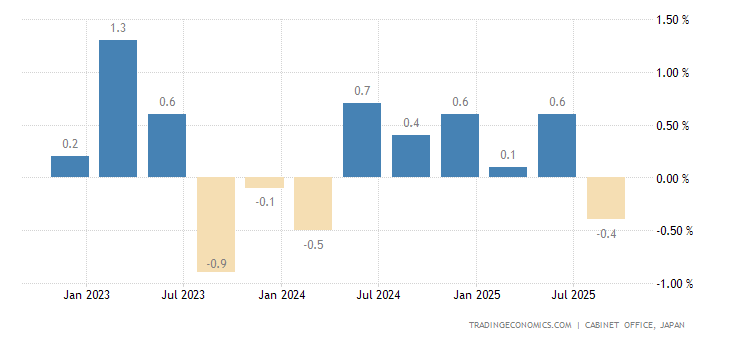
And in Japan it became negative (-0.2% per quarter):
Industrial production in Japan -1.7% per year:

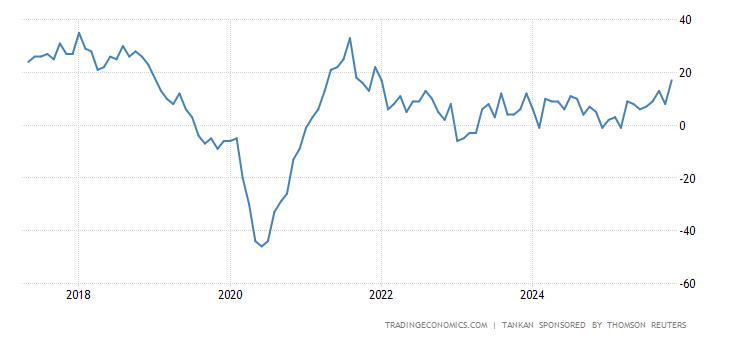
As a result, Japanese producer sentiment is the worst in 15 months:
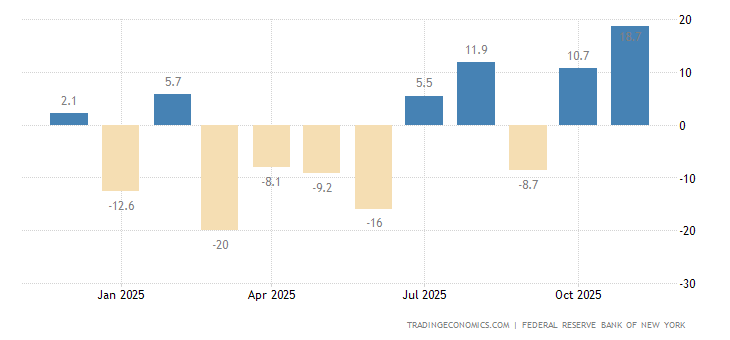
Industry activity in the New York Federal Reserve has collapsed, with key components turning red —
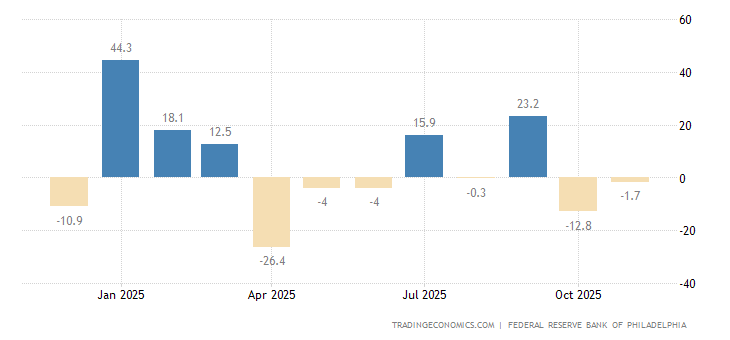
The Philadelphia Fed Index is still in positive territory, but only slightly — it has a two-year low:
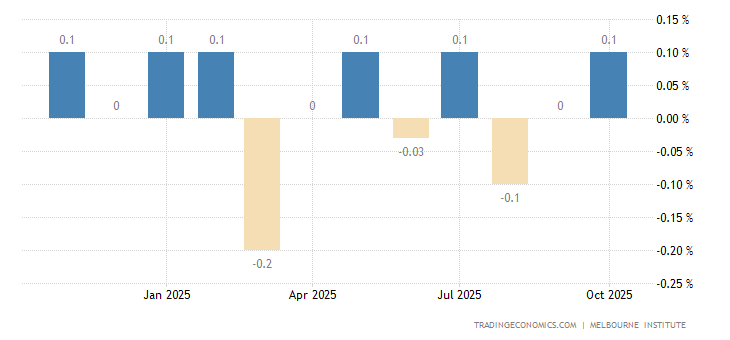
Leading indicators in Australia went down:
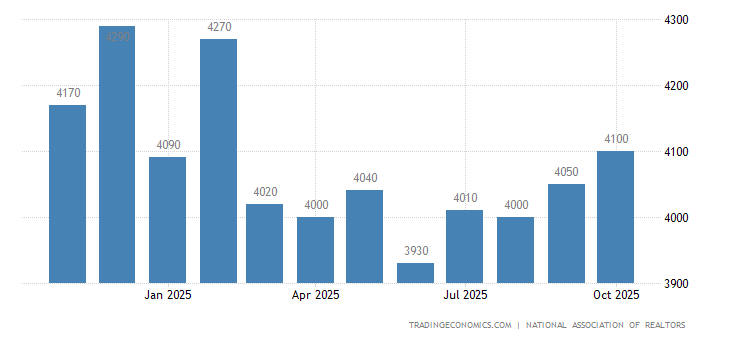
US existing home sales fall for 3 consecutive months and are back to pre-pandemic levels:
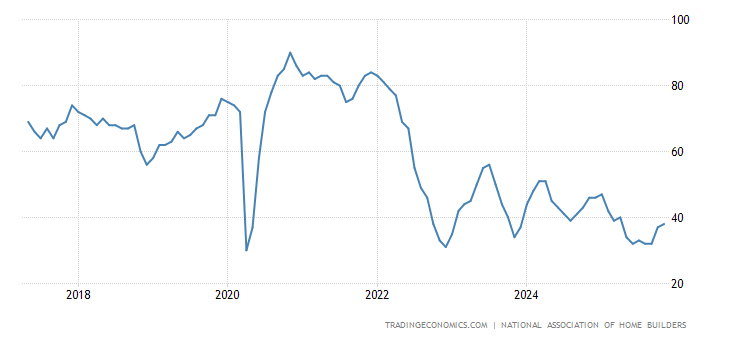
United States Nahb Housing Market Index is the weakest in 2 years:
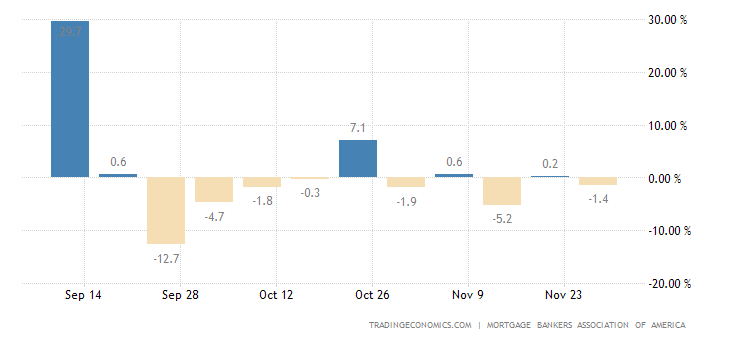
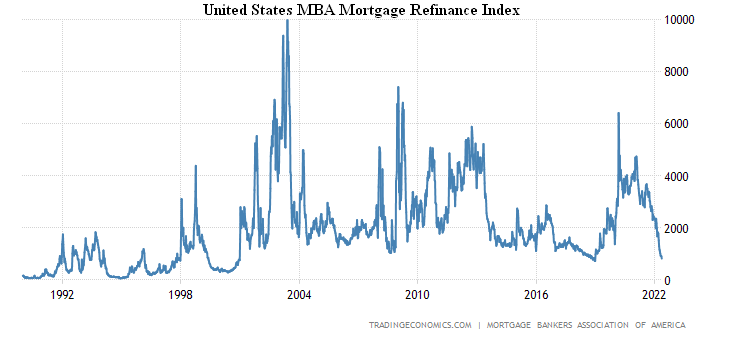
After a two-week pause, mortgage applications in the US slumped by 11% in a week:
Down to the 2018-trough:
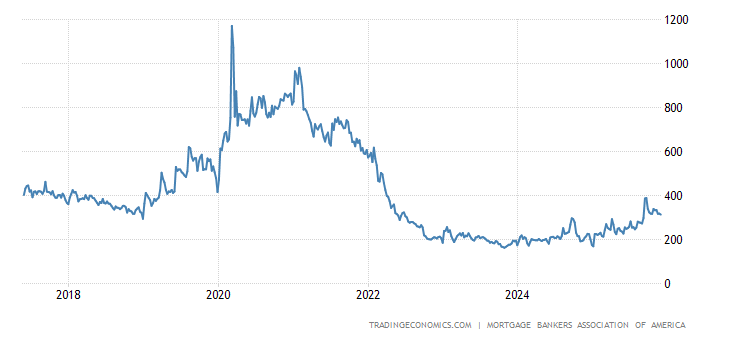
Moreover, refinancing threatens to break through the bottom of 2018 and end up at the levels of 2000:
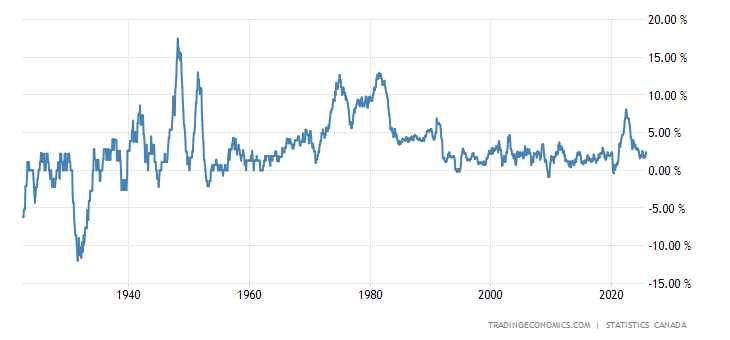
CPI (Consumer Price Index) Canada +6.8% per year, only 0.1% from the highest in 1991:
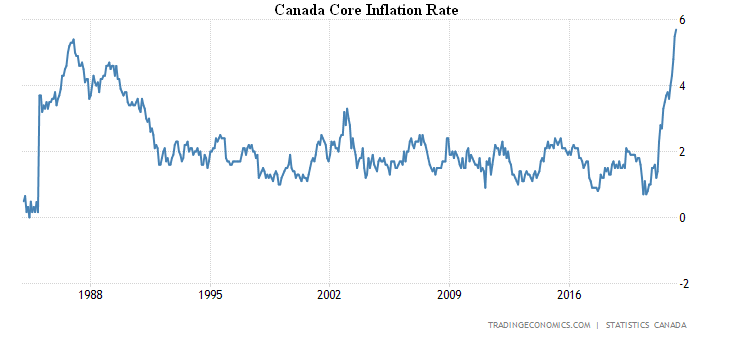
Less food and energy, inflation hit a record for 38 years of data acceptance (+5.7% per year):
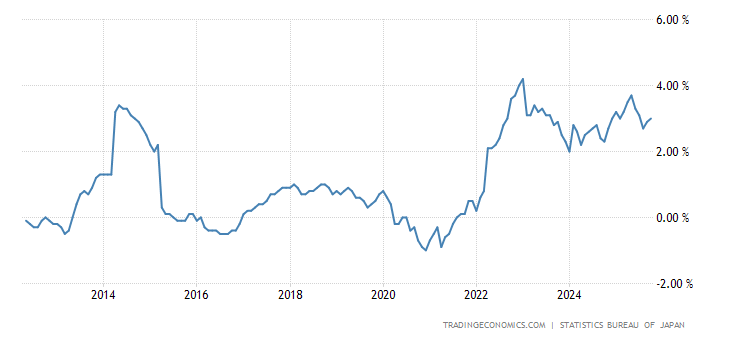
Japan CPI +2.5% per year, the highest since 2014:

The same excluding fresh food (+2.1%):
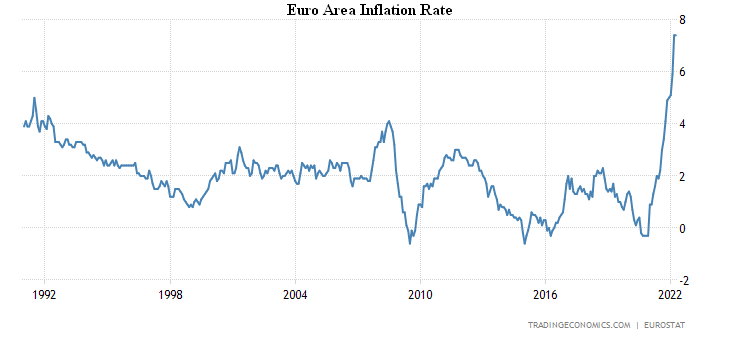
The Euro Area CPI 7.4% per year, that is the 31-year record for statistics:
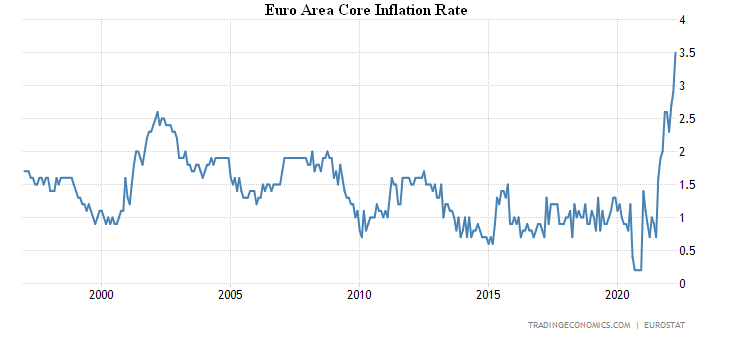
The core inflation rate rose to a record +3.5% per year:
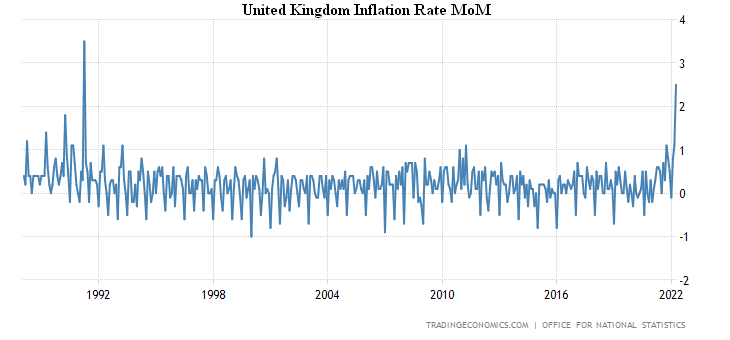
CPI Britain 3.5% per month, peaked since 1991:
And +9.0% per year, this is a record:
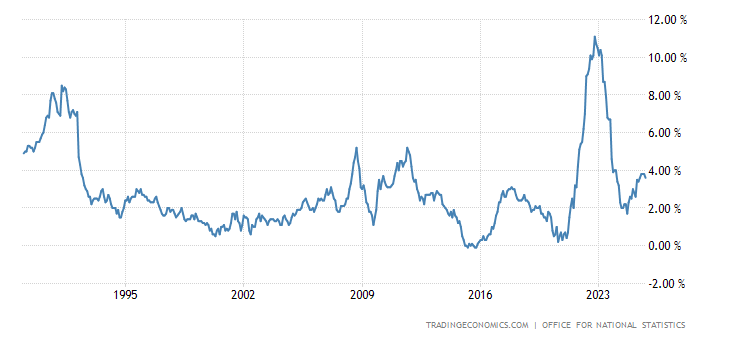
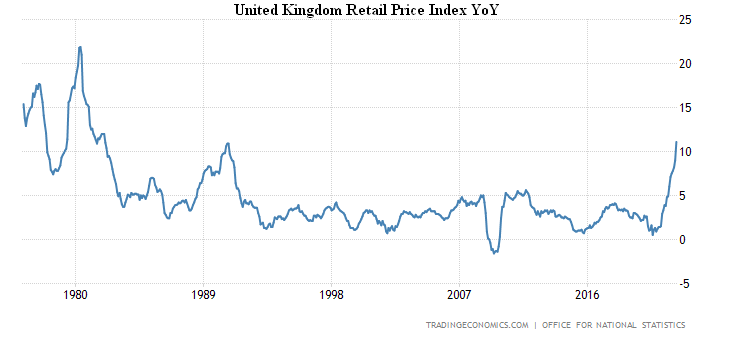
The retail price index is more adequate, +3.4% per month and +11.1% per year, that is a 40-year high:
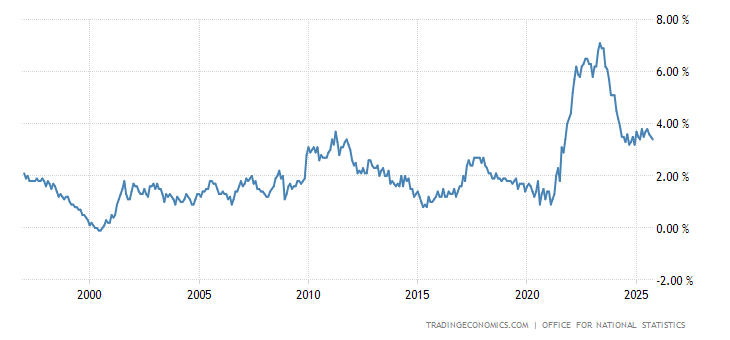
Core inflation (excluding highly volatile components, energy and food) is the highest recorded for a quarter-century of survey:
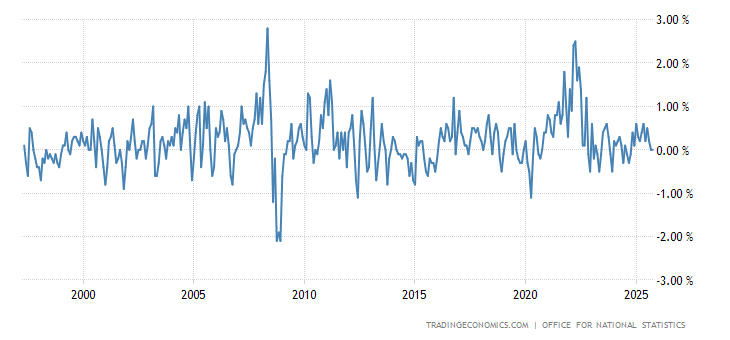
UK PPI (Producer Price Index) is +2.3% per month and +14.0% per year, both peaking since 2008:
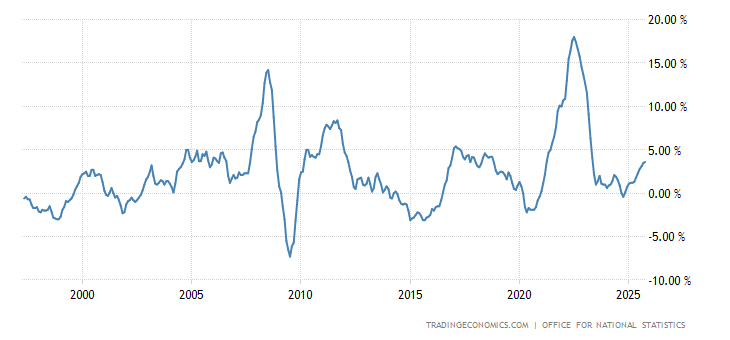
Less food, drinks, tobacco and energy +13.0% per year, that’s a record for 25 years of data acceptance:

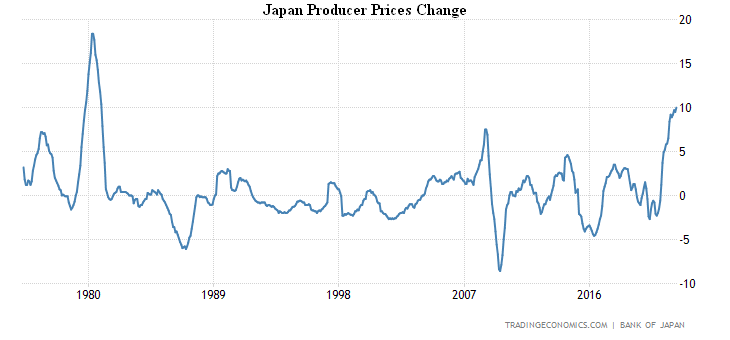
Japan PPI +10.0% per annum, the most since 1981:
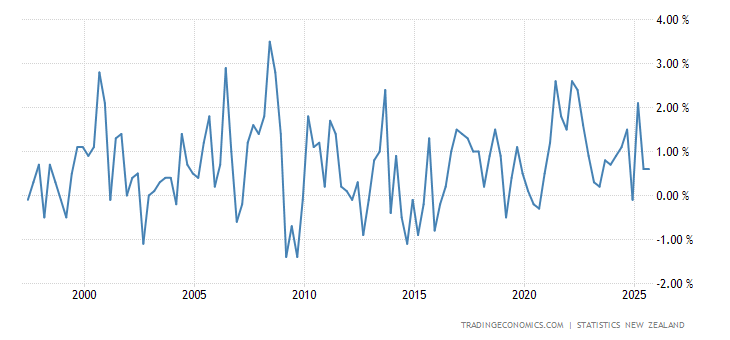
New Zealand Producer Input Prices +3.6% QoQ, the highest since 2008:
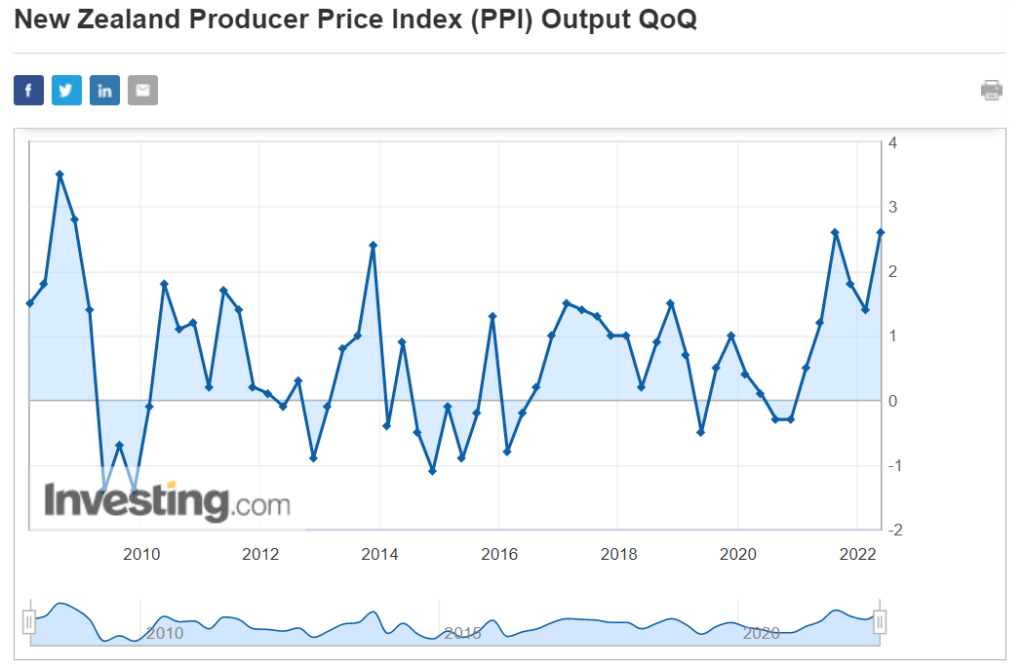
The same is true for PPI output (+2.6%) —
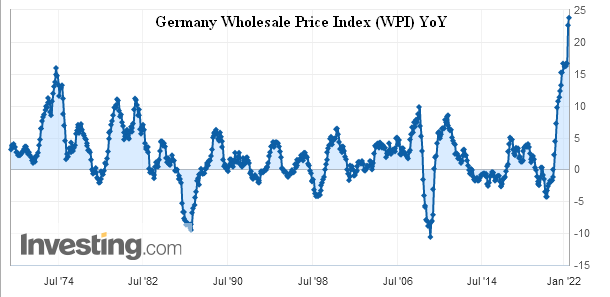
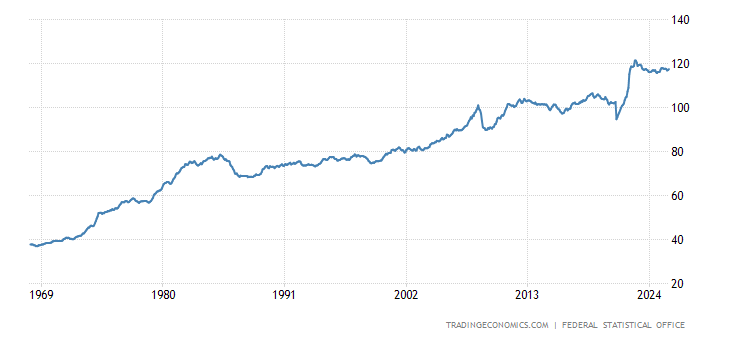
Wholesale prices in Germany +23.8% per year, it’s another record for 54 years of survey:
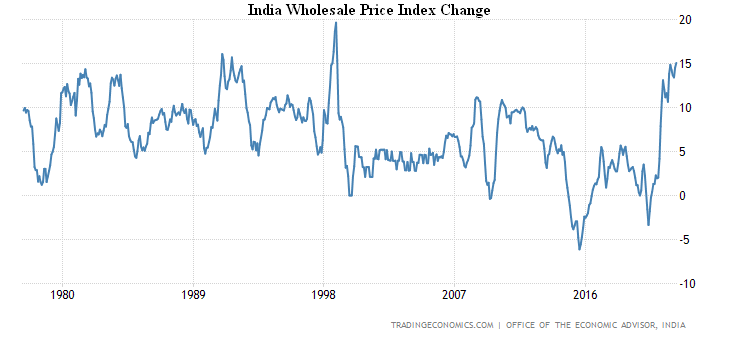
Wholesale prices of India 15.1% per year are the highest since 1998:
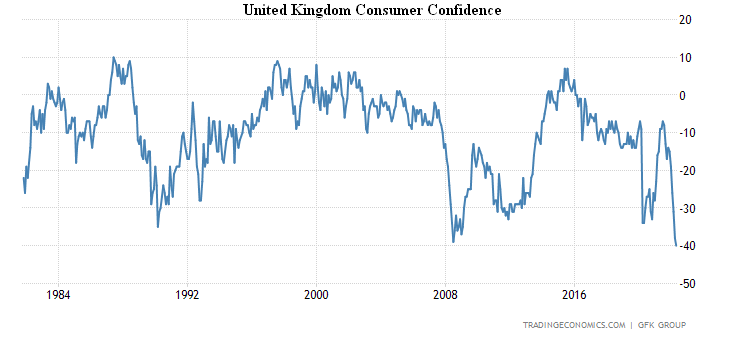
The British are extremely pessimistic in 41 years of observations:
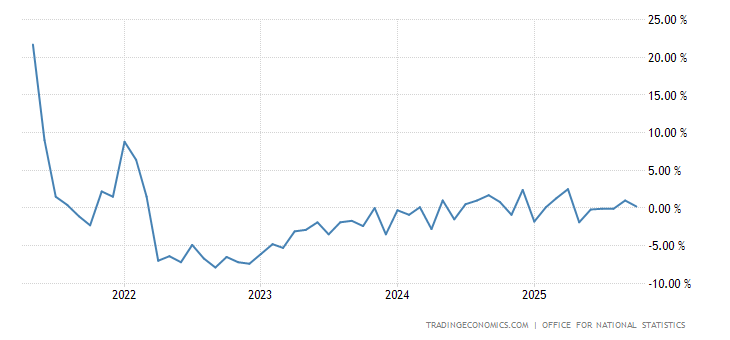
What affects demand — retail sales -4.9% per year in total and -6.1% ex-gasoline:
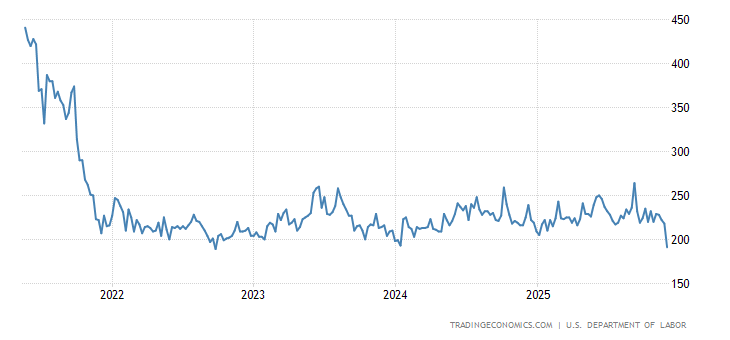
U.S. initial jobless claims are at their highest since January, and that’s with statistical gyps that shrink the labor force as much as possible:
The Chinese Central Bank’s annual rate is unchanged, but reduced its 5-year rate by 0.15% to 4.45%.
The South African Central Bank raised the rate for the 4th consecutive time, by 0.50% to 4.75%.
Summary. The main problem for US monetary authorities is that they are completely incapable of adequately perceiving reality. J. Powell can hike the rate for any given duration, but he can not achieve his goal of reducing inflation. This is clearly seen from the forecasts of the main institutions of the global financial system. Let me remind you that as early as last December, the IMF projected US GDP growth of 4% (now, officially, 3.7%), The Euro Area GDP growth of 3.9% (now 2.9%). The OECD expected 3.7% growth in the US economy in late 2021 (official 2.9%), for the Euro Area 4.3% and 3%, respectively. The Fed revised its forecasts from 4% to 2.8%. The World Bank, S&P, Moody’s and Fitch, the largest international banks, etc., showed the same results, with minor differences. A year ago, in June 2021, the Fed expected 3.4% inflation for 2021 and 2.1% inflation for 2022.
And the reality is this:
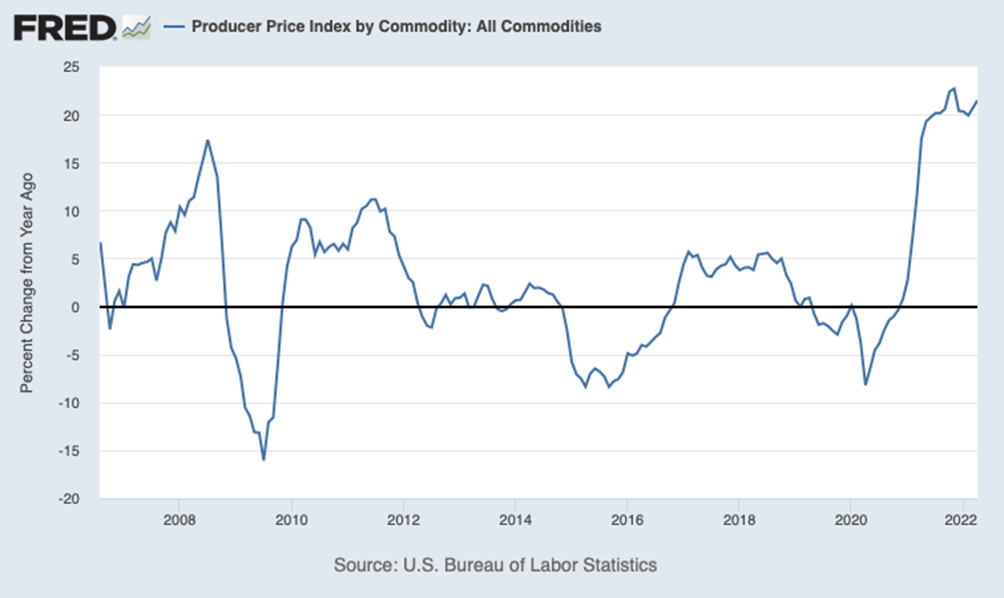
The graph of food commodities can be seen in the first section of the Review. The overall picture of inflation is also clear in the second section of the Review and in previous Reviews. However, it makes sense for US industrial inflation to repeat it, especially since there is a resurgence of its growth, which negates the previous week’s relative success:
In general, the macroeconomic picture of the last week shows that the entire world economy is, without exception, annexed by a structural crisis. Not only the US and the EU fell, but also China. At the same time, the adequacy of the monetary authorities of different countries remains a big question, none of them has bothered to give a clear commentary on the ongoing events and fundamental predictive errors of the last year. Although they do indicate that both models and statistics are clearly out of touch with reality. Let’s note, by the way, that our forecasts from a year ago were absolutely adequate.
Official growth figures have nothing to do with reality, inflation is so undercharged that growth has long been reversed in the US since at least the fourth quarter of last year. A few weeks ago, we analyzed the difference between official and real US GDP statistics and concluded that the gap is at least 5-6%, since then the situation has not improved.
For debt assets the yield is at least -8% (and here without any potential mood, inflation is about 20%, it is recognized that is about 10%, yield 2-3%). Raising the rate to a “neutral point” means that the cost of debt servicing will increase at least fivefold for households. This means a disaster drop in demand and massive bankruptcy of citizens.
The latter may be beneficial in terms of demand (as it amounts to debt cancellation), but it will hit the banking system hard, especially the largest transnational banks. There is no acceptable solution, given that the Biden administration and the US Democratic Party are precisely controlled by these banks.
In short, there is no light at the end of the tunnel. But readers of our Reviews are in a better position to learn the truth much earlier than their competitors. We wish you a good work week!