
Period: 24 – 30 October 2020
Top news story: The main news was the collapse of the stock markets, which with some fear was expected by quite a large number of players and experts (we talked about this in one of our previous reviews). The real scale of the recession was not only less than «terrible nightmare», but even less than just «nightmare». However, if you look at the pictures drawn by the technical analysts, they look quite frightening:
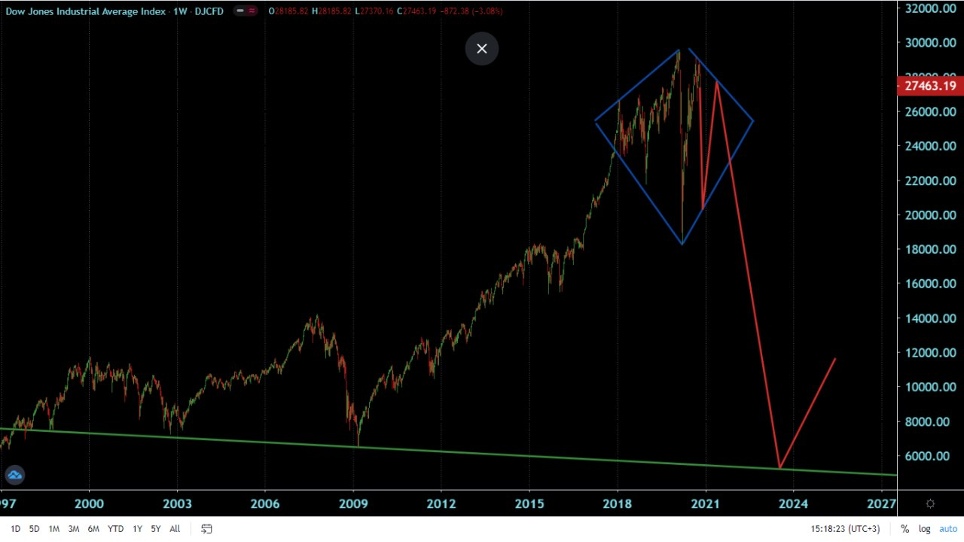
In fact, this is a five-fold decline in the market, and even assuming that its current performance is significantly overheated, it means a serious fall in GDP (at a strong recession, stock market performance is consistent with the actual state of the economy). Further, speculation begins, since our estimates show that the real GDP of the United States is about 15 trillion dollars, everything else is overvalued by means of emission revaluation of certain assets. However, if we look at the peak (21-22 trillion), this picture shows a drop of about three times, to just over $7 trillion.
The same 7-and-a-little trillion dollars (as shown in «Reminiscences about the future») are coming out of an estimate of the structural downturn of the US economy from 15 trillion. Since these figures are estimates, each can easily be disputed, but the fact that they yield close results greatly increases the likelihood that their estimate (7-7,5 trillion dollars) US GDP after the crisis is correct.
Macroeconomics
US GDP in the third quarter compensated for most of the fall of two quarters: 7,4% per quarter and -2,9% per year; it is still 3,5% below the peak of late 2019; of 22 million. Only half of the jobs lost in March-April have returned:
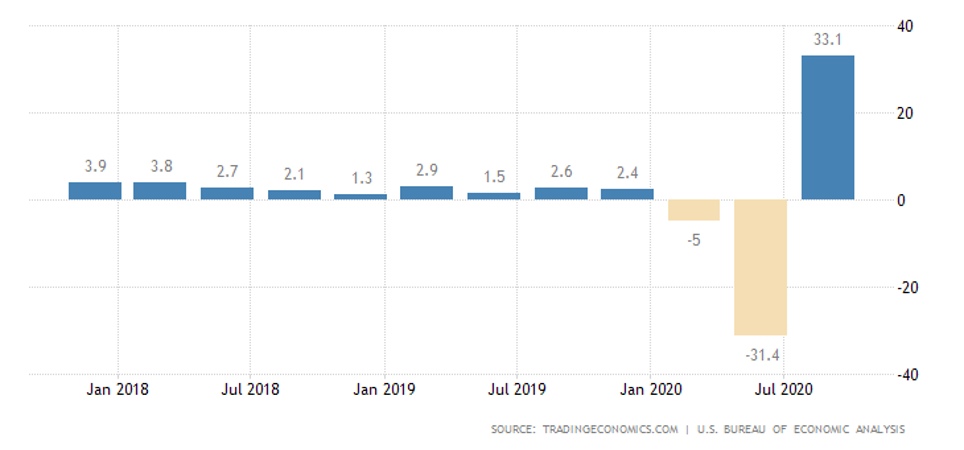
It should be noted that the emission money thrown into the market over the past six months could not but affect the GDP indicators. Since it is difficult to clean up the figures correctly today, it will probably only be possible next year, but it should simply take into account that in the high GDP data some part of the figures are fictitious, related to ultra-lenient monetary policy.
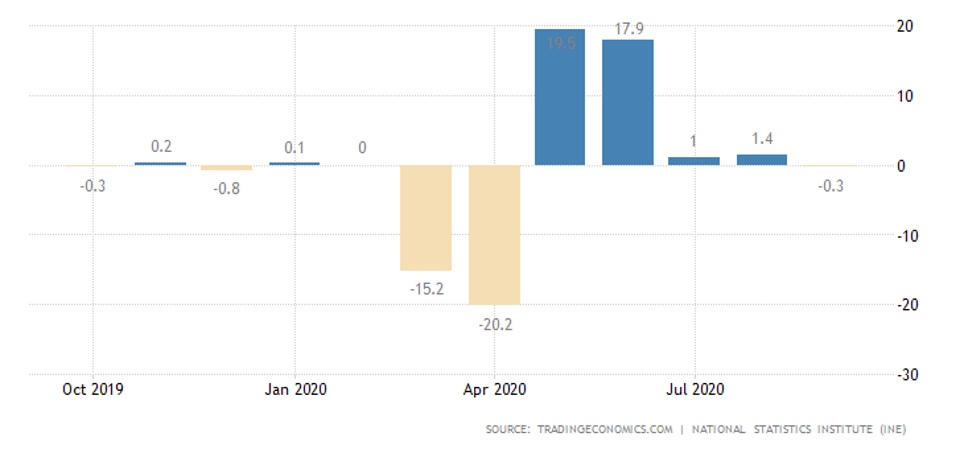
A similar story in France: GDP 18,2% per quarter and -4.3% per year, and in Spain: GDP 16,7% per quarter and -8,7% per year. The same is true for Italy: GDP 16,1% per quarter and -4.7% per year, for Germany: GDP 8,2% per quarter and -4,3% per year and for the Euro Area as a whole: GDP 12,7% per quarter and -54.3% per year. Even Mexico showed a similar picture: 12,0% per quarter and -8,6% per year.
Industrial production in Japan is reducing the annual decline slowly – still -9,0%.
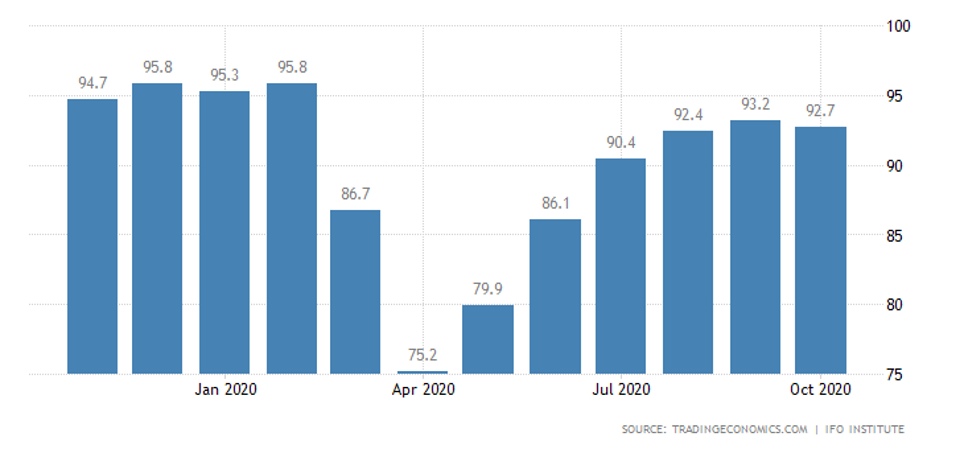
But the business climate in Germany, according to IFO, deteriorated in October:
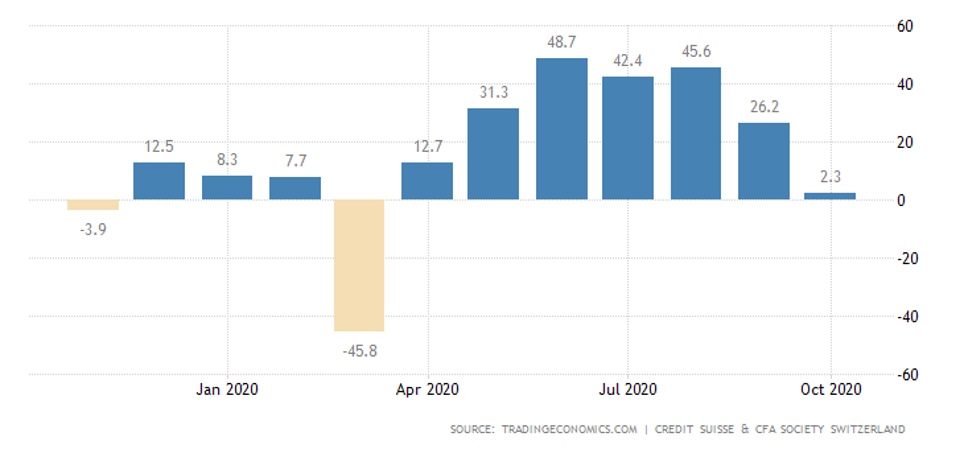
Economic sentiment in Switzerland from the ZEW has plummeted to the worst since March and close to zero:
Chicago Federal Reserve’s National Activity Index in September is the worst since April and has almost returned to zero.
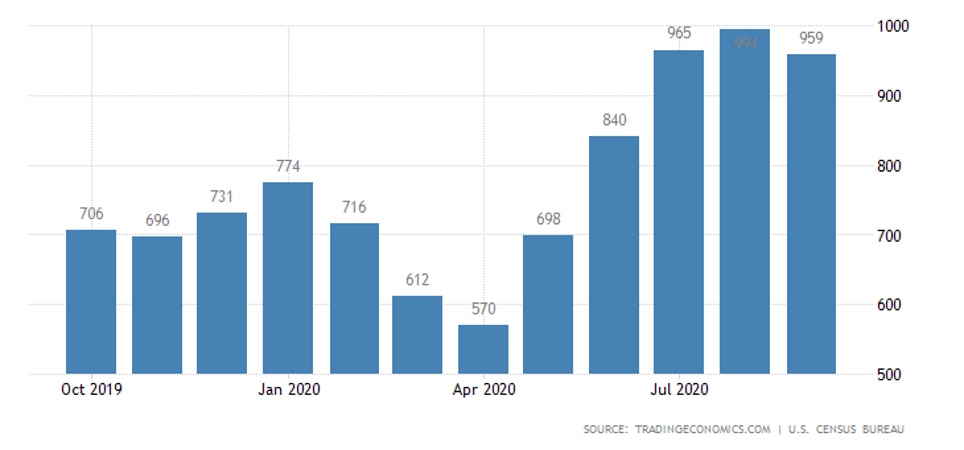
New home sales in the United States in September unexpectedly decreased – but remained in very high values:
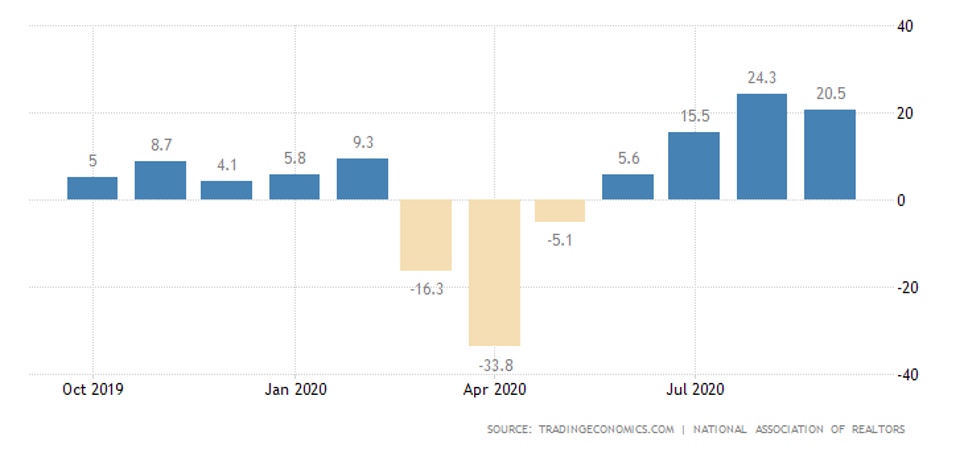
Same story with pending home sales:
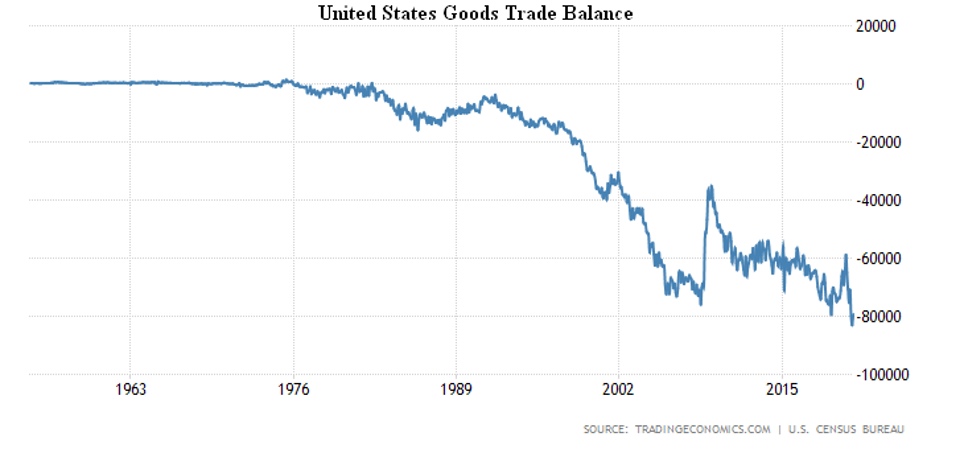
The deficit in the goods trade balance in the United States has become slightly smaller, but remains near a record peak:
Oil reserves in the US surged in a week in as little as three months, against a backdrop of weak demand.
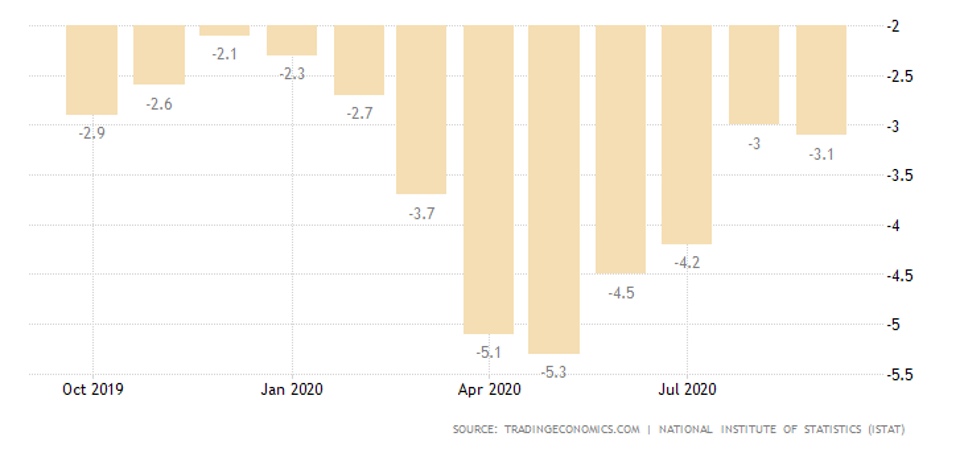
Italy’s PPI deepened the year-long decline:
Australia’s PPI is still the weakest since the beginning of 2010, Germany’s CPI is the weakest in almost six years (-0,2% per year), Spain’s CPI is minimal in less than five years (-0,9% per year), France’s CPI is at the trough of spring 2016, and the Euro Area CPI is the weakest since the beginning of 2015-2015; which, as is clear, indicates a weakening economy.
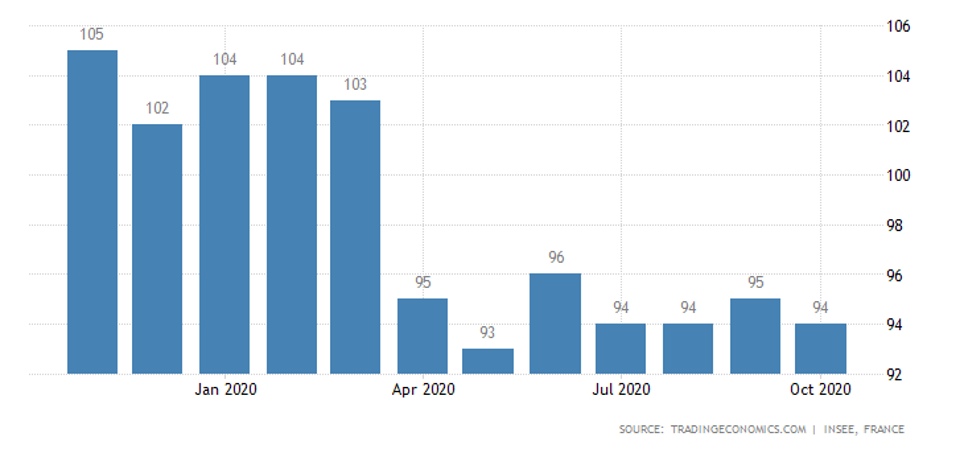
The market sentiment of the French began to deteriorate again:
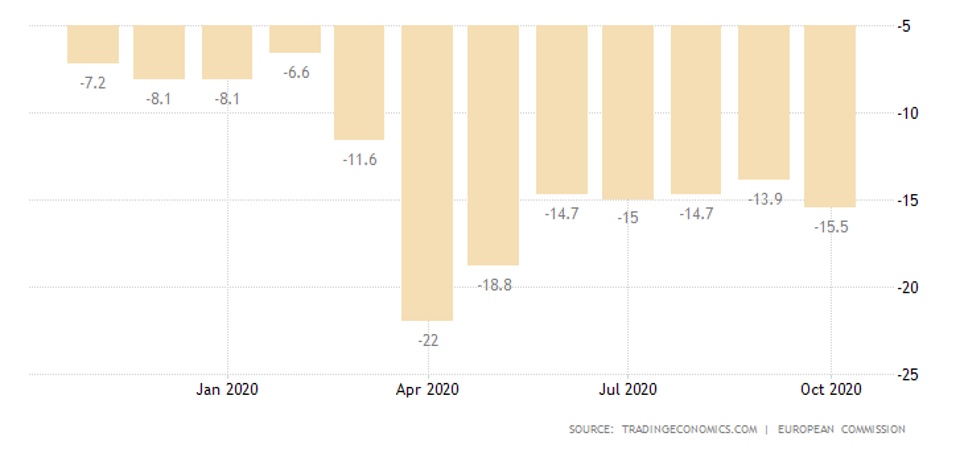
Italians’ market sentiments have also become grim. Overall, for the Euro Area, pessimism has peaked in five months:
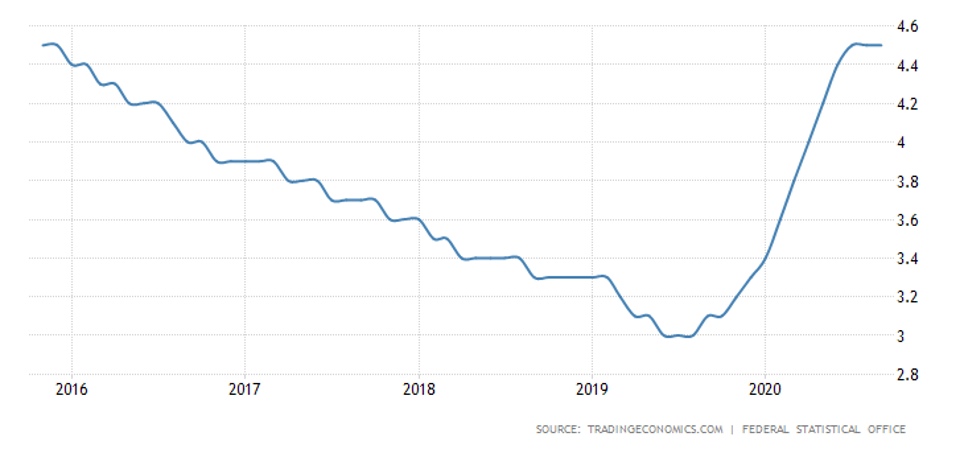
Unemployment in Spain in the third quarter is the highest in 2,5 years. In Germany in September, unemployment (by EU standards) peaked in five years:
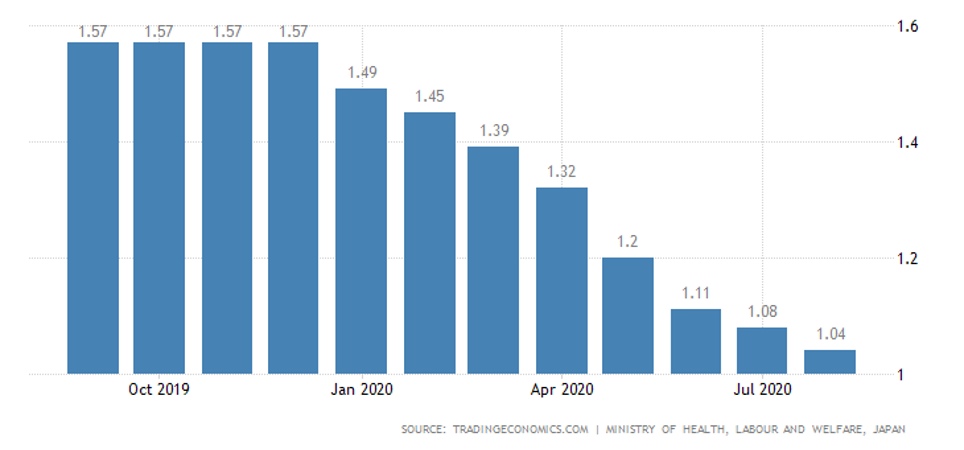
Japan has the highest unemployment rate since May 2017, and the ratio of vacancies to job seekers in Japan is the lowest in 7 years:
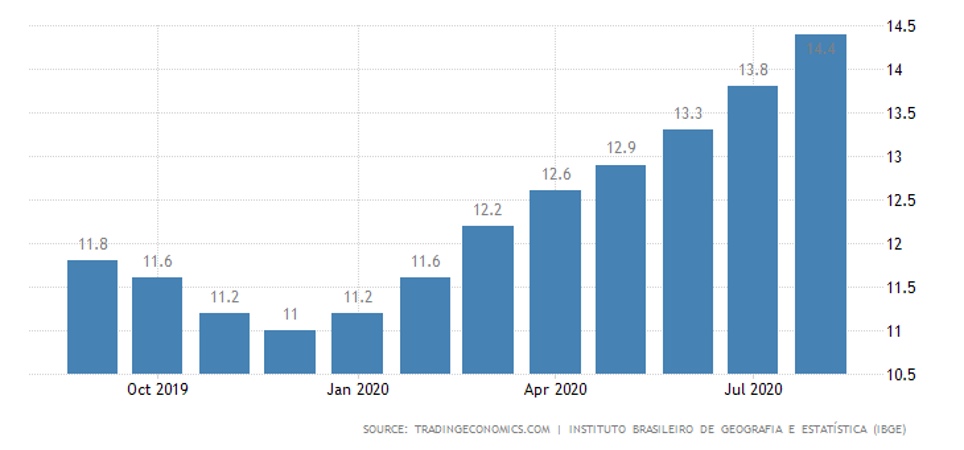
In Brazil, unemployment is at an all-time high and rising:
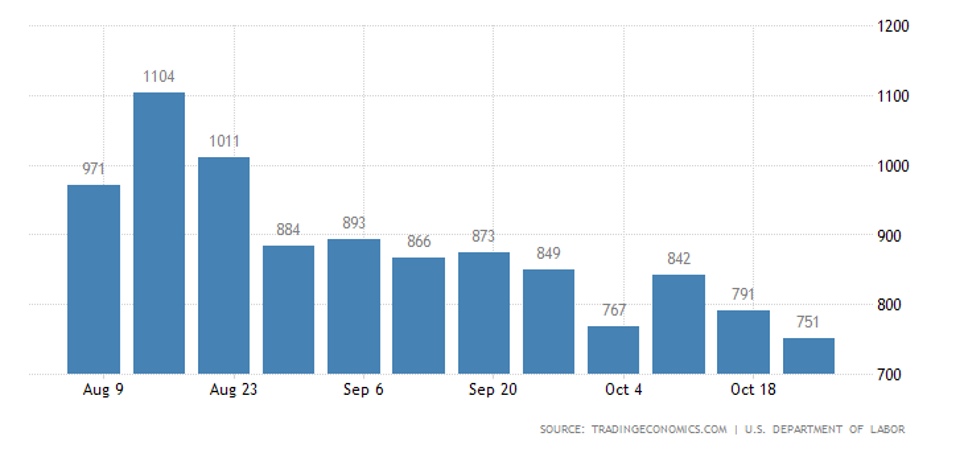
The number of applications for unemployment benefits in the United States is declining, but they are still very high; and more and more people are applying for emergency benefits (they are not included here):
The Spanish retail store in September showed a monthly negative value for the first time in five months, which increased the annual decline:
In Germany, retail is -2,2% per month, but the annual rate is positive, +6,5%. In France, household expenditure declined by 5,1% per month. The retail balance in Britain in October is the worst since June (-23%).
The Central Bank of Canada has left the rates in place, optimized the purchase of bonds, and expects GDP to drop by 5,5% in 2020.
Brazilian central bank keeps rates at record lows but admits that the possibilities of stimulus are almost exhausted.
The Central Bank of Japan has set a target yield of 10-year government bonds of 0%, and GDP is expected to decline by 5,5% per year.
The European Central Bank has left everything unchanged, but has promised to revisit the issue in December.
Summary: As was to be expected, emission programmes (especially the United States) contributed to the statistics, making it impossible to analyse GDP figures. At the same time, prices in countries where the size of the printing press is lower than the FED show a marked downward trend, suggesting that depressed processes continue. A similar picture for unemployment and retail.
Thus, once again we find that in the context of crisis and active monetary policy, it is not possible to assess the situation against any single indicator. It is necessary to give a comprehensive assessment, including taking into account general economic trends. Working with «net» macroeconomic indicators in such a situation can lead (as in the case of US GDP in this review) to significant errors.