
Time period: 19 – 25 June 2021
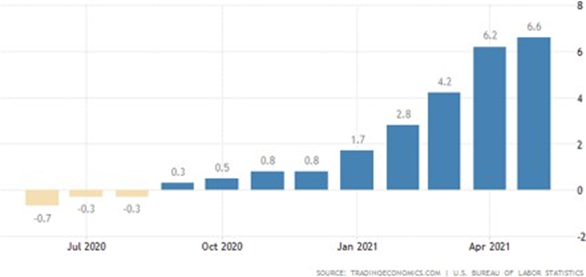
Top news story. The main news was the second US GDP release for the second quarter, which showed the same amount as the first: 6.4% by year. This result is remarkable, but there are a number of issues. In particular, according to official statistics, the value of the deflator index is 4.3% – a large but not an extraordinary value. However, the official index of PPI (Producer Price Index) in May (see the previous Review) is 6.6%:
And the real PPI is 19%:
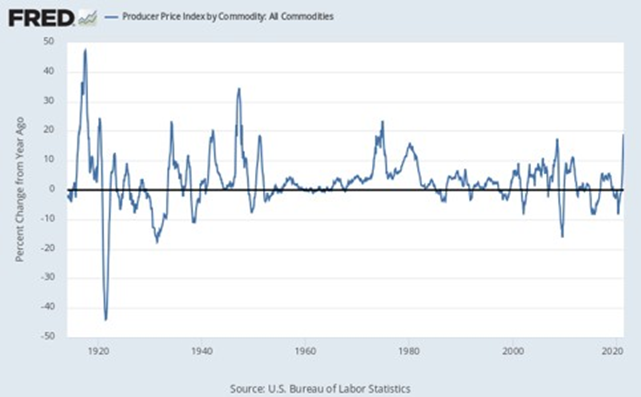
And let us count now. The share of industry in US GDP is about 21%. This means that the difference between the official indicator and the real indicator (19 – 6.6 = 12.4%) must be divided by approximately 5, which results in still close to 2.5%. That is, real inflation in the US is probably at least 7%, with the Fed chair J. Powell saying that 5% is critical. Yes, and of course we need to reduce GDP by 2.5%, which is not 6.6%, but close to 4%.
This, of course, is also a very good result (and, by the way, is more like the corresponding reality), but assuming that “secret” industrial prices by autumn will become clear – will pass through production chains and will reach the final products – by the fall, we will have real inflation of about 10%. And that makes GDP growth almost zero.
Moreover, if industry inflation is 19%, in order to obtain a 4.3% deflator, inflation in the rest of the economy must be at least slightly above 1% (in this case I leave the calculation to the readers as an exercise). Since in reality price increases are much higher, the picture is all too bleak: inflation rates are clearly adjusted much downwards.
Macroeconomics
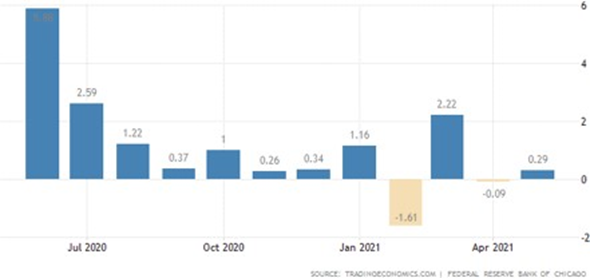
The Chicago Fed National Activity Index has returned to positive values, but only thanks to the production component (it is still recovering), while the contribution of all other domains (employment, sales, orders, stocks and, especially, private spending and housing) turned out to be zero:
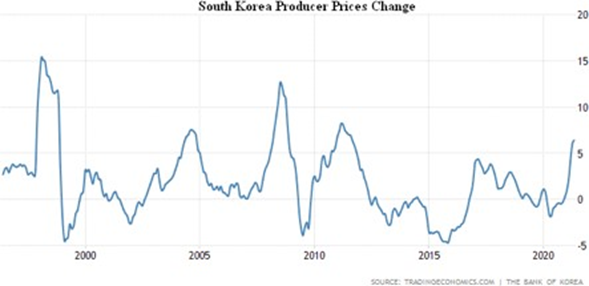
PPI of South Korea + 6.4% per year – the highest since 2011:
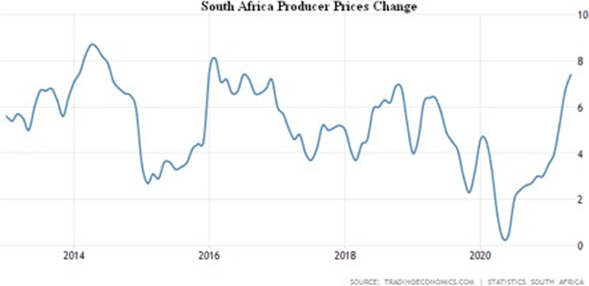
PPI South Africa 7.4% per year – top in five years:
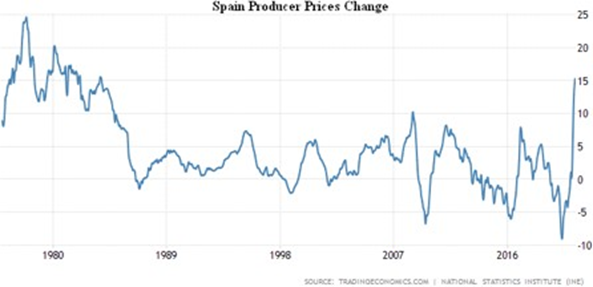
Spanish PPI + 15.3% per year, peak since 1983:
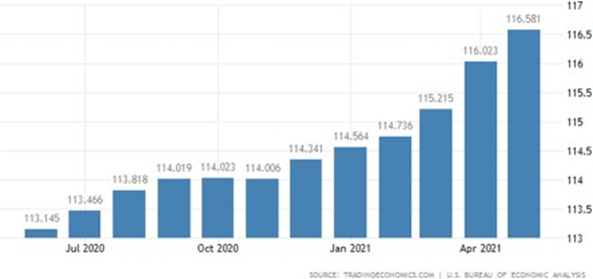
Personal Consumption Expenditures Excluding Food and Energy (Chain-Type Price Index) (PCE) is 3.9% per year – the highest since 2008:
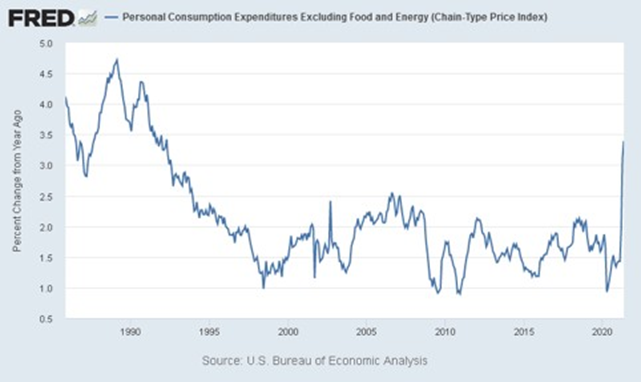
Excluding food and fuel + 3.4%, peak since 1992:
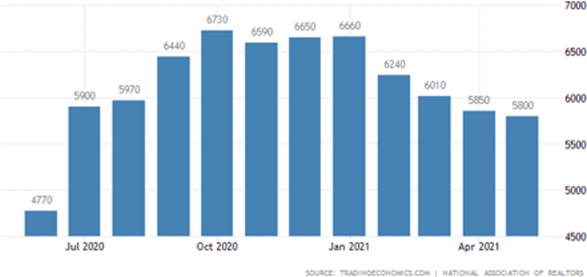
Existing home sales in the US are the lowest in 11 Months, Median Price + 23.6% per year:
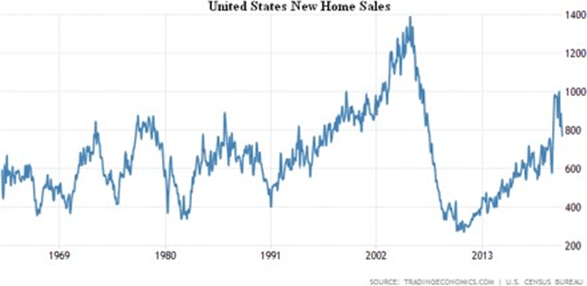
US new home sales -5.9% per month to the annual trough, -22.6% from the peak in January – back to the pre-pandemic level; price 18.1% per year:
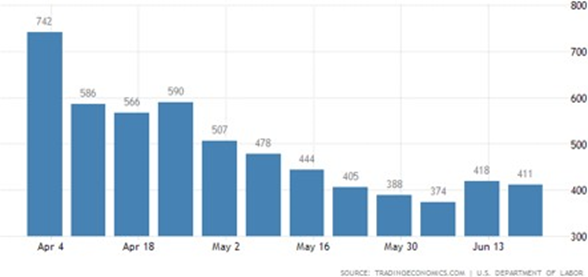
US jobless claims no longer show a downward trend, but some states are already canceling emergency programs:
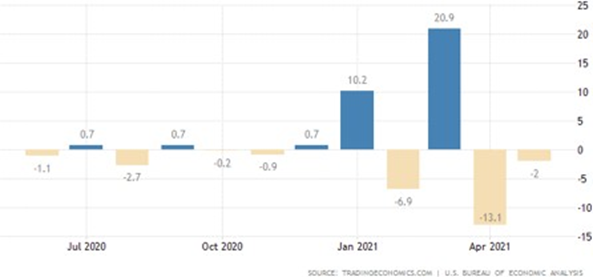
Personal incomes in the US are back to pre-incentive levels:
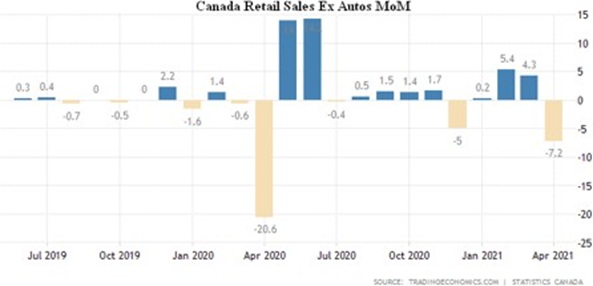
May retail sales slowed down everywhere: Australia only 0.1% per month, Mexico 0.4%, Canada 5.7%, and no cars 7.2%.
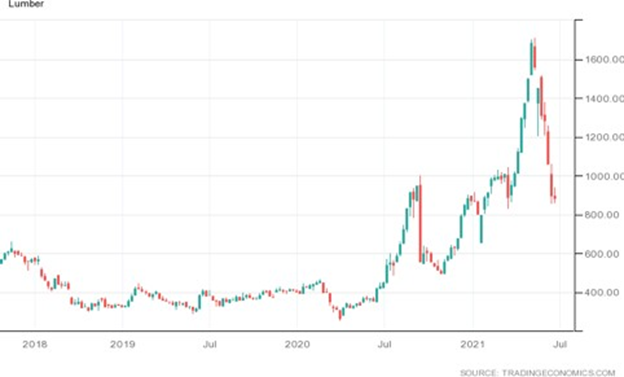
Oil is at the 14-month top and close to the levels of the fall of 2019, but lumber fell from the top by half (builders simply stopped buying them), but before that they skyrocketed as much as 7 times a year:
The PMI index (Industry Status Index, below 50 signifies stagnation) in Western European countries has started to rise: in the United Kingdom, 61.7 (62.9 in May); in the manufacturing sector, 64.2;
In the services sector of the Euro Area 58.0, in May it was 55.2$ Composite Index: 59.2, in May it was 57.1;
In France: 57.4 is in the service sector, in May it was 56.6; Composite Index: 57.1, in May it was 57.0;
In Germany: 58.1 is in the service sector, in May it was 52.8; Composite Index: 60.4, in May it was 56.2.
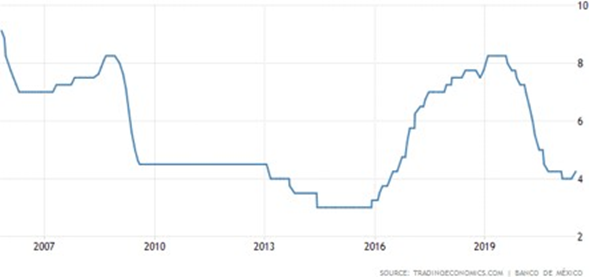
The Central Bank of China left monetary policy unchanged, as did the Bank of England. In the latter case, however, a dissident found himself voting on a government bond buy-back plan. But the Central Bank of Mexico has already begun to raise rates:
Summary. Let the PMI indexes not be too enticing to you – they merely show that the EU is lowering quarantine restrictions. The reason for joy will come only when it is clear that wages paid are beginning to dominate compensation payments, and GDP will start to rise, and this is still a long way off. At the same time, it must be recognized that, since inflation is being grossly underreported by the authorities (see the first section of this Review), GDP in turn will be grossly overestimated.
Serious distortions and shifts in statistics make it very difficult to draw conclusions from them, which makes life very difficult for small and medium-sized businesses (large businesses can afford to build their own statistical base). It is for this reason that our Foundation started issuing Reviews more than a year ago, and we will try to best describe the deviations of official statistics from reality so that we can draw more adequate conclusions from our reviews than from government reports.
We wish our readers a successful weekend and a smooth opening of the holiday season!