
Time period: 3 – 6 July 2021
Top news story. The main news is the internal discrepancy in statistics, which is beginning to appear more and more obvious. To supplement United States labor statistics from the previous Review, there are two indicators from a week ago – the participation rate in the total labor force, April: 61.6%, May data: 61.6%. That is, the number of the labor force remained almost the same, with the unemployment rate falling (U-6), in June 9.8%, in May 10.2%.
Everything seems to be fine. However, the number of initial jobless claims rose again: 373,000, with a projected 350,000 and a weekly estimate of 364,000. Yes, these are weeks apart, but they mean that at least there is no sustainable improvement. Note that this discrepancy is due to the fact that these data are not quantitative but, at best, sample data restored by mathematical models. And these models are different for different indicators. This means that they respond in completely different ways to the current situation, in which the labor force behaves under huge subsidies, both to the workers themselves and to the employers.
Accordingly, there is no reason to believe that the facts are optimistic or, on the contrary, pessimistic. And we need to look at the state of the economy in terms of those indicators that are harder to falsify, which are the ones that we write about in our Reviews.
Macroeconomics
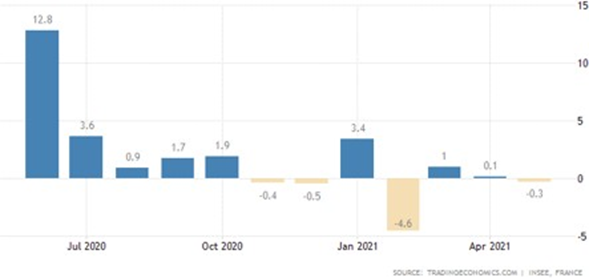
Industrial production in France -0.3% per month, in general, over the past 8 months, it has near-zero dynamics:
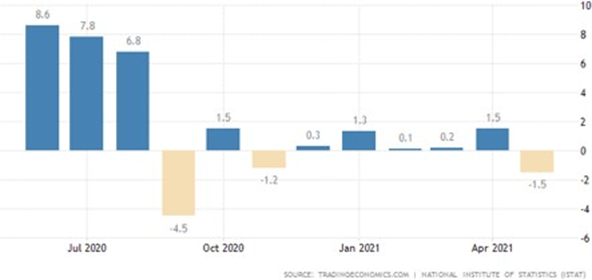
In Italy, the rate was -1.5% per month. Over the last nine months, the overall trend has been negative:
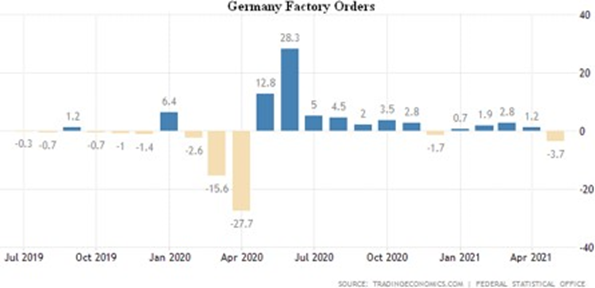
Factory orders in Germany -3.7% per month, the worst growth dynamics since April 2020:
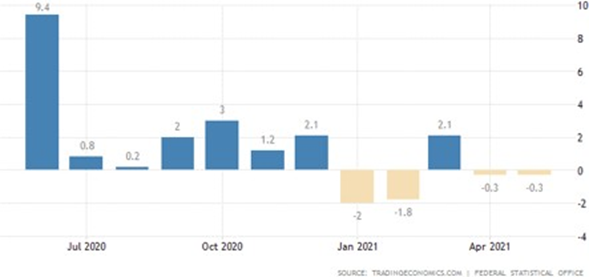
Output of the German industry -0.3% for the second consecutive month and the 4th negative for the last 5 months: capital goods -3.4%, vehicles -7.2%:
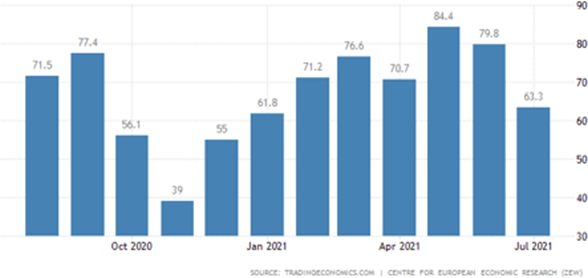
Accordingly, ZEW Economic Sentiment Index in Germany is on the semi-annual trough:
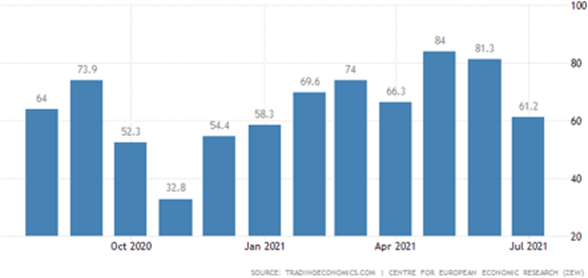
The same is true for the Euro Area as a whole:
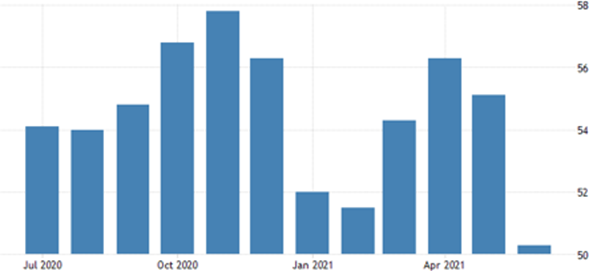
PMI (index of expert assessment of the state of affairs in a particular industry; a figure below 50 means a decline) in China’s services 50.3 – 14-month low, as in new orders employment has gone down:
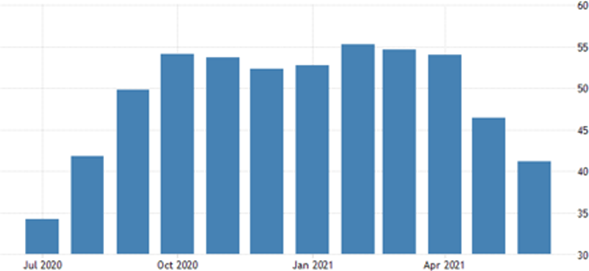
The same indicator of India 41.2 – it, components of the release and new orders are on the trough from July 2020:
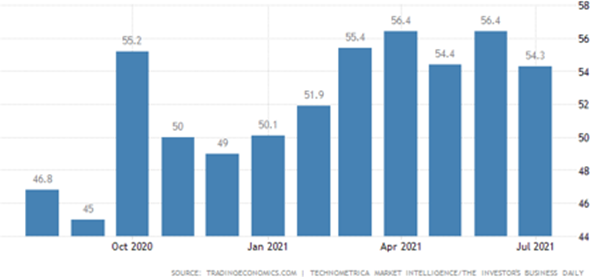
In the US, at a 4-month low, employment fell into a recession zone:
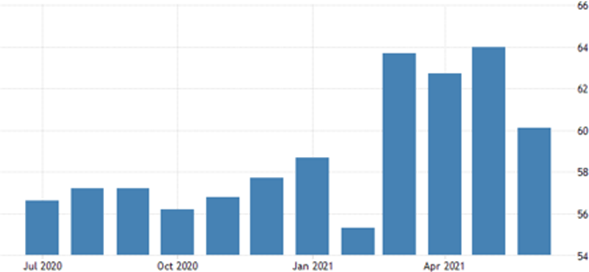
United States IBD/TIPP Economic Optimism Index is the worst in 5 months:
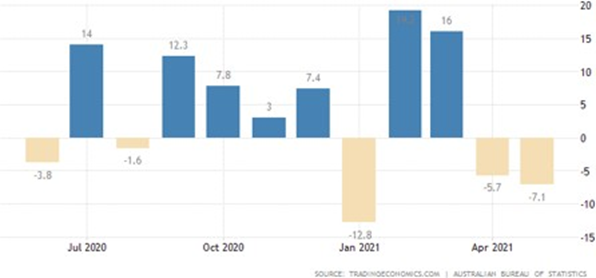
Dwelling Approvals in Australia -5.7% per month after -7.1%, the housing sector has fallen particularly hard:
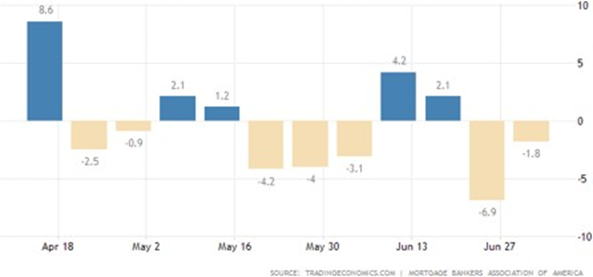
Mortgage applications in the United States are still -1.8% per week to the lowest since the beginning of 2020 amid soaring house prices:
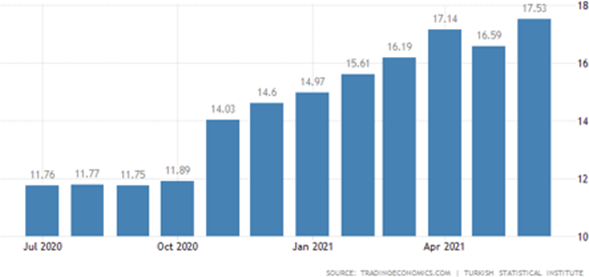
CPI (Consumer Price Index) of Turkey +17.5% per year, the highest since May 2019:
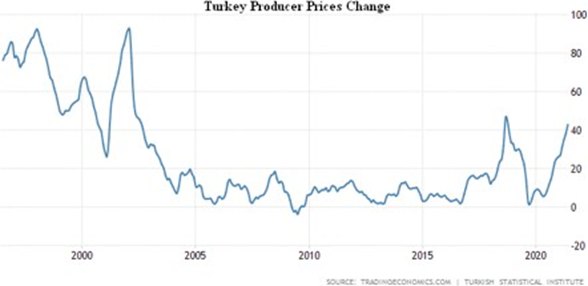
And Turkey’s PPI (Producer Price Index) +42.9% per year – a peak since November 2018 and already close to the levels of 2002:
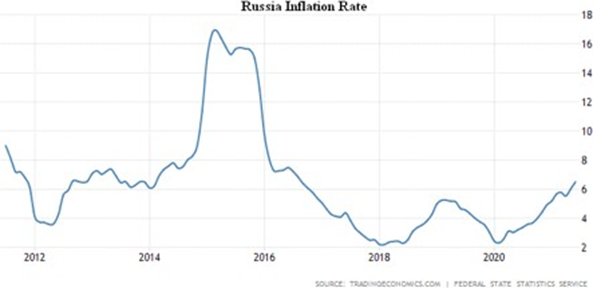
CPI of Russia 6.5% per year, this is a peak in 5 years:
CPI Brazil 8.35% per year, this is also a maximum of 5 years.
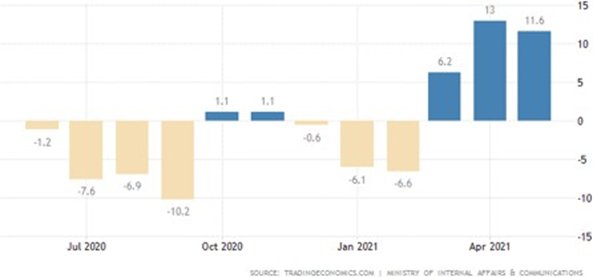
Household spending in Japan in May -2.1% per month after + 0.1% in April:
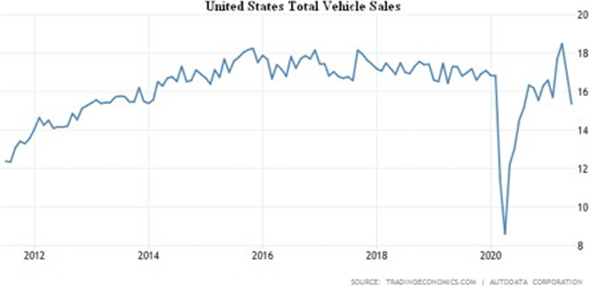
Vehicle sales in the United States in June have fallen by almost 10% a month to a minimum since late 2013, with the exception of five months of plummeting in the midst of a pandemic:
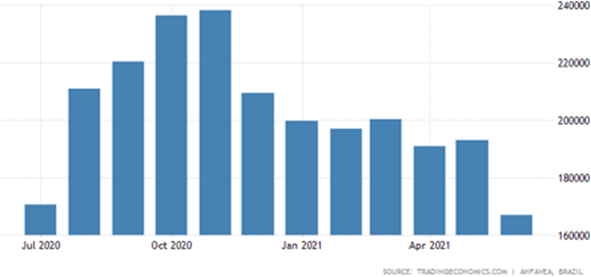
In Brazil, the production of cars -13.4% per month to a minimum from the beginning of 2016, again without a gap year ago:
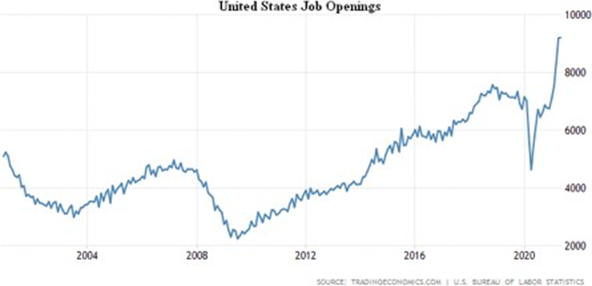
The number of openings in the United States is at a record level, but recruitment is declining – even a salary hike is not enough for it:
The Central Bank of Australia left monetary policy unchanged, but cut bond purchases by 20%.
The Fed’s protocol has confirmed that current policies are being maintained, but disincentives may come before planned.
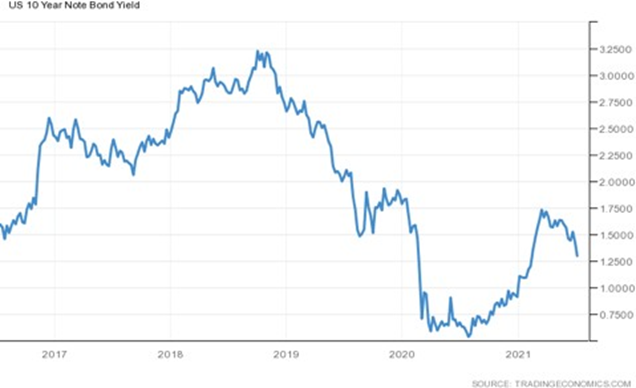
The yield on 10-year US government bonds slumped below 1.30%:
Summary. In addition to the systemic distortions of statistics that are carried out by the statistical agencies themselves, new ones have emerged. These new shifts have not yet been explored –never have mathematical models been tested at such emission levels – and therefore the distortions they introduce into the totals are unknown. In the case of labor statistics, we have noted them in this and previous Reviews.
It should be noted that many statistical indicators are actually defined in monetary terms (for example, industrial output is counted in dollars instead of units). And for that reason, if inflation is lowered, we see a very optimistic picture that may be completely untrue. Here, too, the study of different indicators can provide enough food for thought.
In the US, in particular, economic optimism is declining despite the fact that many indicators seemingly beginning to improve. But in the last June Review, we described the extent of the distortion of inflation statistics, with all the attendant consequences. It is clear that in such a situation the whole picture needs to be very carefully considered.
In particular, we will also give a chart of personal income of US citizens:
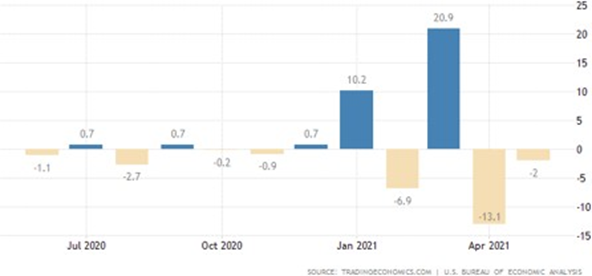
It is obvious that against the background of falling personal incomes abstract data about growth «somewhere there» (and it is not yet fully clear how they are adequate) look rather unconvincing.
We wish all our subscribers a good weekend and pleasant summer weather!