
Time period: 24 – 30 July 2021
Top news story. The most interesting is a graph of the volume of short-term repurchase agreement operations in the United States market.
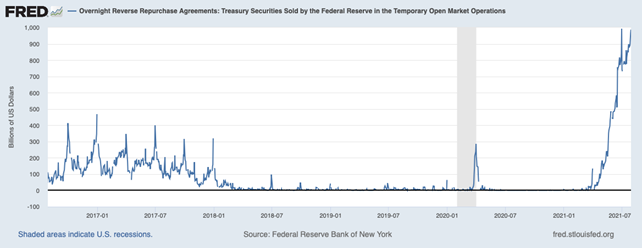
In fact, this graph means that the liquidity of some American banks leaves much to be desired. And those who are doing well refuse to lend to other banks. The ground for deeper conclusions is still rather fragile, but this growth suggests that the banking system can no longer function normally without serious emissions.
Macroeconomics
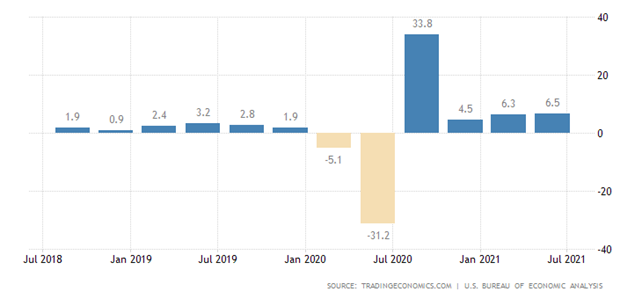
US GDP growth in the third quarter is still markedly below expectations:
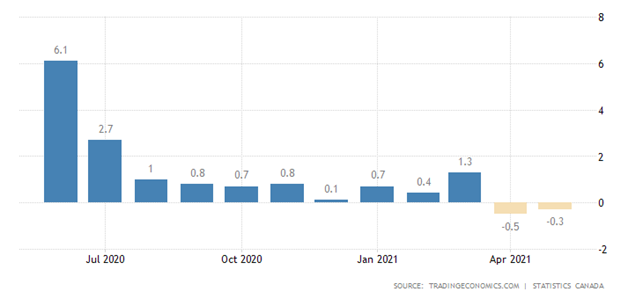
Canada’s GDP slumped by 0.3% in May, after -0.5% in April:
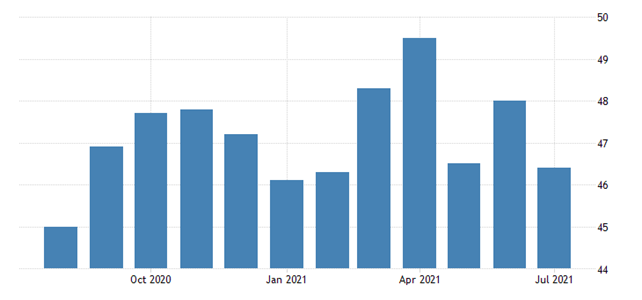
Japan PMI (Purchasing Managers’ Index) is the weakest in 5 months, and is firmly anchored in the recession zone (i.e., below 50) where it remains 1.5 years:
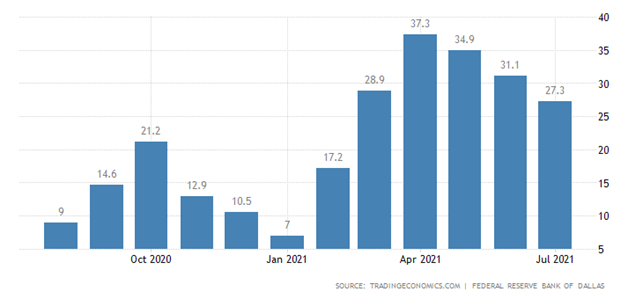
The regional activity index of the Dallas Federal Reserve Bank has been at its trough for five months:
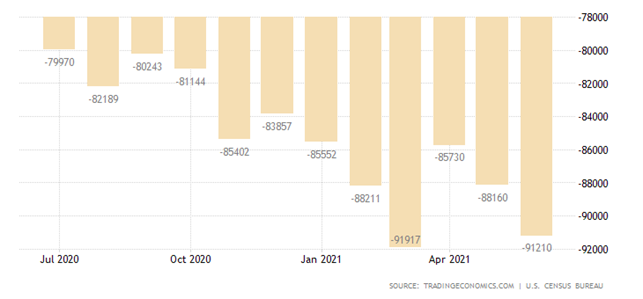
The US deficit of foreign trade in goods almost mirrored the March historical record:
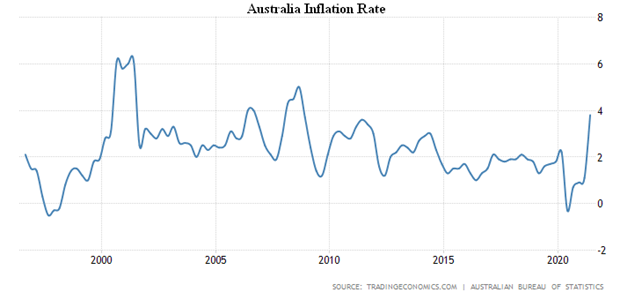
CPI (Consumer Price Index) of Australia in the 2nd quarter + 3.8% per year – the peak since 2008:
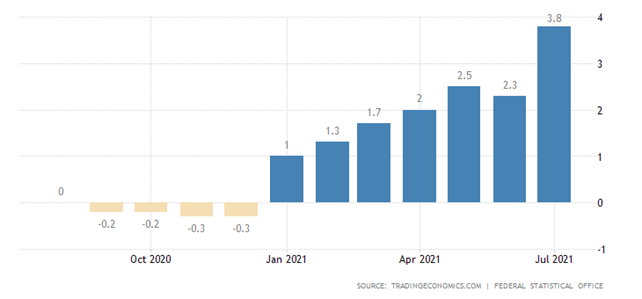
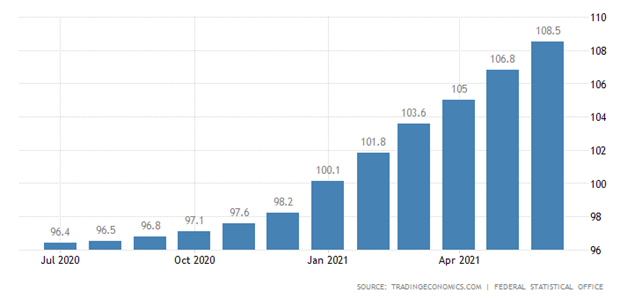
CPI in Germany + 3.8% per year – the highest since 1993:
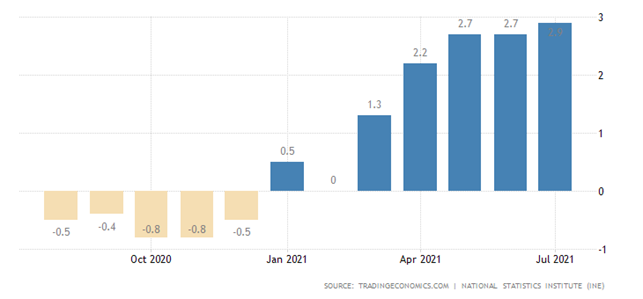
CPI in Spain 2.9% – peak since 2017:
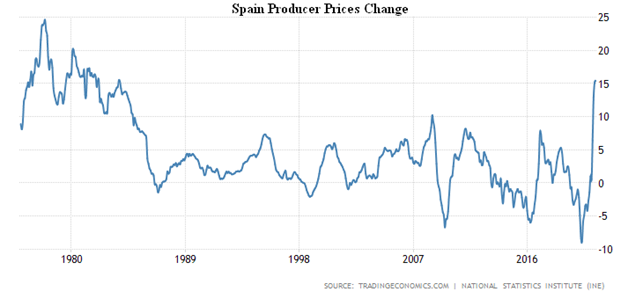
PPI (Producer Price Index) of Spain + 15.4% per year – the highest since 1983:
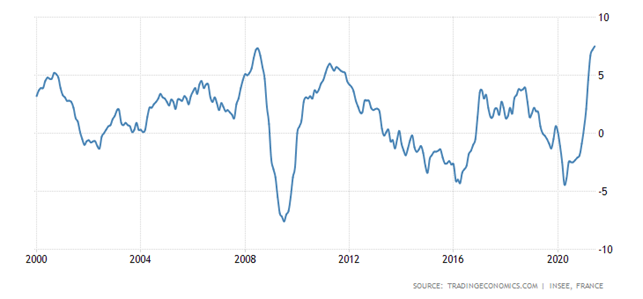
PPI France 7.5% per year – the highest ever recorded since 2000:
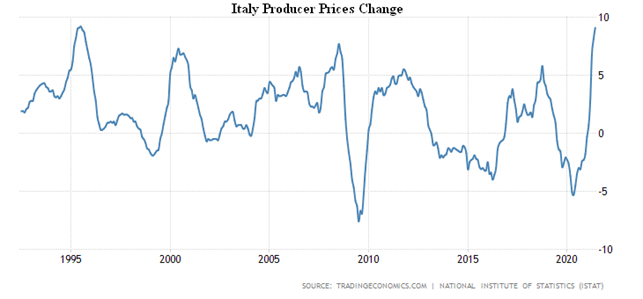
PPI of Italy + 9.1% per year – almost a peak since 1995, to which only 0.1% was not enough:
German import prices + 12.9% per year – peak since 1981:
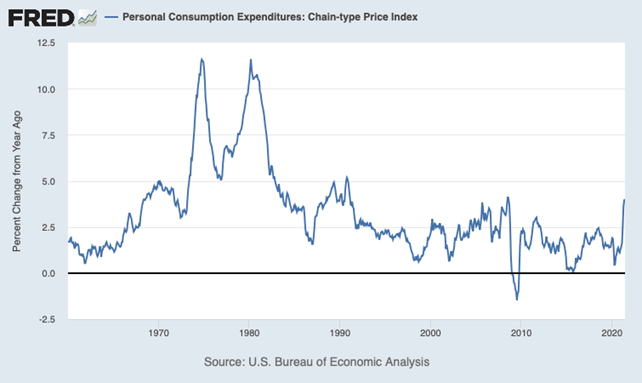
Personal Consumption Expenditures Index the US index in June was 4.0% per year – the highest since 2008:
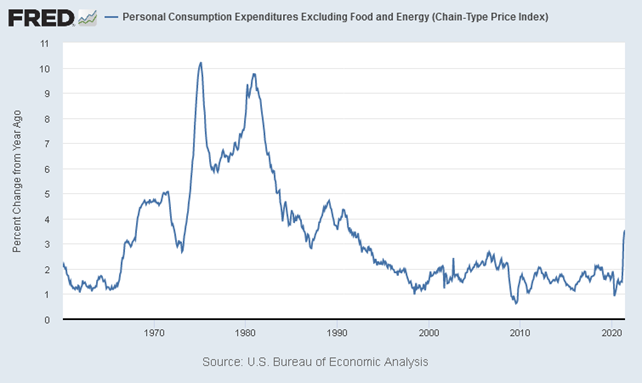
Excluding food and fuel, 3.5% is the top since 1991:
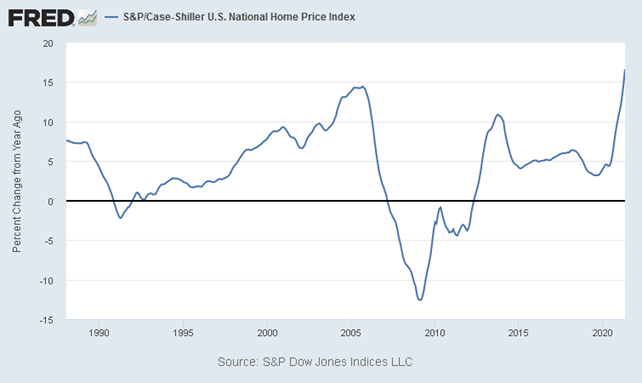
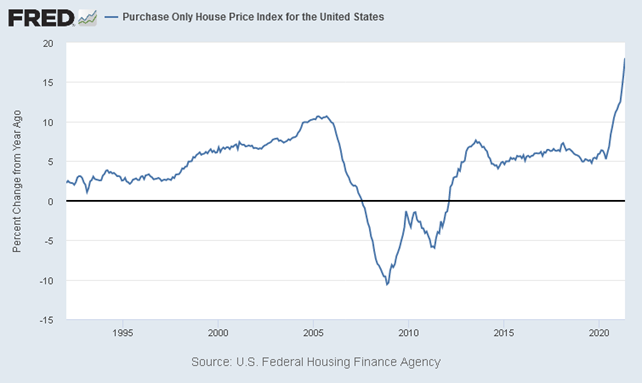
National Home Price Index in the USA from S & P / CoreLogic / Case-Shiller + 16.6% per year, it’s a record for entire 23.5 years of observation:
Historical maximum also according to official data (+18.0% per year):
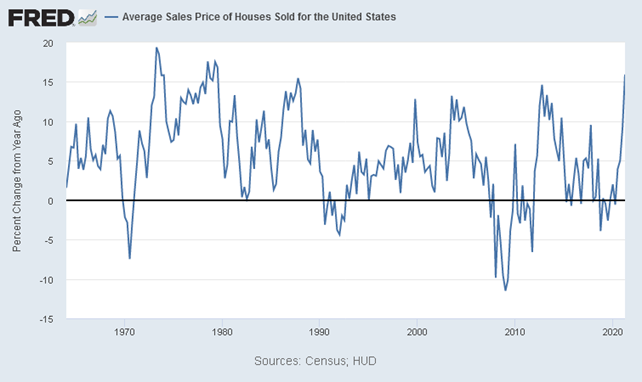
The average real price of a house sold in the United States in the 2nd quarter is 15.9% per year, the highest since 1979:
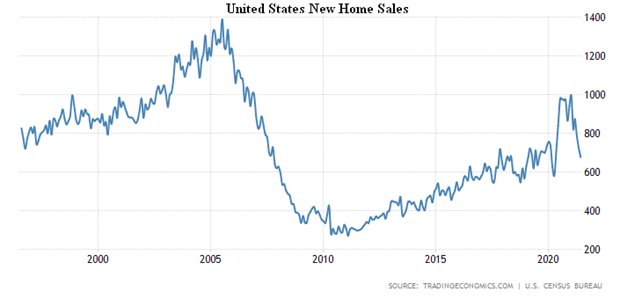
New home sales in the US are at their lowest in 14 months, at the 2018/19 average and half the 2005 peak:
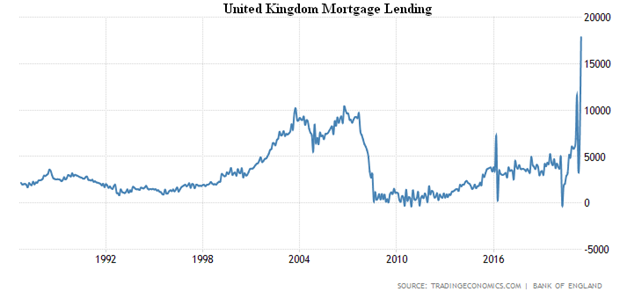
UK mortgage loans hit a record: UK mortgage lending hits a record:
The US Federal Reserve meeting this week has shown that it is not yet ready to change its previous monetary policy, although it has made clear that discussions about winding down incentives will begin soon.
Summary. Inflation is rising rapidly, which means not only curbing stimulus, but also raising rates (tightening monetary policy). But as the graph from the first section of this Review shows, doing this action is extremely dangerous. Not to mention the huge amount of accumulated debt makes it virtually impossible to raise the cost of servicing a loan without massive bankruptcy proceedings.
Attempts to somehow regulate the markets, as, for example, was done in Hong Kong, where the authorities tried to limit the flow of speculative (emission-based), heave led to bad outcome:
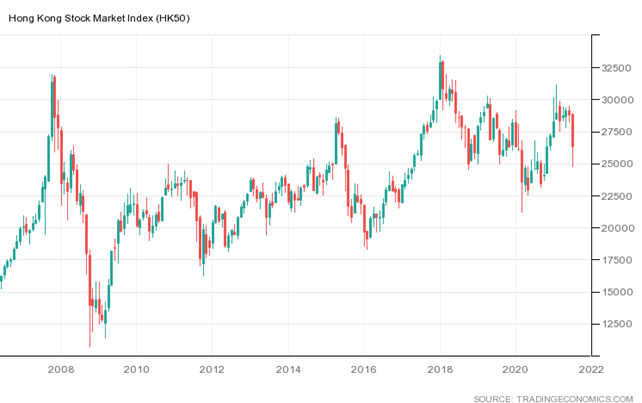
Special consultations had to be held with domestic buyers in order to avoid the collapse of markets, but that could not be a frequent practice. In general, despite the continuing holiday season, market tensions are mounting.
And one has to take into account that GDP growth (including in the US) is partly linked to an underestimation of real inflation. So even these optimistic figures may well not really be that optimistic.
We wish all our readers a pleasant weekend and good summer weather, without floods and hail!