
Report of Mikhail Khazin Foundation for Economic Research
- Root causes of the crisis. The fading of the liberal economic model
By the 1970s, the Bretton Woods system, whose principles had been laid down in 1944, had exhausted its natural development. Lending through the Bretton Woods institutions (IMF and the World Bank), compliance with GATT rules (the future WTO) and other instruments have dried up in the US-controlled part of the world economy. As a result, on August 15, 1971, the United States was forced to stop pegging the dollar to gold, and the crisis of the 1970s began. Assessing it seems to be a rather difficult task because statistical methodologies have changed several times since then. The analysis of the Mikhail Khazin Foundation for Economic Research shows that the 1970s were a period of continuous economic decline in the «Western» (i.e., subordinate to the Bretton Woods model) division of labor.
According to the theory we are developing (see M. Khazin «Crisis of capital effectiveness», 2020), this problem had only two solutions: either expansion of the «western» system of division of labor, or – beginning of «extra-economic» (i.e. due to artificial, emission resources) demand stimulus. Preference was given to the second variant, which was named «Reaganomic» in history (although it was prepared under US President Jimmy Carter). This happened because in the 1970s the Soviet (USSR-based) division of labor was unshakeable.
The essence of the «Reaganomics» model was to stimulate private demand by refinancing household debt at a continuously decreasing interest rate. In 1980, the US Federal Reserve’s discount rate was 18%, but by 2008 it had dropped to zero. Probably, the crisis would have happened earlier, but in the late 1980s the Soviet system of division of labor collapsed, giving the western (and since 1991 – world) economy about 10 years of respite (the so-called «golden age» of Clinton), due to the sharp increase in the number of consumers.
The 2008 crisis showed that this resource has also run out. For some time, the US FRS printed money, supplying the budget with it and filling the gaps in the banking system, and this resource is still in use, but it is also nearing exhausting. More information on this situation can be found in the above-mentioned book by M. Khazin, but in this report we look at the current situation in the US economy. However, the current situation does not seem to be favorable, the economic recession cannot be stopped, and the liberal economic model, structured according to the logic of «Reaganomics», has already for more than 10 years been signalling its inability to ensure economic growth. The economic crisis continues and all the conditions are in place for it to enter a phase of extreme escalation. From a historical point of view, we are now somewhere between October 1929 and the spring of 1930. An exact analogy cannot be made, because the COVID-19 pandemic triggered a structural crisis before the markets collapsed. If demand is cut off financially, this transition will begin immediately, and the efficiency of the economy’s emissions stimulus is declining, necessitating a steady increase in the capacity of the printing press.
During the 2020 pandemic, extensive quarantine measures were carried out in various countries. Large segments of the population did not work or worked remotely, causing a significant decline in production. In fact, the downturn masks a true crisis that should have begun later. However, the coronavirus factor, which did not fit into the standard economic order, catalyzed the development of expected events. Quarantine actions simply triggered a structural crisis in the world economy, similar to the crisis of 1930-32, which led to the Great Depression before the collapse of the markets. For these reasons, as we warned earlier, a rapid economic recovery cannot be expected.
Because liberal economic theory does not describe structural crises, the Bretton Woods institutions and policymakers have tried to create a sense of an imminent return to early-year indicators. Expectations of an early end to the recession and recovery failed: growth virtually ceased by the end of summer this year. In the current situation, the world economy is returning to recession without recovering from previous shocks. This is fully consistent with our ideas, and the main advice that we can give our readers is to assume that there will be no economic growth in the coming years.
- The US real sector and the global financial elite, their position and interests during the crisis
The Bretton Woods financial and economic model has significantly changed the place and status of the US in the global economic system. While in 1944 the US accounted for at least 50% of world GDP, today the US share of production is less than 20%. At the same time, with a large number of countries, the US has serious trade deficits, while the vast majority of calculations are made in United States dollars. Until 2008, the trade deficit was filled by a balance-of-payments surplus, because most of the world’s investment was in United States dollars, so the returns on those investments were automatically returned to the dollar system. But since 2008, total returns on investments in the world economy (more precisely, its real sector) have become negative, a serious crisis has started (the fourth Decline in Capital Efficiency according to the classification «Reminiscences of the future»). Until 2014, this situation was offset by net emissions, but then the global economic system’s liquidity problems began to soar. In fact, in order to save the global dollar system, the share of American production in the world must be further reduced from its current 17-18% to a conditional 5%. In this case, if something should happen to the global dollar system, America will not be able to feed its population, and there will be no money to import. That’s a fact that the American elite actually understands. It was for this reason that already since November 2014 (based on the results of the midterm elections on November 4), it became clear that a part of the American elite, wishing to abandon the Bretton Woods system and regain the position of the American economy («Make America Great Again»), has regained the right to vote
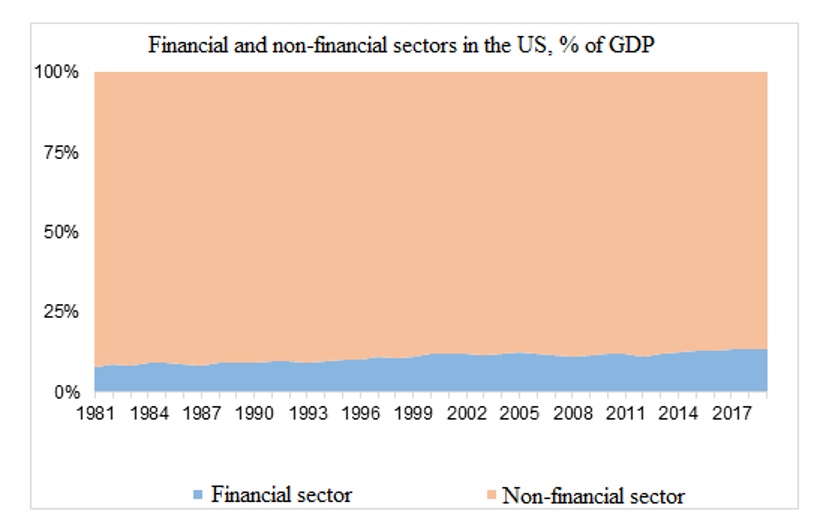
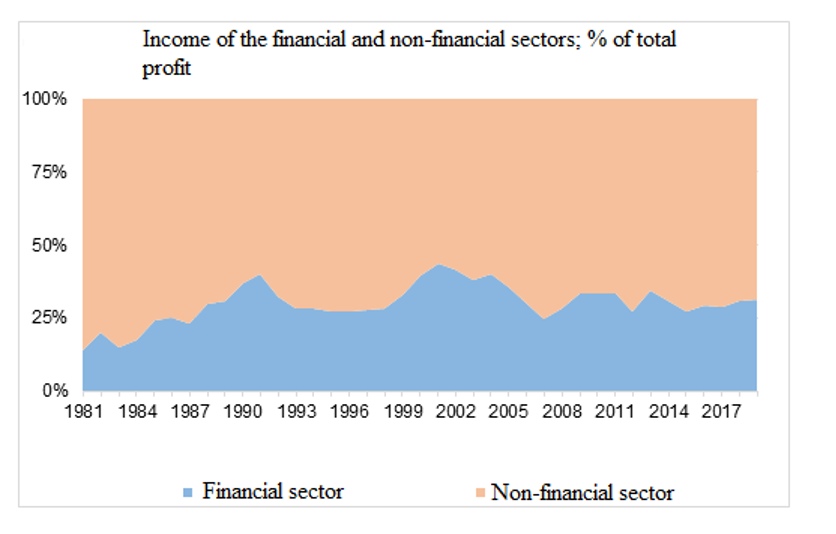
At the same time, in the process of implementing the Reaganomics program (which is one of the varieties of the Bretton Woods model) in the United States, as well as in other countries, the share of the financial sector has increased enormously, primarily in terms of redistribution of total profits to its own benefit. Although current statistics give this sector less than 10% of GDP produced (Fig. 1), its share of profits (Fig. 2) exceeds 30%, and given the redistribution of profits of non-financial companies in favor of their own financial departments, this share should be even higher.
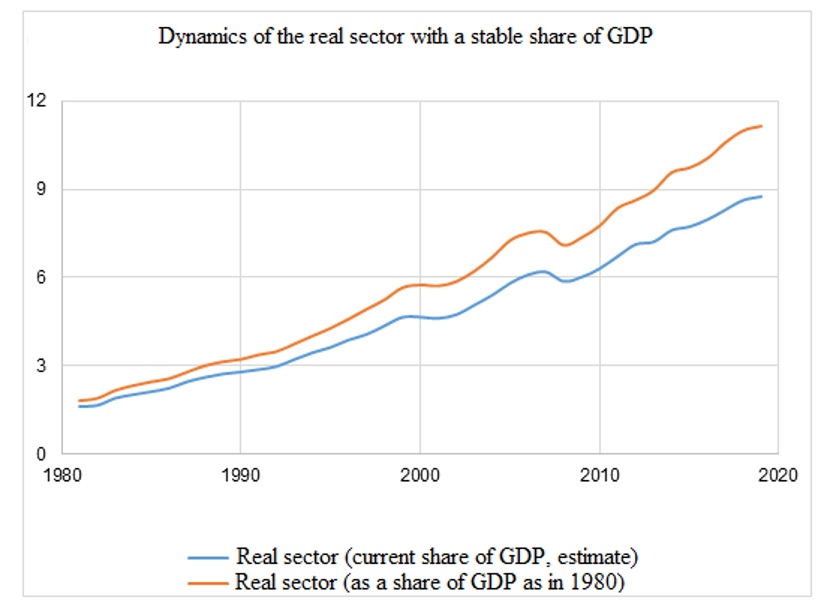
This was due to the gradual decline of the real sector, particularly in the United States. This is understandable, because emissions are the main source of profit. But the scale of what is happening is impressive. If the real sector’s share of GDP had remained at the level of the early 1980s, its volume would have been markedly higher (fig. 3).
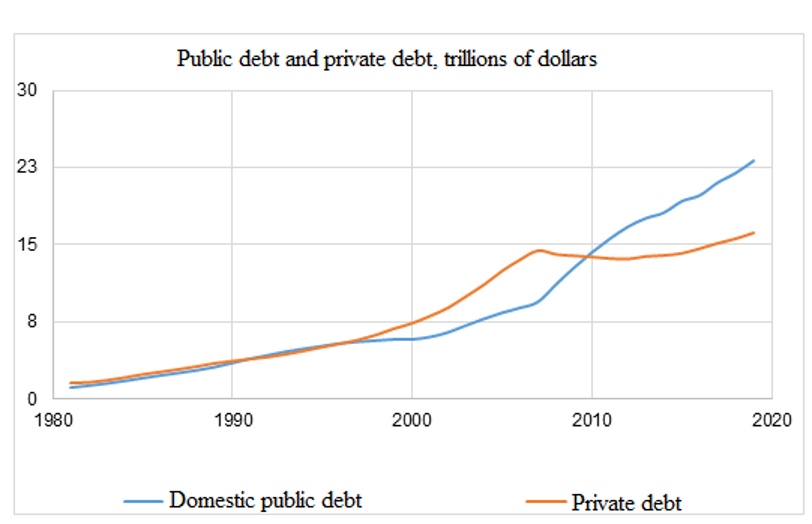
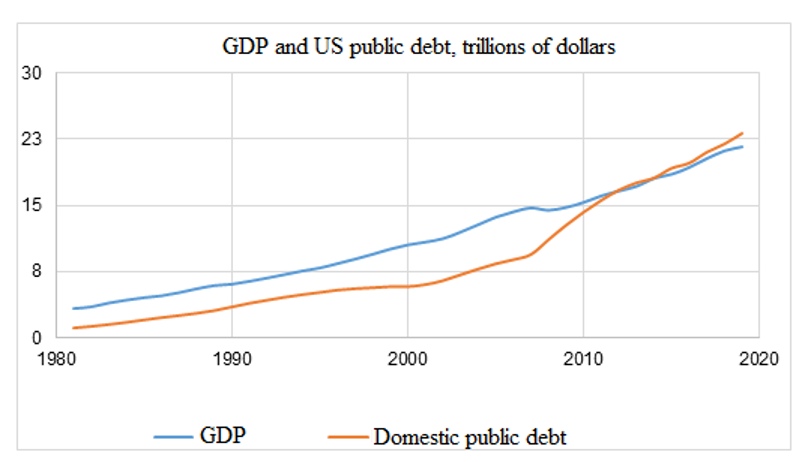
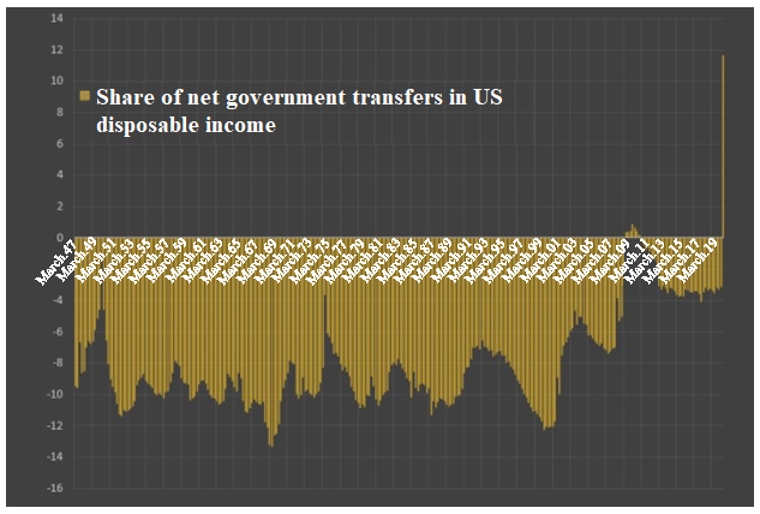
The system currently in place in the US is that money is given to banks in the hope that they will invest in the real sector, but banks do not, seeing that investment in the real sector is unprofitable. Similarly, major companies with huge cash reserves do not invest in the real sector. At best, they invest in financial speculation. There is currently no solution to get banks to invest in the real sector. It is possible to create State institutions for this purpose, but, firstly, these institutions have yet to be organized; secondly, there is always a risk of corruption. The US has no experience in effectively managing such institutions. So the model is no longer working, so you can print any amount of money, and the economy will still fall. However, financial institutions will grow, especially given that it is the financial sector that is used to clean up excess money (emissions to sustain private demand have not been cancelled since 1981, fig. 4 and fig. 5).
The FED is now forced to print money because the financial system lacks it to service debt and invest. As a result, despite the continuing decline in production, the Dow Jones index rose to the level of early 2020. This result is more indicative of the inoperability of the system than of success; this is the threshold of the crisis.
In this situation, two basic economic scenarios clearly formulated as early as the end of 2014 (for example, on 5 March 2014, at the Dartmouth Conference in Dayton, Ohio, by M. Khazin) took on a clear form. The first scenario is in line with the interests of the financial sector and is supported by the Democratic Party. Its rationale is that the US is saving the world’s dollar system at any cost. Second, they save the real sector of the American economy by sacrificing the world dollar system at the cost of its destruction. We’ll call it the first «Biden Plan» and the second «Trump Plan».
In terms of technical differences, they differ in the purpose of the emission. Prior to Trump’s arrival, the FED, by legalizing the emission, carried out a ransom from the securities market of financial institutions (including obviously fictitious ones). With his introduction, emphasis was placed on the redemption of treasury obligations (i.e., the budget, not the financial sector, was supported, see fig. 6).
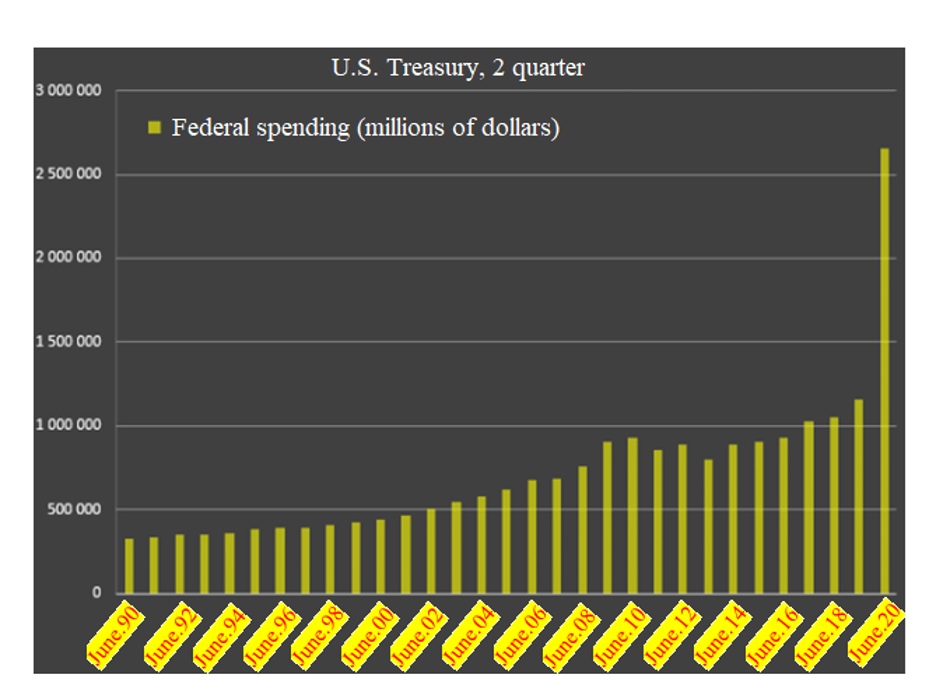
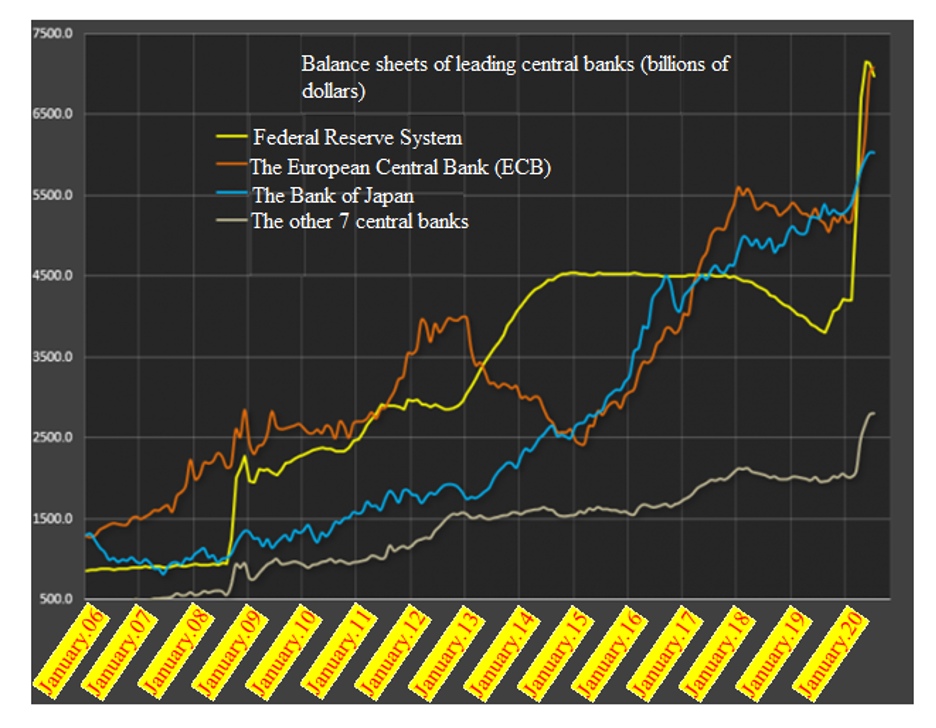
And since the beginning of this year, when the scale of emissions has exceeded all reasonable limits (see fig. 7), real-sector paper has been the dominant source of buy-back. In other words, Trump finally achieved the implementation of his «Trump plan», which may have been the reason for such a rough campaign.
- Trump plan and Biden plan. The tug-of-war between the global financial system and the real US sector for financial support
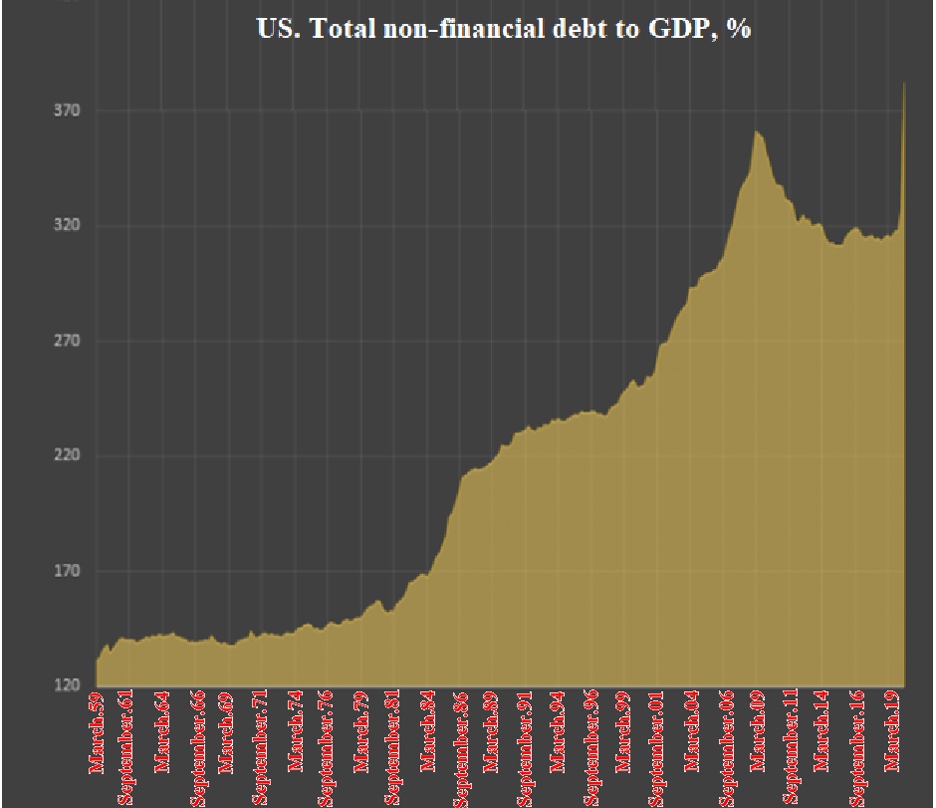
In the aforementioned report on November 5, 2014, M. Khazin noted that by the fall of 2014, US elite groups representing the real economy had become so powerful that they planned to run for president and win presidential elections. The result was Trump’s victory in 2016. The crux of the problem is that it is impossible to combine these two scenarios, which we referred to above as the «Trump plan» and the «Biden plan» even though they objectively emerged long before Biden and, to the greatest extent, Trump, took the lead in American politics. Despite opposition from Congress, the FED, and the entire American establishment, Trump is rigorously advancing his economic plans to return production to the US. And he is prepared to do so even at the cost of destroying the world dollar system. This requires demand, and it is difficult to stimulate it, because after the 2008 crisis, which was suspended but not eliminated, households’ debts amount to 100% of their annual income. As a result, consumers spend money on credit services (see fig. 8, 9). Moreover, it is impossible even to raise rates. «Biden Plan», as noted above, envisages the opposite – the financial sector is supported by finance and the preserved world financial elite at the destruction of the real sector of the USA.
Donald Trump forced the FED to change its policies, though that was extremely difficult. The fact is that today the average return on capital in the world is negative. In this case, the best indicator is the return on deposits. In Western Europe it is already officially negative: -0,05%. This means no reproduction of capital. For this reason, the FED’s leadership, which represents the financial elite, has decided that the rate should be raised. In the US, the rate was zero, so lending to the real economy was loss-making, more specifically, it was stimulated by emission mechanisms. Trump actively opposed the rate hike and, given the development of the crisis, ultimately insisted on his own. It should be noted that a growing share of demand-side support is provided by the budget – private entities are no longer willing to lend to households, knowing that a return of funds is unlikely to follow (see fig. 9). Clearly, this does not contribute in any way to the sustainability of the American financial system.
It was this situation that provoked such fierce (in violation of virtually all unwritten laws) opposition to Trump by supporters of the World financial system, including the US Democratic Party. But at the heart of this is the fundamental question of how the emission money will be distributed, the fate of the real sector of the US economy, and the global dollar (Bretton Woods) system.
- Dynamic modelling
We used dynamic computer simulation to predict the implementation of Biden and Trump’s plans. This method has been developed in the last 50 years by the Doctor of Economics A.A. Kougaenko, who has published a large number of monographs on the subject of research, among others translated into English.
Dynamic modelling is one of the economic and mathematical methods that is significantly different from other methods currently in use. It is designed to display complex objects – socio-economic systems. The socio-economic system is understood to mean such a complex, which includes at least two of the following components: production and consumption of products. Other components of the complex that can be modelled in addition – ecology, social management, defense, demography and others.
Socio-economic object models differ in the way they are constructed. Accordingly, models can be:
- Static, i.e., with a structure that does not change over time, or dynamic, with a variable structure;
- Statistical – extend past statistical data series into the future, or use probability approaches – or Deterministic, where modelling results are well defined and subject only to the changing properties of the model itself;
- Linear, constructed only on linear internal associations of elements, or non-linear, etc.
These alternatives are fundamentally different in terms of the representation of socio-economic systems and the obtained modelling results. To be consistent with such systems, models must meet a number of requirements, such as being dynamic, deterministic (i.e., built without using random values) and non-linear.
- Static and dynamic modelling
Static modelling differs from dynamic modelling in that static models have a constant internal structure that remains unchanged when calculations are made. In a static model, the relationships between parameters are established at a certain point of time and it is assumed that this relationship does not change over time. In fact, the economic situation is quite different: any connections and relationships that can be understood and fixed are constantly changing, and at completely different speeds. During dynamic modelling, a large part of the parameters changes continuously, which in fact happens in the displayed socio-economic systems.
Statistic methods are widely used in modern economic calculations: linear and non-linear programming, balance method and others. Due to the consistent model structure, these methods are used at short time intervals, as every economy is inert but are not suitable for long-term forecasts. Attempts to remedy this shortcoming make the calculations more complicated but do not lead to the required result. The model structure changes during the modelling process, just as it does in the real economy. These changes depend on the way in which the original model was constructed and on any dynamics that occurred in the modelling process up to the point when the forecast results were observed. These changes are twofold: they are introduced either automatically, by the model itself, or as a result of its management. The models are also equipped with management tools: it is possible at any time to change any parameters that make up the economic strategy (tax rates, tariffs, quotas, etc.). For a model to be dynamic, it must include at least one dynamic element (e.g., an integration operator).
An important feature of the dynamic modeling method is the mandatory display data on different resources. They are modeled in two ways: as flows that characterize resource operations performed in a unit of time – how many were produced, moved, or used – and as stacks where only the number of resources is displayed. For example, resource flows include the natural volume of the sectoral output – units of production per year, per quarter; the earnings of the enterprise; the average income of the members of the social group – units of money for a year or a month, etc. and so on. Stacks are modelled in units or tons of resources, money in accounts in millions of rubles or in other currencies, etc.
Another important feature of the dynamic modelling method is the ability to implement continuous processes in the model, which are often displayed in stepwise rather than smooth form. Static calculation methods are unable to respond to rapid changes in parameters, which leads to noticeable errors in the results, whereas dynamic modelling allows to reflect intermittent changes in parameters, which significantly increases the correctness of the project management.
The full text of the report will be available after payment
50 $